Concept of Integrated Approach to Air Pollution and its potential applicability on a wide scale
←
→
Page content transcription
If your browser does not render page correctly, please read the page content below
“Concept of Integrated Approach
             to Air Pollution and its potential
               applicability on a wide scale”

           T. Pignatelli (ENEA), F. Monforti (ENEA)
                       M. Amann (IIASA)
                      pignatelli@casaccia.enea.it
                      monforti@bologna.enea.it
                          amann@iiasa.ac.at

In collaboration with the Ministry for the Environment, Land and Sea, of Italy

               CSD-15 Side Event, New York, May 2007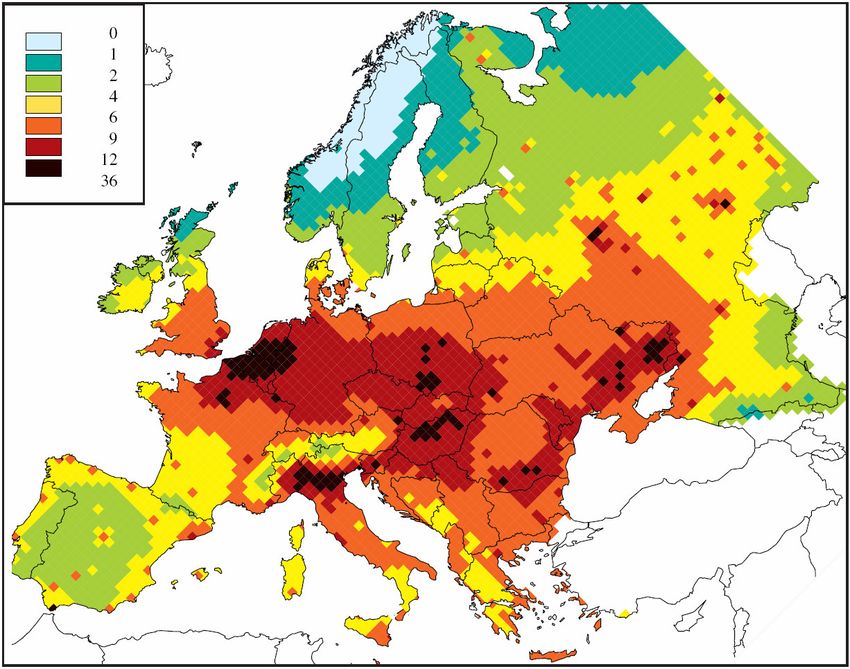
Overview

Introduction
Historical hints
Concept of Integrated Approach – Application to Air Pollution
Examples of application (Asia, Europe, Italy)
Extension of applicability of the Integrated Approach

Conclusions

               CSD-15 Side Event, New York, May 2007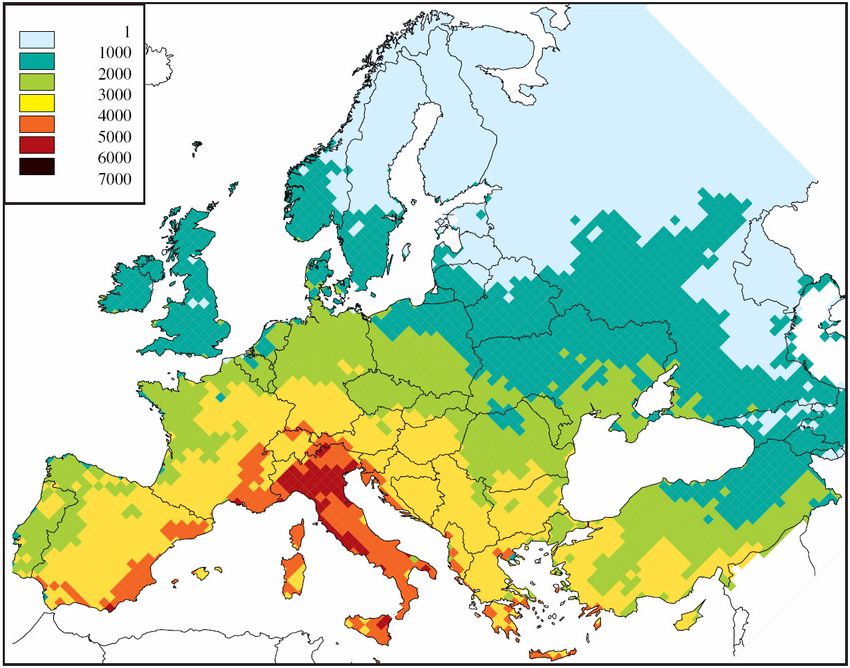
Introduction 1
Economic development without environmental controls –
leads to external disbenefits on human health and
environment – threatens sustainable development

Air pollution is a prime example where negative
impacts on human environment are felt rather immediately

With ongoing economic development industrialized countries
have taken effective counter-measures to control pollution

           CSD-15 Side Event, New York, May 2007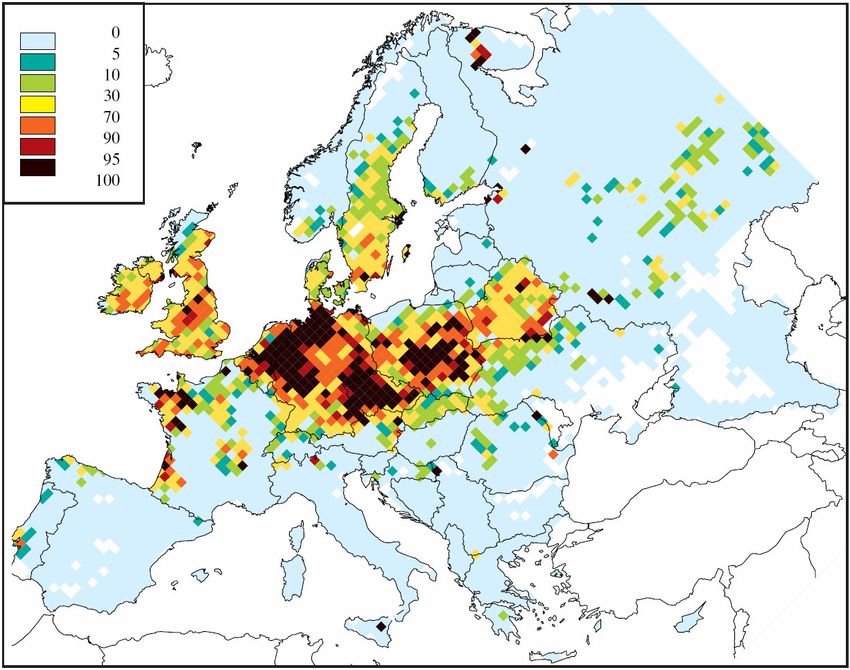
Introduction 2

Developing countries seem to take responsive action -
earlier projections of air pollution indicate trend reversals
at much lower levels of per capita income – and at much
lower levels of per-capita pollution

             CSD-15 Side Event, New York, May 2007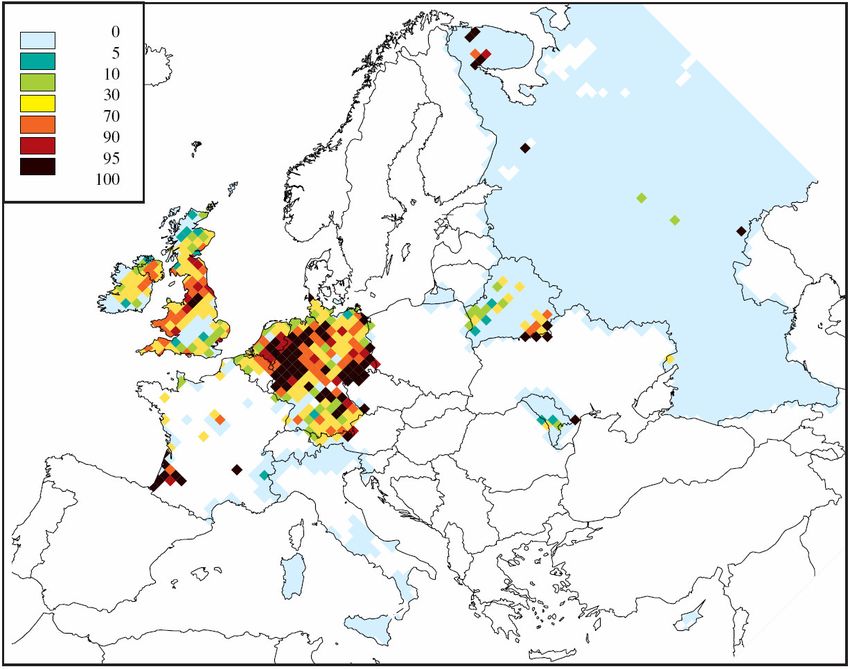
Per-capita NOx emissions
                                                        1940-2030
       100

                                   1970            North America

                75
                                                                                                    2000
kg NOx/capita

                50          1940

                                       Russia
                                                        Europe
                         1960
                25                                               2000                                              2030
                                2000

                                                                                    2030
                                                    East Asia
                            South Asia
                0
                     0             5000         10000         15000         20000           25000          30000     35000
                                                        Per-capita income ($/capita), PPP

                                          CSD-15 Side Event, New York, May 2007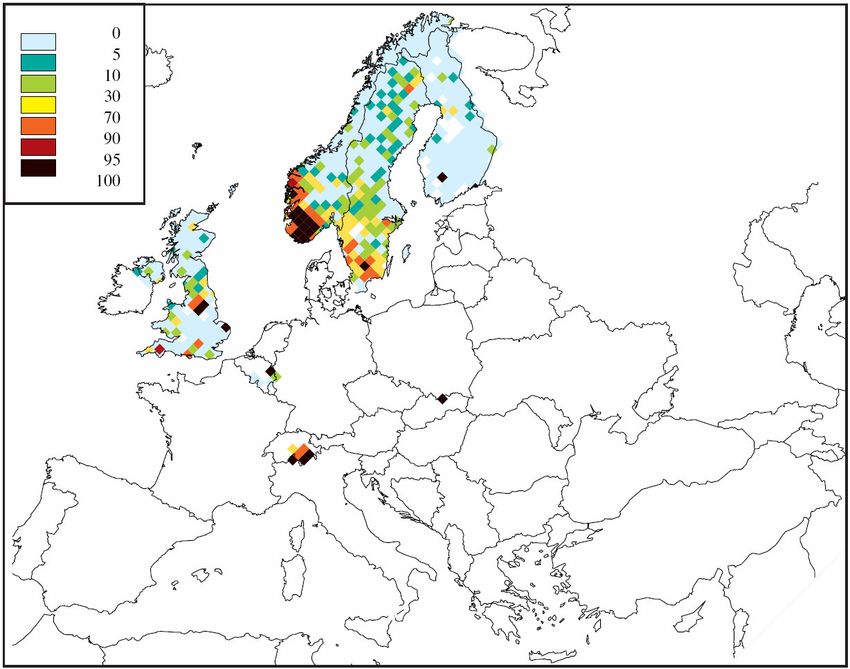
Introduction 3

Critical concern:

How to manage sustainable development /clean air without
compromising economic development :

An integrated approach can indicate action that achieves
maximum environmental benefits at least costs.

               CSD-15 Side Event, New York, May 2007
Historical hints (1)
A successfull example of international cooperation,
aimed at the protection of the environment and the
human health, is given by the Convention on Long
Range Transboundary Air Pollution (CLRTAP), in the
region of the United Nations Economic Commission for
Europe (UN-ECE)
CLRTAP was signed in 1979, (the 25th anniversary
celebrated in December 2004). It has been the first
legally binding treaty for the protection of the
environment. Nowadays, ratified by 51 parties.

          CSD-15 Side Event, New York, May 2007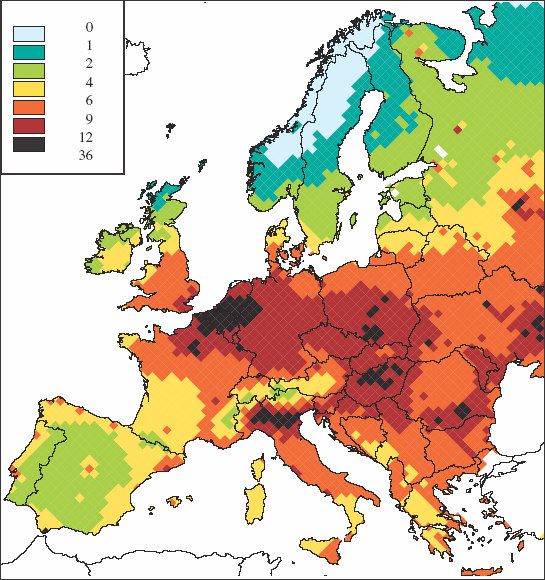
Historical hints (2)
The starting point was the acidification effects detected,
in the sixties, in the Scandinavian rivers and lakes, due
to the transboundary nature of some air pollutants, like
sulphur oxides, recognized by extensive international
research.

In the seventies, the acidification became an issue in
Canada, as several studies demostrated the link between
sources in USA and Eastern Canada and the acid
deposition in the sensitive Canadian Shield. Hence, the
extention of the geographical scope to North America

            CSD-15 Side Event, New York, May 2007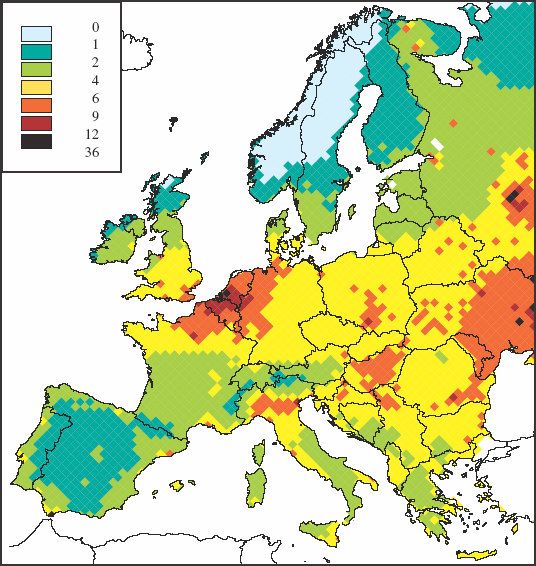
Historical hints (3)
Against the background of the cold war, CLRTAP
succeeded in building trust between political blocks,
increasing awareness and finally defining legally
binding protocols, to take common actions.

The driving forces have changed over time, from
politics to public concern, environmental damage and,
more recently, health concern.

           CSD-15 Side Event, New York, May 2007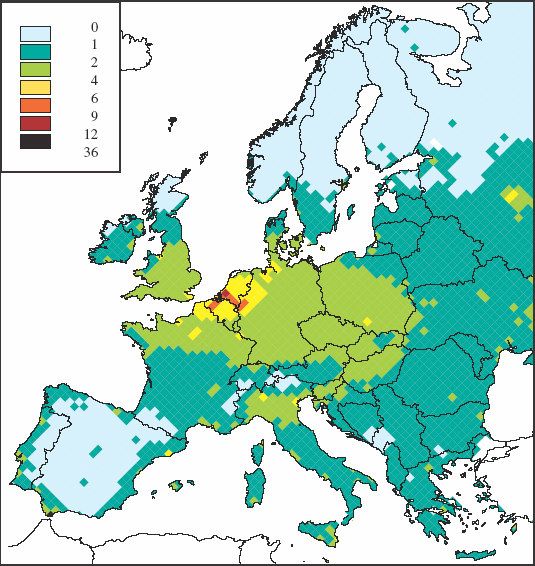
Historical hints (4)
Along years, with the improvement of the scientific
knowlegde and awareness, other effects related to air
pollution were taken into account. Damage to forest,
crops, materials and human health became increasingly
evident, due to other pollutants (e.g. Nitrogen oxides
and ozone)

At the same time it became clear the causes of those
effects were correlated among them, and had to be
addressed simultaneously. The “Integrated Approach”
concept was born.

           CSD-15 Side Event, New York, May 2007
Historical hints (5)
The Protocols of the CLRTAP
Among the 8 Protocols established within CLRTAP, the 1999
Protocol to Abate Acidification, Eutrophication and Ground-level
Ozone, entered into force on 17 May 2005, is the first example of
legally binding instrument based upon a multi-pollutant, multi-
effect approach applied to the Air Pollution.
The Gothenburg Protocol implies actions to be taken by
the ratifying Parties for a simultaneous reductions of
emissions for the SO2, NOx, NH3, and VOC pollutants.
CSD-15 Side Event, New York, May 2007Concept of Integrated Approach (1)
The solution of complex problems, like combating the
effects of Air Pollution, implies the investigation of all
the concerned aspects, looking at links, sinergies and
trade-offs, pursuing the most effective actions to
simultaneously address the causes behind.
In addressing the Air Pollution, science research issues,
technology developments, impact on the environment and
human health, macro-economic aspects, social
implications, etc. are simultaneously tackled.
CSD-15 Side Event, New York, May 2007Concept of Integrated Approach (2)
Integrated Assessment Approach applied to Air Pollution
Simplified flow chart
Economic Emissions Atmospheric Depositions &
Development dispersion concentrations
Anthropogenic
activities
Costs of Control Health/Env
implementation technologies Effects
GDP/capita
Social aspects
costs
CSD-15 Side Event, New York, May 2007Concept of Integrated Approach (3)
The application of the previous schema allows:
Multi-scenario analysis (e.g. business as usual, etc)
Target settings (emission, impact, costs, etc)
Cost-benefit analysis
Identifying specific mitigation measures for all atmospheric
pollutants across all economic sectors that achieve the
environmental targets at least costs
CSD-15 Side Event, New York, May 2007Concept of Integrated Approach (4)
Introduction and evaluation of economic instruments (emission
trading)
Evaluation of the level of social equity in policy development
Evaluation of relative contributions from different
geographycal areas (even at hemispherical level)
CSD-15 Side Event, New York, May 2007Concept of Integrated Approach (5)
Assumed the general applicability of such methodology, the
Integrated Approach has been applied to Air Pollution,
encoding the principles in proper modelling tools
Ad hoc Integrated Assessment Model (IAM) have been
developed and successfully applied, in the development of
environment policies, in the frame of CLRTAP, in Asia, in the
European Union.
More recently, even at national level IAM Projects have
started, like in Italy and the Netherlands. Other EU Countries
are considering similar projects (e.g. Sweden, Ireland)
CSD-15 Side Event, New York, May 2007Application of integrated
assessment models to
Air Pollution
CSD-15 Side Event, New York, May 2007Energy/agricultural Driving forces projections Emission control options Emissions Costs Atmospheric dispersion Health and environmental impacts
%       %

                                        Costs of emission controls
                                                   $       #       "   !

                            !
                                    √          √       √       √       √
Quantification of impacts

                                                       √       √
                                            Quantification of physical
                                                       √ interactions
                                            and chemical       √
                                            in the atmosphere
                                                √      √               √

                                                       √               √
& &
' % (
Energy/agricultural Driving forces
projections
Emission control
options
Emissions Costs OPTIMIZATION
Atmospheric dispersion
Health and Environmental
environmental impacts targets" % ( &
' )
Minimize total emission control costs
$ # " !
Environmental policy targets
!
√ √ √ √ √
a tion
ti m iz √ √
Op
√ √
√ √ √
√ √Examples of implementations for
Europe and Asia
CSD-15 Side Event, New York, May 2007&
* + " " ( , % - &
. /001
. 2 - % /000
* +
. &/003
. " /000
. " 4 $556
. ( " $553( $555%$5$5
"4 - 7 +%$6
180%
160%
140%
120%
100%
80%
2000 2005 2010 2015 2020
GDP Primary energy use Passenger km
Freight ton-km Cattle lifestock Sea transport, # & & $555
- - 8 9
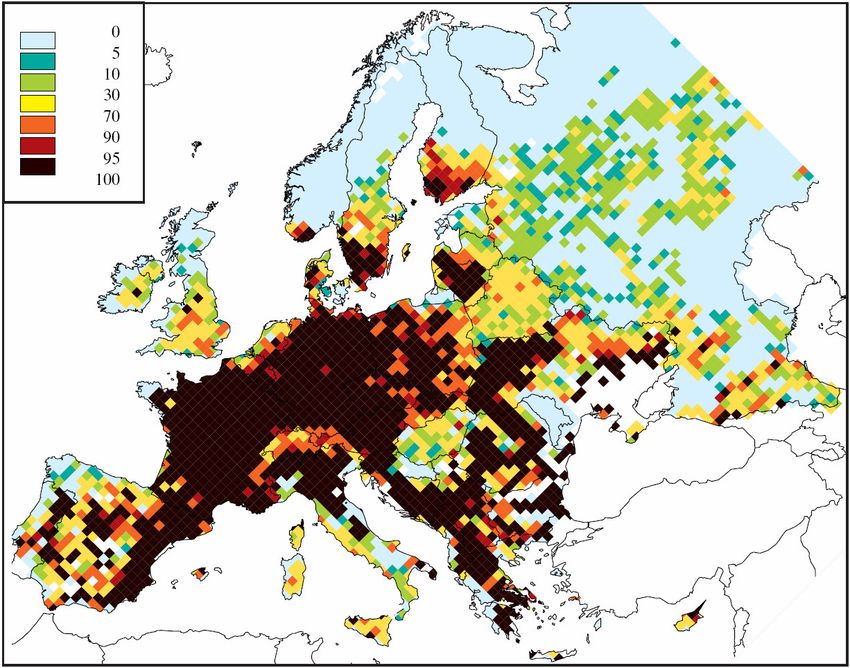
Loss in average statistical life expectancy due to identified anthropogenic PM2.5
Calculations for 1997 meteorology(
$555
PM Eutrophication Ozone
Acid, forests Acid, lakes Acid, semi-nat. ecos.( $5$5
, # & - - $:
68 9
2000 2020 2020
Current legislation Maximum technically
feasible reductions
203 mio YOLLs 136 mio YOLLs 96 mio YOLLs"
& +" 4 ;
" 4<
16000
14000
12000
Annual Cost Millions
10000
8000
6000
4000
2000
0
0% 10% 20% 30% 40% 50% 60% 70% 80% 90% 100%
Health improvement
(Change between current legislation baseline and maximum measures)" (
-& &
Courtesy of Les White
16000
14000
12000
RAINS
Annual Cost Millions
10000 cost-
effectiveness
8000
approach
“Equal
technology”
6000
approach
4000
2000
0
0% 10% 20% 30% 40% 50% 60% 70% 80% 90% 100%
Health improvement
(Change between current legislation baseline and maximum measures)" - & $5$5
; ! $556<
Billion Euros/year
150
100
50
0
Case "A" Case "B" Case "C" Maximum
technical
measures
Costs for road sources SO2 costs NOx costs NH3 costs
VOC costs PM costs Benefits Uncertainty( (
+ & $5$5
$555= /55>" ( (
+ &7-&
5
4
Billion /year
3
2
1
0
National projections PRIMES 20 PRIMES 90
SNAP 1: Power generation SNAP 2: Non-industrial combustion SNAP 3: Industrial combustion
SNAP 4: Industrial processes SNAP 5: Extraction and distribution SNAP 6: Solvents
SNAP 7: Road transport SNAP 8: Off-road machinery SNAP 9: Waste treatment
SNAP 10: Agriculture"
*
& " &:
* " % ( -& ?
* @&
. &- % ( '
. -& ? 7
# (
. ( & &
. & ' ? - ? - :
&
*
* A- - -B (* %
* "
. & $551
. % % &$553
*
* &MINNI – The Italian Integrated model.
A tool for scientific support to policies in the
field of air pollution.
CSD-15 Side Event, New York, May 2007Scenario
Atmospheric Modelling
System RAINS Italy
MINNI
National
Integrated
Model
Transfer matrix
CSD-15 Side Event, New York, May 2007ECMWF fields Space,time,
Local data Reference species info
inventory
Meteo
Emission
Sub RAMS Emission
Manager sub-system
system
Reference Reference
meteo year Emission year
EMEP B.C.
FARM
Transfer
Chemical-trasport Concentration matrices
RAINS
sub-system Deposition
CSD-15 Side Event, New York, May 2007
MINNI: atmospheric moduleResolution 20 km Resolution 4 km
CSD-15 Side Event, New York, May 200720
15
10
5
1
0
g/sNOx Emissions – CLE - Italy
1400
(kt/year) Other
1200
Industrial Process
1000 Power plants
800 Ships
Off-road Transport
600
Road Transport
400
Domestic
200 Industrial Comb.
Refineries
0
2000 2005 2010 2015 2020 2025
CSD-15 Side Event, New York, May 2007SOx deposition – CLE - Italy CSD-15 Side Event, New York, May 2007
PM10 Concentrations – CLE
         - Italy

CSD-15 Side Event, New York, May 2007
Transfer matrix
12 12
5200000 5200000
11 11
10 10
5000000 5000000
9 9
8 8
4800000 4800000
7 7
4600000
6 4600000 6
5 5
4400000 4 4400000 4
3 3
4200000 2 4200000
2
1 1
4000000 4000000
0 0
200000 400000 600000 800000 1000000 1200000 1400000 -1 200000 400000 600000 800000 1000000 1200000 1400000 -1
Percentage abatement of annual average PM2.5 concentration following
50% abatement of Nox emissions Lombardy (sx) e Lazio (dx)
CSD-15 Side Event, New York, May 2007Other “Side benefits”
Setting up an up-do-date Atmospheric Modelling Systems
provides the national policy makers with a tool suitable to test
options in addition to the typical RAINS scenarios.
This is a further opportunity for “spot” applications of the
modelling system to develop policy strategies involving a
limited number/kind of sources and/or a limited area.
CSD-15 Side Event, New York, May 2007“Side benefits” - Examples CSD-15 Side Event, New York, May 2007
“Side benefits” - Examples

• Evaluation of future
power plants in Po Valley

               CSD-15 Side Event, New York, May 2007
“Side benefits” - Examples
Application of PM
filter to off-road
vehicles
CSD-15 Side Event, New York, May 2007PM10 Composition – 1999 -
Italy
Primary Secondary“Side benefits” - Examples Ground level NO2 - MINNI Ground level NO2 – Piedmont CTM
Future developments of AMS

Extension to other meteorological years to better assess
uncertainties.

Contnuous improvement of physical chemical desciption

Evolution to a national air quality forecast system. (TBE).

             CSD-15 Side Event, New York, May 2007
Extension of the integrated
approach
CSD-15 Side Event, New York, May 20072 %
% ' ? # 2!2
"4"
$ # "
" !
! " $ "!1 $ !4"
$ #
4C
!
√ √ √ √ √
√ √ √
√
√ √
√ √
√
√ √
√ √
√
√ √
(
% √ √ √ √
%( √ √ √ √ √
%( ! √ √ √" 2!2 $5$5
+%$672
+2% CO2 -8% CO2 -20% CO2
120
100
80
Billion /yr
60
40
20
0
National energy and agricultural With 20 carbon price (-8% CO2) With 90 carbon price (-20%
projections (+2% CO2) CO2)
Costs for current legislation on air pollution Additional costs for TSAP Additional costs for the CO2 reduction% #
/015%$5 5
100
1970 North America
75
2000
kg NOx/capita
50 1940
Russia
Europe
1960
25 2000 2030
2000
2030
East Asia
South Asia
0
0 5000 10000 15000 20000 25000 30000 35000
Per-capita income ($/capita), PPP2 % 2 . &
2   %
2       .   &
* 4C B # %
. !' ) - D
. !' # ) & - ' 2!2
D
. "
* B
. & & ; <
. & ;2 & 7
72A '
; B ( -& <
1200%
1100%
1000%
900%
800%
relative to 2000
700%
600%
500%
400%
300%
200%
100%
0%
2000 2005 2010 2015 2020 2025 2030
Population GDP Coal use for power generation'
$5$5 ( $5557 ( 2 % 7
800%
700%
2000
year 2000
600%
to year
500%
relative to
Emissions relative
400%
300%
Emissions
200%
Level in 2000
100%
0%
PM10 SO2 NOx CO2
Coal with current air pollution (AP) standards Coal + advanced air pollution control
With IGCC for new plants after 2015 IGCC + carbon capture" &
7$5$5
15
Uncertainty range
13 quoted by IPCC
10
Billion $/year
8
5
3
0
Conv. coal with current AP Coal + advanced air pollution With IGCC for new plants after
standards control 2015
IGCC Coal costs PM control SO2 control NOx control"
* %-
2!2
. & ( ( '
. ? 2!2
& ( -
* " '
- '
* 4 & ; ::
7 & &<
&:
. # - % ;
- % 7 7 :
<Conclusions
The Economic Development implies environmental
controls, to be sustainable.
The Integrated Approch provides measures to achieve
environment/health targets at least costs, taking into
account of social aspects, too.
The Integrated Approch to Air Pollution, can be applied
to other geographical areas and extended to additional
pollutants and also to consider other perspectives.
CSD-15 Side Event, New York, May 2007Acknowledgements
The Ministry for the Environment, the Land and the Sea, of Italy
The Secretariat of UN-ECE LRTAP
The EU Commission
CSD-15 Side Event, New York, May 2007You can also read