Masterflex Group May 2018
←
→
Page content transcription
If your browser does not render page correctly, please read the page content below
Masterflex Group May 2018
Overview

                  Technology leader in high-tech hoses and connection
                  systems

                    Founded in 1987 in Herten, Germany

                    14 locations in Europe, America and Asia

                    Recognized multiple times as a technology leader

                    2017: Growth with sustained improvement in operating EBIT

                         Revenues up 12.3% to € 74.7 million

                         Operating EBIT up 16.1% to € 7.1 million

                    Significant extension of growth strategy in 2017

                    Active role in consolidation of the high-tech hoses market

© Masterflex SE                                                                  2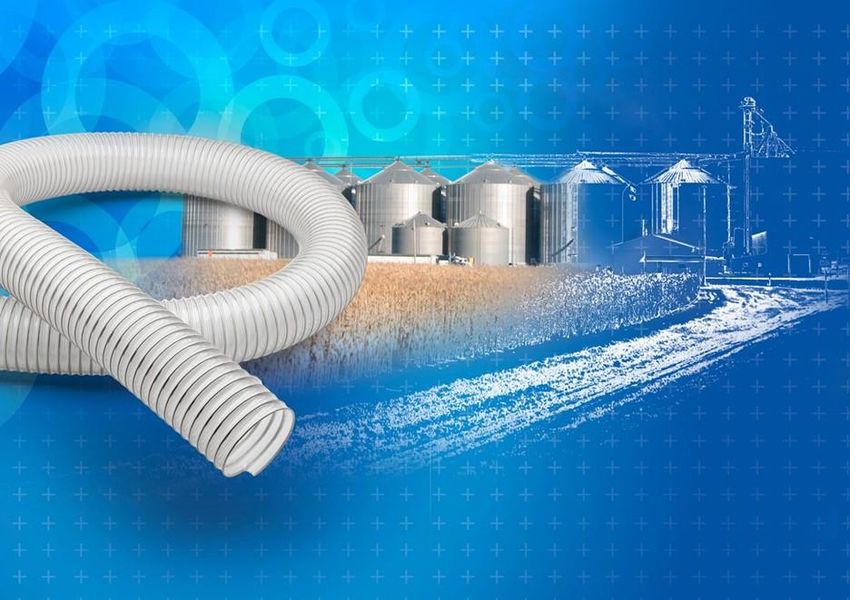
Business Model
Specialist in the Hoses Market

Segments by products and lot sizes                                                                 Customer-
                                                                                                    specific
      Overall market volume: € 21 billion                                                         solutions for
                                                         Special
                                                                                                     OEMs
      (Europe, America, Asia)                          applications,
                                                       small-scale
                                                        production
      Volume of specialty hoses market:
      € 2 billion

      Our long-term goal: € 200 million in
      revenues
                                                                          Standard products
                                                                       (large-scale production)
      Our solutions: durable connections for
      transport of gases, fluids and solid materials
      satisfying special requirements

      Service-focused sales with our own
      development services

 Data: ProdCom/Eurostat; own compilation                        Masterflex Group products: everything from a single source

© Masterflex SE                                                                                                              4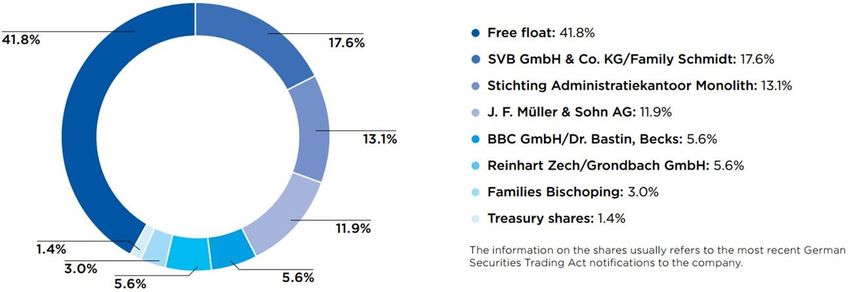
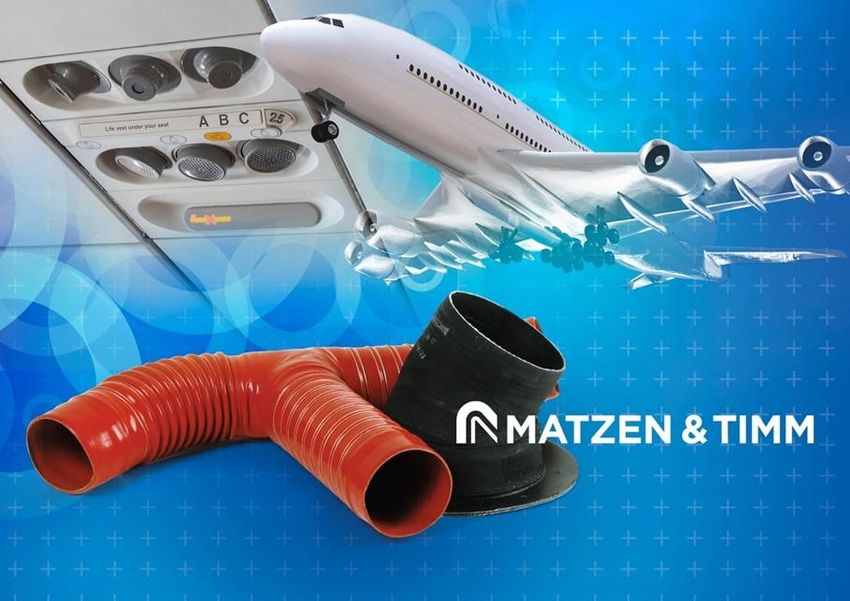
Consumer Sectors
with Special Requirements

                                    Consolidated revenues:

                                         € 74.7 million

          Industrial                             Aviation                          Medical technology

   Automotive          Processing      Railway              Energy   Mechanical               Food and
                                                                     engineering           pharmaceuticals

© Masterflex SE                                                                                     5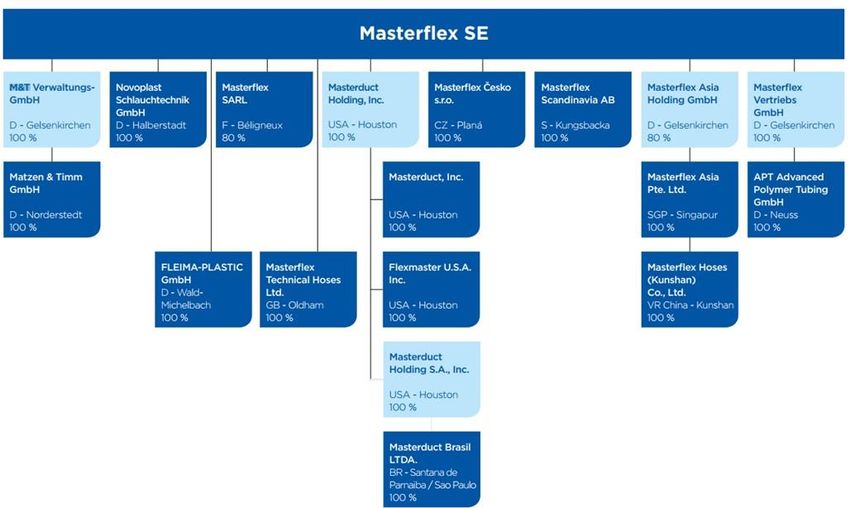
Product Portfolio Expanded

    Brand         Product      Materials          Competitors

                                PU, PVC,               Schauenburg,
                                  fabric               Norres, Merlett

                             VMQ (silicone),         Hutchinson, MST,
                             CMS (Hypalon®)               Flexfab

                                PU, PVC,                Modenplast,
                                 PA, PE             Medi-Line, Raumedic

                                    PC                Borla, Promepla,
                                ABS, PVC               miscellaneous

                                PU, PVC,       Hi-tech Duravent, Flexaust,
                                  metals                Kanaflex

                                FEP, PFA,
                                  PTFE          Optinova, Saint Gobain

© Masterflex SE                                                              6
Overview of APT Advanced Polymer Tubing

Our new subsidiary
      Acquired on 1 January 2017
      Founded in 2011
      Product portfolio: tubing with diameter of 0.2
      to 130 mm and shrink tubing
      Sales mostly in German-speaking countries
      Around 30 employees
      Revenues in mid-single-digit EUR millions with                    with
      double-digit EBIT margin
      Continuity in APT's management
      Strong sales potential: new regions and target industries
      Group acquires additional technological and materials expertise

© Masterflex SE                                                                7
Additional Growth through M&A

Criteria for further acquisitions in the hoses market

      Business model: Target company develops or manufactures hoses, hose systems
      or connection systems, or materials/components for those products

      Materials expertise: Focus on high-tech plastics and other synthetic polymers

      Regional focus: Regions of the internationalization strategy

      Consumer sectors: Focus on "white" industries (medical technology, food, pharmaceuticals)

      Profitability: Focus on strong and sustained EBIT margin

      Products: Expanding Masterflex Group's portfolio

© Masterflex SE                                                                                   8
Growth Strategy: Extension

        Developing disproportionate                                       Expanding technology
        potential in America and Asia                                     leadership

        Stronger revenue balance                                          Very close cooperation with
        between Europe and                                                customers in development
        America/Asia                                                      work

                                            Internatio-                   Leading solutions for flexible
                                            nalization       Innovation   connection systems with
                                                                          high-tech plastics

                                           Digital
                                           trans-         Operational
        Digitizing our products                           excellence      Basis for profitable growth
                                           formation
                                                                          and revenues over € 100
        Creating new service offerings
                                                                          million
        Industry-4.0-capable machine
                                                                          Measures for scaling and
        park
                                                                          improving efficiency
        Increasing the company's agility
                                                                          New areas of expertise

© Masterflex SE                                                                                            9
Digital Transformation
in the Product Segment

                         Network-compatible and intelligent hoses

                           Implementation of added digital functions

                           Customer- and application-specific added value

                           Nucleus for smart services
                           – with potential for new business models

© Masterflex SE                                                        10
Financial Data
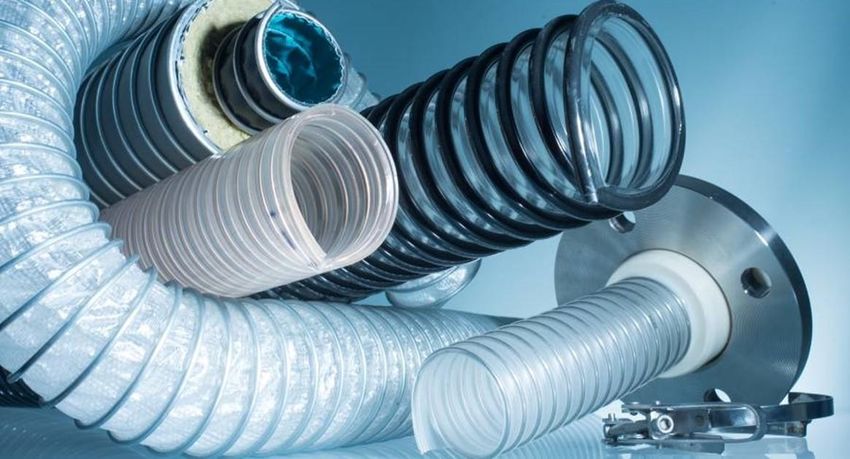
Clear Revenue Growth
Consolidated revenues
in € millions
2017: growth exceeds forecast
74.7
Revenues up 12.3%
66.5
62.5 64.1 (previous year: up: 3.7%)
57.9
1/3 organic growth
2/3 of growth through acquisition of
APT Advanced Polymer Tubing GmbH
Broad-based growth at nearly all
locations
2013 2014 2015 2016 2017
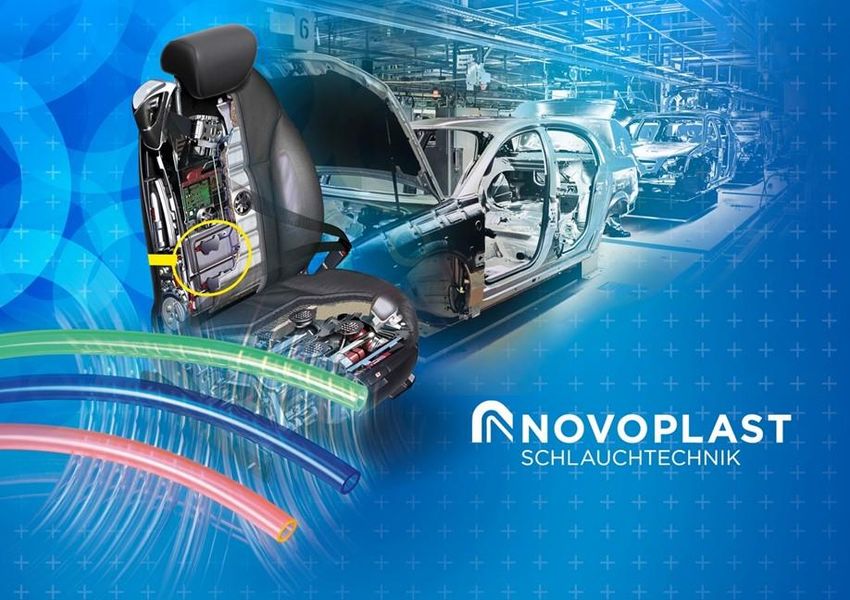
© Masterflex SE 12Improvement in Operating Earnings
Consolidated EBIT and EBIT margin (operating)
in € millions
7.1
Further improvement in profitability
6.1 6.3 6.1
Earnings growth forecast met
10.6% 4.9 Target margin of 10% just missed
10.1%
9.2% 9.5%
Unexpected one-off effects of around
7.6% € -0.4 million
Cost of materials ratio: 32.2%
(previous year: 31.0%)
Personnel expense ratio: 37.8%
(previous year: 39.5%)
APT already making a positive
contribution to earnings
2013 2014 2015 2016 2017
EBIT margin
EBIT-Marge
© Masterflex SE 13Jump in Net Income
Consolidated net income
in € millions
4.3 2017 net income up 47.2%
Net financial income: € -1.2 million
(previous year: € -1.3 million)
Earnings per share: € 0.45
3.0 (previous year: € 0.34)
2.9
2.6 Includes one-off tax effects
Dividend proposal: 7 ct/share
1.9 (previous year: 5 ct/share)
Continuation of new dividend policy
adopted in 2017: constant distribution
at level at least as high as previous
year
2013 2014 2015 2016 2017
© Masterflex SE 14Equity Strengthened
Consolidated shareholders' equity & equity ratio
in € millions
47.5% 51.2%
45.9% Equity up by 30.3%
40.7% 37.4 Influx of funds from cash capital
37.1% increase in the amount of € 5.9 million
Consolidated earnings of € 4.3 million
28.7
Negative effects from currency
23.9 differences
21.2
18.9 Masterflex SE's equity ratio at around
60%
Solid basis for further growth and
continuation of the dividend policy
2013 2014 2015 2016 2017
© Masterflex SE 15Solid Balance Sheet
Change in ASSETS Change in LIABILITIES
73.0 73.0
60.4 60.4
45%
51%
51% 48%
15%
7% 28%
38%
39% 0%
42%
0%
21%
15%
31.12.2016 31.12.2017 31.12.2016 31.12.2017
LT Assets A. Plus
Non-current Intangibles Current
Plusintangibles N A. Current Pensionen
Kurzf. Verb. L. PensionsLangf.
Non-current Capital
Verb. L.EK
© Masterflex SE 16Cash Flow Strengthened
Cash flow and investments
in € millions
Internal financing capacity and
2016 2017 capitalization improved
Operating cash flow 6.2 8.3 Operating cash flow up by 34.2%
Cash flow from Investments in 2016 and 2017 well
-8.7 -13.4
investment activities above the multi-year average due to
construction of an annex at the
Cash flow from
1.8 6.9 Gelsenkirchen and the APT
financing activities
acquisition.
Mid-year utilization of the acquisition
facility and partial repayment to € 9
million.
Cash flow from financing shaped by
the cash capital increase.
© Masterflex SE 17Q1/2018: Satisfactory Start
Key figures of 1st quarter
in € millions
2017 2018 Stable revenue and earnings
development
Revenues 20.0 20.0 Revenue level of the very strong first
quarter of 2017 confirmed
EBITDA 2.7 2.8 Earnings slightly exceeded the good
figures of the prior-year quarter
EBIT (operating) 2.0 2.0
EBIT margin at previous year´s level
of 9.8 %
Net income 1.0 1.2
Significant net income and EPS
growth
EPS (€) 0.10 0.13
© Masterflex SE 18Q1/2018: Stable Development with Potential
Quarterly revenues Quarterly EBIT
in € millions in € millions
25,0 2,5
20.0 2.0
20,0 2,0
20.0 2.0 2.0
18.8 18.8
1.8
17.1
15,0 1,5
1.3
10,0 1,0
5,0 0,5
0,0 0,0
1/18 1/17 2/18 2/17 3/18 3/17 4/17 1/18 1/17 2/18 2/17 3/18 3/17 4/17
Potential for further growth
Dampening effects on revenues in the 1st quarter lead to high order backlog
End of 2012 litigation without impact on results in 2018
© Masterflex SE 19Our Outlook
Forecast for 2018
Revenue growth between 4% and 8%
(i.e. revenues of between € 77.7 million and € 80.7 million)
Confirmation for current earnings power
(i.e. operating EBIT up from previous year's value of € 7.1
million)
Mid- and long-term perspective
EBIT margin of well above 10%
Market leader in all addressed markets
Growth also through further acquisitions in the market
Active role in consolidations in the high-tech hoses
market
© Masterflex SE 20Shares and Shareholders
Share Price: Overall Gain of 33% in 2017
Stock performance since the start of 2017
4 May 2018
Stock price: strong gains
Share price up 32% in 2017
2017 dividend of 5 ct/share
Successful capital increase in March
2017
Market cap: € 84.0 million (31.12.)
Continuous research from:
Bankhaus Lampe
(Buy; € 10.50)
DZ Bank (Hold; € 9.20)
SMC Research (Buy; € 10.00)
Masterflex SDAX
© Masterflex SE 22Shareholder Structure after the Capital Increase Breakdown of the capital stock (9.8 million shares) © Masterflex SE 23
Appendix:
Financial Calendar

2018 financial calendar

29 March                                 Financial press conference

11 May                                   Q1/2018 press release
 14/15 May                               DFVA Spring Conference

26 June                                  Annual General Meeting in Gelsenkirchen

 10 August                               2018 half-year report
  9 November                             Q3/2018 press release

 26-28 November                          German Equity Forum

Contact person: ir@masterflexgroup.com

CFO                                      Mark Becks

IR                                       Frank Ostermair (Better Orange)

© Masterflex SE                                                                    24
Appendix:
Masterflex Group

Organizational chart of the Group

© Masterflex SE                     25
Appendix:
Masterflex Group's Corporate Officers

Executive
Board
                           Dr. Andreas Bastin                      Mark Becks
                                Chairman (CEO)                     Finance (CFO)

Supervisory
Board
                  Georg van Hall                 Dr. Gerson Link              Jan van der Zouw
                     Chairman                    Deputy Chairman                   Member

© Masterflex SE                                                                                  26
Appendix: Key Figures in an Annual Comparison in T€ 31 Dec. 2017 31 Dec. 2016 Change Revenues 74,675 66,486 12.3% EBITDA 10,263 8,811 16.5% EBIT (operating) 7,081 6,097 16.1% EBIT (adjusted) 6,601 5,897 11.9% EBT 5,420 4,574 18.5% Consolidated earnings from continued business units 4,365 3,418 27.7% Consolidated earnings from discontinued business units -62 -555 88.8% Consolidated earnings 4,311 2,928 47.2% Earnings per share (€) 0.45 0.34 32.4% EBIT margin (%) (operating) 9.5 9.2 Number of employees 642 601 3.3% Consolidated shareholders' equity 37,396 28,701 30.3% Consolidated total assets 72,967 60,412 20.8% Consolidated equity ratio (%) 51.3 47.5 © Masterflex SE 27
Appendix:
Legal Notice
This presentation contains forward-looking statements about future developments which are based on management‘s current estimates and forecasts. Such forward-looking
statements can be identified by words such as "expect," "would," "might," "as high as," "possibly," "assume" and similar words. These statements are subject to risks and
uncertainties. If one of these uncertainty factors or other unpredictable events arise, or if the assumptions underlying the statements prove to be incorrect, actual
developments may deviate materially from those specified in these statements or from the potential developments implicitly expressed in the statements. The company does
not intend and assumes no obligation to routinely update forward-looking statements, as these are based exclusively on circumstances as of the date of their publication.

Photo credits: All photos © Masterflex SE except:
Slide 2          © Handelsblatt-Verlag, www.top-100, DEUTSCHLAND TEST FOCUS-MONEY Redaktions-GmbH
Slide 3          © zoja–Fotolia.com
Slide 5          Autoindustrie: © Nataliya Hora–Fotolia.com, Bahnindustrie © Petair–Fotolia.com,
                 Luftfahrt: © arquiplay77–Fotolia.com, Erneuerbare Energie: © F.Schmidt–Fotolia.com
Slide 20         © psdesign1–Fotolia.com

© Masterflex SE                                                                                                                                                         28
You can also read