Company Presentation 30 June 2021 - Company presentation 30 June 2021
←
→
Page content transcription
If your browser does not render page correctly, please read the page content below

Company Presentation
                                         30 June 2021

Company presentation 30 June 2021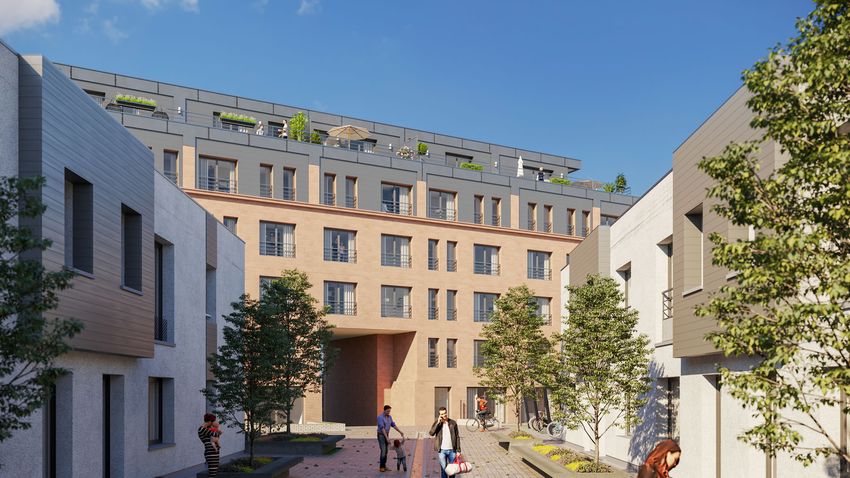
Landlord of choice

          We offer more than just a place to live.

We provide our tenants with a place to build their lives in
      properties that shape vibrant communities.

It is our explicit ambition to be the “landlord of choice” for
                            tenants.

                                        Company presentation 30 June 2021   2
Topics

1.   Company profile
2.   Real estate portfolio 1H 2021
3.   Key activities 1H 2021
4.   Financial results 1H 2021
5.   HOMI share
6.   Outlook

                                     Company presentation 30 June 2021   3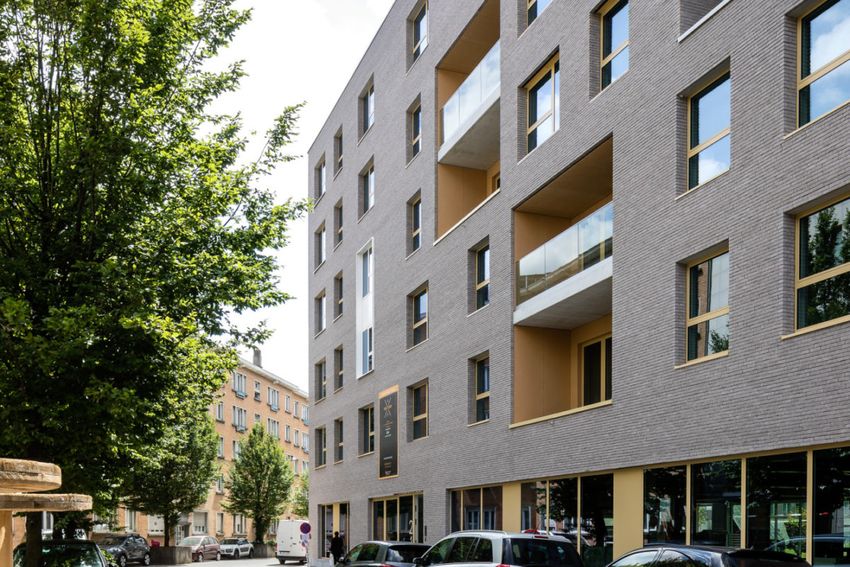
Company profile

       Company presentation 30 June 2021
Home Invest Belgium at a glance

           Listed Belgian REIT                                                     € 391 mio market capitalisation
                                                                                                 as on 30 June 2021

• Number 1 owner and manager of residential properties in Belgium

• Listed on Euronext Brussels since 1999
                                                                                                                         Van Overstraeten Group
• A specialist with 20+ years of experience…                                                                                     26.7%

• … and 20+ years of consecutive dividend growth
                                                                                    Free float
• Over 40 dedicated professionals                                                     54.4%

                                                                                                                                AXA Belgium
• HQ in Brussels                                                                                                                   15.8%

                                                                                                     Mr & Ms Van Overtveldt -
                                                                                                             Frahan
                                                                                                              3.1%

                                               Company presentation 30 June 2021                                                                  5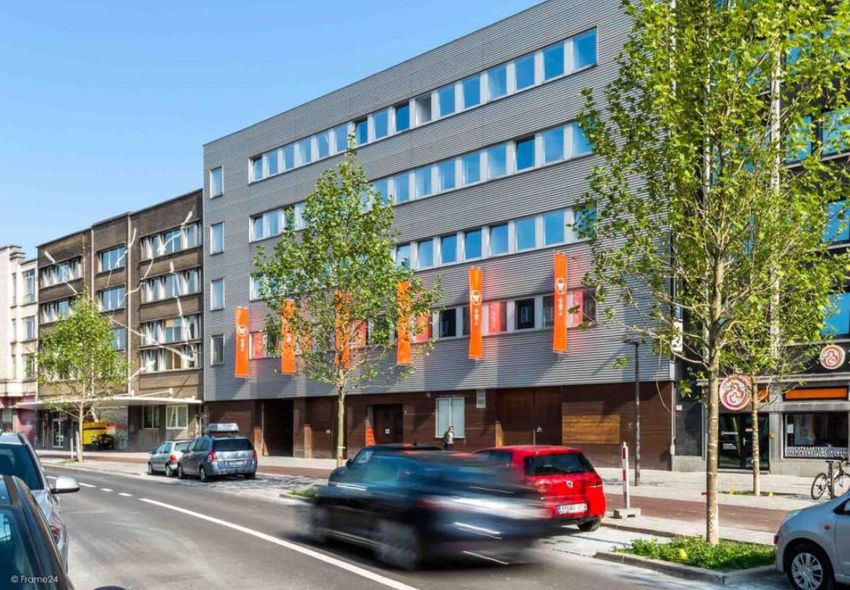
Home Invest Belgium at a glance
                             •       Biggest sector within the real estate market with a need for professionalization
                             •       Limited impact from business cycles on the letting market
Residential real estate
                             •       Limited impact from disruption
                             •       Responds to the primary human need for housing

                             •       In-house team of over 40 dedicated real estate professionals
Specialist
                             •       Top of mind with other market participants (sellers, buyers, brokers, innovators, …)

                             •       Assures a constant pipeline for growth
                             •       Higher yields obtained thanks to internalization of development margin
In-house development team
                             •       Apartment design and quality standards geared to the tenant market
                             •       Built from the long term perspective of an end investor

                             •       Well diversified funding sources from 7 financial institutions and good access to debt capital markets
Long term debt funding       •       Long term funding with a high proportion of fixed interest rates (92.5% fixed rates with a remaining
                                     average duration of 6.2 years)

                                 •   Strong track record of dividend growth
Strong shareholder returns       •   Strong track record of NAV growth
                                 •   Supported by stable reference shareholders

                                             Company presentation 30 June 2021                                                                6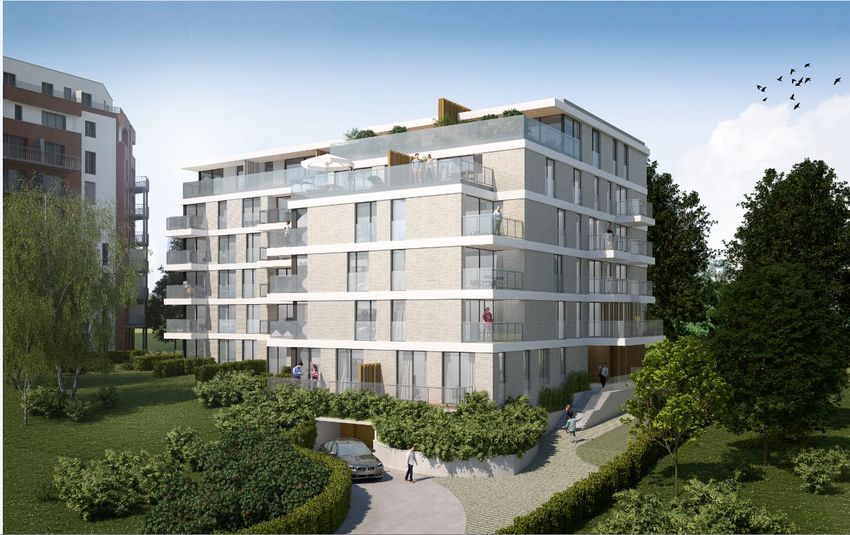
Real estate portfolio
      1H 2021

          Company presentation 30 June 2021
Strong growth track

                                     € 668 mio portfolio value

                    Evolution of the fair value of the real estate portfolio

                                                                                                                                                                              € 800m
                                                                                                                                                                              € 700m
                                                                                                                                                                              € 600m
                                                                                                                                                                              € 500m
                                                                                                                                                                              € 400m
                                                                                                                                                                              € 300m
                                                                                                                                                                              € 200m
                                                                                                                                                                              € 100m
                                                                                                                                                                              € 0m
             1999
                    2000
                           2001
                                  2002
                                         2003
                                                2004
                                                       2005
                                                              2006
                                                                     2007
                                                                            2008
                                                                                   2009
                                                                                          2010
                                                                                                 2011
                                                                                                        2012
                                                                                                               2013
                                                                                                                      2014
                                                                                                                             2015
                                                                                                                                    2016
                                                                                                                                           2017
                                                                                                                                                  2018
                                                                                                                                                         2019
                                                                                                                                                                2020
                                                                                                                                                                       2021
                                         Company presentation 30 June 2021                                                                                                             8
Specialist in residential real estate

     >90% of the porfolio is residential real estate

                            Retail

            7,1%            Offices
                   2,5%     Residential

                                            0,6%

                                                           Nursing
                          90,4%             81,7%          homes
                                                           Houses

                                                           Tourism
                                             8,1%

                                      Company presentation 30 June 2021   9
Located in Belgium (92%) & the Netherlands (8%)

           With a strong presence in the
                   Brussels Capital Region
                   (69% of the portfolio)

                          The
                       Nethelands
            Flemish       8,3%
            Region
             10,3%

         Walloon
         Region
          12,9%
                                                 Brussels
                                               Capital Region
                                                  68,5%

                                    Company presentation 30 June 2021   10
Strong presence in the Brussels Capital Region
• The biggest tenant market in Belgium
• High proportion of tenants vs. owner-occupied
• 60% tenants in Brussels
• Brussels, the Capital of Europe • compared to 30% outside Brussels
• 1.2 mio inhabitants
Brussels Belgium (outside Brussels)
• Strong population growth(1)
• 1.1% annual growth over the past decade …
40% 30%
• … compared to 0.5% outside Brussels
60%
70%
Tenants Owner-occupied Tenants Owner-occupied
(1) Statbel : Period 1-1-2010 to 1-1-2020
Company presentation 30 June 2021 11Supporting megatrends in housing
Demographic changes
Urbanisation - Decreasing household sizes -
% of Europeans living in cities(1)
90%
84%
85%
80%
74%
77% Demographic changes
75%
70%
70% - Ageing population -
65% The share of 65+ in Belgium’s population will increase
60%
from 25% in 2019 to 40% in 2070 (2)
55%
50%
45%
40%
1990 2018 2030e 2050e
(1) United Nations (2) European Commission : The 2021 Ageing Report
Company presentation 30 June 2021 12Apartment rents outpace inflation
1. Rental contracts are indexed to the Belgian health index.
- Income evolution of Belgian households is also floored by the health index (for both working class and social welfare).
- Wage growth outpaced inflation by 1.0% annually in the Brussels Capital Region between 2010-2018.(1)
2. The evolution of market rents for apartments outpaced inflation by 1.2% annually in the Brussels Capital Region between 2010-2018.(2)
(1) Stabel: Median gross wage growth in excess of the Belgian Health Index
(2) Slrb-bghm.brussels: Observatoire des loyers – Enquête 2018
Company presentation 30 June 2021 13Young and sustainable portfolio
More than 50% of the portfolio is younger than 10 years.
Age of the portfolio
Younger than 10 years > 50% of the portfolio
Younger than 20 years > 70% of the portfolio
Company presentation 30 June 2021 14Compared to an outdated housing stock on the market
Only 7% of the Brussels’ housing stock is younger than 30 years.
This means there is a huge need and potential for new housing.
Source: JLL
Company presentation 30 June 2021 15Key activities in
1H 2021
Company presentation 30 June 2021Acquisitions in 1H 2021
City Dox (Lot 4) - Anderlecht (Brussels)
• Agreement to acquire a land plot (lot 4) under the condition precedent of obtaining
a building permit
• Part of the City Dox site, a large-scale development by Atenor in Anderlecht
• The project consists of :
• 171 residential units
• 132 parking lots
• 324 indoor bicycle sheds
• 2,700 m² production facilities
• Total expected investment of ± € 50 mio
• Expected gross initial yield of ± 4.5%
• Completion expected in 2023
Company presentation 30 June 2021 17Acquisitions in 1H 2021
Key West - Anderlecht (Brussels)
• Agreement to acquire building A under the condition precedent of obtaining a
building permit
• Part of the Key West site, a large-scale development by Immobel and BPI Real Estate
in Anderlecht
• The project consists of :
• 101 residential units
• 840 m² of retail area
• 132 parking lots
• 183 indoor bicycle sheds
• Total expected investment of ± € 30 mio
• Expected gross initial yield of ± 4.5%
• Completion expected in 2025
Company presentation 30 June 2021 18Acquisitions in 1H 2021
Ankerrui – Antwerpen
• Agreement to acquire, subject to conditions precedent, 100% of the shares of The Ostrov NV
• The Ostrov NV owns a building with a surface area of 6,200 m² that currently serves as office
space
• The building will be leased as office space for a fixed term period of 6 years at annual rents of
€ 648k.
• The share price of The Ostrov NV is based on an investment value of the existing office
building of ± € 10 mio
• After expiration of the lease, Home Invest Belgium plans to convert the building to a mixed
project with :
• ± 30 residential units
• A retail space on the ground floor
Company presentation 30 June 2021 19Delivery of The Felicity
The Felicity – Laeken (Brussels)
• Reconversion project of an old factory of +/- 5,000m²
• A new residential project with :
• 37 apartments and 11 houses
• 51 parking spaces
• Delivered in June 2021
Company presentation 30 June 2021 20Progress of development projects
Samberstraat – Antwerp
The Fairview – Niefhout - Turnhout
St Lambrechts-Woluwe (Brussels)
• Former factory
• New construction of :
• Reconvertion into : • 92 apartments
• New construction of :
• 37 apartments • 47 parking lots & Bicycle sheds
• 42 apartments
• 1 office space • Common work and leisure areas
• 42 parkings
• 39 parkings & 36 bike spaces
• Delivery expected in Q1 2022 • Delivery expected in Q4 2022
• Delivery expected in Q3 2023
Company presentation 30 June 2021 21Progress of renovation projects
Galérie de l’Ange – Namur Résidence Quartier Européen - Brussels
• Full refurbishment of 3 older buildings in the European district in
• Full refurbishment of the residential part Brussels
• 57 apartments • Consisting of :
• 48 apartments
• Delivery expected in Q4 2022 • 2 retail units
• 50 parking lots
• Delivery expected in Q1 2022
Company presentation 30 June 2021 22Development pipeline
Pipeline (with building permit)
Name City # units Delivery date Total cost Remaining CAPEX still to be
(expected) (expected) spent
The Fairview St Lambrechts Woluwe 42 Q1 2022 € 12 mio € 5 mio
(Brussels)
Samberstraat Antwerp 38 Q3 2023 € 9 mio € 7 mio
Galérie de l’Ange Namur 57 Q3 2022 € 7 mio € 6 mio
Niefhout Turnhout 92 Q4 2022 € 15 mio € 13 mio
Résidence Quartier Européen Brussels 50 Q1 2022 € 3 mio € 3 mio
Total 279 € 46 mio € 34 mio
Pipeline (no building permit yet)
Name City # units
Jourdan 95 Saint-Gilles (Brussels) 57
City Dox (Lot 4) Anderlecht (Brussels) 171
Key West (Building A) Anderlecht (Brussels) 101
Total 329
Company presentation 30 June 2021 23Letting activities and occupancy rate
Strong letting activities Record high occupancy rate
Very strong letting activities in 1H 2021.
Average occupancy rate(1) up to a record in 1H 2021 :
New leases started Occupancy rate
1H 2021 251 1H 2021 96.9%
1H 2020 115 1H 2020 94.5%
1H 2019 165 1H 2019 95.1%
(1) The occupancy rate is calculated excluding (i) buildings being renovated (ii) buildings
being commercialized for the first time and (iii) buildings being sold.
Company presentation 30 June 2021 24Financial results
1H 2021
Company presentation 30 June 2021Key figures
Consolidated income statement (in € k) 1H 2021 1H 2020 Δ Y-o-Y % growth
Net rental result 13 219 13 132 87 +0.7%
Property result 11 439 11 284 154 +1.4%
(-) Property costs - 1 638 - 2 061
(-) General costs and other operating income -1 272 -1 563
Operating result before result on the portfolio (=EBIT) 8 528 7 661 867 +11.3%
Operating margin (% of Net rental result) 64.5% 58.3%
(+/-) Result on the disposal of investment properties 79 727
(+/-) Changes in the fair value of investment properties 14 825 -1 484
(+/-) Other portfolio result 893 -192
Operating result 24 325 6 712
(-) Financial result (excl. changes in fair value of financial assets and liabilities) -2 260 -2 035
(+/-) Changes in fair value of financial assets and liabilities 1 537 -3 615
(+/-) Share in the profit of associates and joint ventures 1 102 328
o/w share in EPRA earnings 766 735
o/w share in changes in fair value of investment properties and financial assets and liabilities 336 -406
(-) Taxes -93 -129
Net result (group share) 24 611 1 261
Company presentation 30 June 2021 26Key figures
EPRA earnings (in € k) 1H 2021 1H 2020 Δ Y-o-Y % growth
Net result (group share) 24 611 1 261
(-) Portfolio result -15 797 +949
(-) Changes in fair value of financial assets and liabilities -1 537 +3 615
(-) Non-EPRA elements of the share in the result of associates and joint ventures -336 +406
EPRA earnings (1) 6 942 6 232 710 +11.4%
Per share results (in €) 1H 2021 1H 2020 Δ Y-o-Y % growth
Weighted average number of shares (2) 3 288 410 3 288 146
Net result per share 7.48 0.38
EPRA earnings per share 2.11 1.90 0.22 +11.4%
Distributable result per share (3) 2.66 2.30 0.35 +15.3%
(1) EPRA earnings are defined as the net result excluding (i) the portfolio result, (ii) the changes in the fair value of financial assets and
liabilities, and (iii) the non-EPRA elements of the share in the result of associated companies and joint ventures. This term is used in
accordance with the Best Practices Recommendations of EPRA.
(2) The weighted average number of shares is calculated excluding own shares.
(3) The distributable result is defined as the sum of (i) the EPRA earnings and (ii) realised distributable capital gains on the sale of
investment properties.
Company presentation 30 June 2021 27Key figures
Consolidated balance sheet (in € k) 30/06/2021 31/12/2020 Δ 6 months % growth
Total assets 680 584 653 909 26 675 4.1%
Shareholders’ equity 332 696 310 173 22 522 7.3%
Debt ratio (RECC-Act) (1) 51.29% 52.40%
Debt ratio (IFRS) (2) 49.99% 50.97%
NAV per share (in €) 30/06/2021 31/12/2020 Δ 6 months % growth
Total number of shares outstanding (3) 3 288 410 3 288 146 264 +0.01%
Closing price of the share 118.50 115.50 3.00 +2.6%
IFRS NAV (4) 101.16 94.33 6.83 +7.2%
Premium/discount to IFRS NAV 17.1% 22.4%
EPRA NTA (5) 102.61 96.50 6.11 +6.3%
Premium/discount to EPRA NTA 15.5% 19.7%
(1) The debt ratio (RREC-Act) is calculated according to the RREC-Act . This means that for the sole purpose of calculating the debt ratio the share in associated
companies and joint ventures are accounted for proportional consolidation method.
(2) The debt ratio (IFRS) is calculated in the same way as the debt ratio (RREC-Act), but based on the IFRS consolidated balance sheet with the share in associated
companies and joint ventures accounted for using the equity method.
(3) The total number of shares outstanding is calculated excluding own shares.
(4) IFRS NAV per share = Net Asset Value per share according to IFRS.
(5) EPRA NTA per share = Net Asset Value per share according to EPRA Best Practices Recommendations.
Company presentation 30 June 2021 28Financial structure
Debt maturities Comments
€ 120 m
• Financial debt amounts to € 332.0 m
- Drawn credit lines : € 253.0 m
€ 100 m
- Bonds : € 49.0 m
€ 80 m
- Commercial Paper : € 30.0 m
45 52
€ 60 m
€ 40 m 10
• Weighted average remaining duration of the financial debt of 3.9 yrs
58 15
€ 20 m 40 40 25
30
20
33 25 • Credit lines are provided by 7 financial institutions
€0m 9
2021 2022 2023 2024 2025 2026 2027 2028
• € 70.0 m committed non-drawn credit lines available
Expiry date of bonds Expiry dates of commercial paper - Backup lines for outstanding CP : € 30.0 m
Expiry dates of drawn credit lines Expiry dates of available credit lines - Available credit lines : € 40.0 m
• Debt ratio of 51.3% (RREC-act) or 50.0% (IFRS) (strategic targetHOMI share by Company presentation 30 June 2021
Key figures per share

  Key figures per share               30/06/2021        31/12/2020          Δ 6 months                % growth

  Total number of shares issued (1)   3 299 858         3 299 858                                          -

  Closing price of the share            118.50            115.50             € +3.00                    +2.6%

  Market capitalization                € 391 mio         € 381 mio

  IFRS NAV                              € 101.16         € 94.33             € +6.83                    +7.2%

  Premium/discount to IFRS NAV           17.1%            22.4%

  EPRA NTA                             € 102.61          € 96.50              € +6.11                   +6.3%

  Premium/discount to EPRA NAV           15.5%             19.7%

                                                                                         (1)   Including own shares.

                                        Company presentation 30 June 2021                                              31
Evolution of the share price & gross dividend
€ 6,00
€ 135,00
€ 5,50
€ 120,00
€ 5,00
€ 105,00
€ 4,50
€ 90,00
€ 4,00
€ 75,00
€ 3,50
€ 60,00
€ 3,00
€ 45,00
€ 2,50
€ 30,00 € 2,00
€ 15,00 € 1,50
Gross dividend Share price HOMI
Company presentation 30 June 2021 32Stock price comparison
Total Return since 2008
600
527
500
400
332
311
300
200
100
-
okt 2008 okt 2009 okt 2010 okt 2011 okt 2012 okt 2013 okt 2014 okt 2015 okt 2016 okt 2017 okt 2018 okt 2019 okt 2020
HOMI EPRA Eurozone Index BEL20 Index
Company presentation 30 June 2021 33Outlook by Company presentation 30 June 2021
Outlook

Strong residential rental market and good operating figures in 1H 2021

• Accelerating residential letting market with strong demand for qualitative housing has resulted in a record occupancy rate of 96.9%.

• Increase in EPRA earnings by 11.4% to € 8.73 million in 1H 2021.

Supportive long-term trends for the residential rental market

• The residential rental market continues to grow steadily in those cities where Home Invest Belgium is active, mostly thanks to:
     •   a long-term urbanisation trend, marked by demographic growth in big cities, including both young and older people, leading to increased demand
         for housing;
     •   an increasing number of tenants in big cities, due to factors including an increasing need for flexibility and a change in attitudes to private property
         and concepts of urban sharing.

With its future proof portfolio, Home Invest Belgium is well positioned to take a leading role in the residential rental market

 • > 50% of the portfolio is younger than 10 years

                                                           Company presentation 30 June 2021                                                              35
Outlook
Dividend
• The general meeting of 4 May 2021 approved the dividend for the financial year 2020 of € 4.95 gross per share (or an increase
of 2.1% compared to 2019). This implies a continuous increase in dividends for the 21st year in a row.
• For the years to come, the Board of Directors anticipates a dividend policy based on an annual increase in dividends equal to or
higher than inflation. This is based on:
- the constant indexed rent flow from existing investment properties;
- the control of the operational costs of the company;
- the company's hedging policy, which provides good visibility on interest charges and makes them assessable in the medium term;
- The existing pipeline of project developments;
- The reserves that the company has built up over the years.
Company presentation 30 June 2021 36Company presentation 30 June 2021 37
You can also read