Q2 FY'19 Investor Presentation - February 2019 - AWS
←
→
Page content transcription
If your browser does not render page correctly, please read the page content below

Q2 FY’19
Investor Presentation
February 2019
Safe harbor
This presentation may contain “forward-looking” statements within the meaning of Section 27A of the Securities Act and Section 21E of the Exchange Act that are
based on our management’s beliefs and assumptions and on information currently available to management, including statements regarding Palo Alto Networks’
expectations regarding its expected effective tax rate, its expected weighted average non-GAAP effective tax rate, and the effects of such rates, as well as expectations
regarding its revenue and non-GAAP earnings per share, the related components of non-GAAP earnings per share, weighted average basic and diluted outstanding
share count expectations for its fiscal third quarter 2019, its competitive position and the demand and market opportunity for its products, subscription and support
offerings, the benefits to its customers of newly acquired offerings and capabilities and the effectiveness of these offerings to perform as intended, the expected efficacy
of its product, subscription and support offerings and timing of new subscription offerings, the expansion of its total addressable market, its ability to drive outsized
growth rates, the expected impact of the adoption of certain recent accounting pronouncements and the anticipated timing of adopting such standards, trends in certain
financial results, operating metrics, mix shift and seasonality, and continued momentum in its business.

There are a significant number of factors that could cause actual results to differ materially from statements made in this presentation, including: our limited operating
history; risks associated with managing our rapid growth; the risks associated with new products and subscription and support offerings, including the discovery of
software bugs; our ability to attract and retain new customers; delays in the development or release of new subscription offerings, including through deployment of new
capabilities via security applications developed by third parties; rapidly evolving technological developments in the market for network security products and subscription
and support offerings; our ability as an organization to acquire and integrate other companies, products or technologies in a successful manner; length of sales cycles;
and general market, political, economic and business conditions. Further information on these and other factors that could affect the forward-looking statements we
make in this presentation can be found in the documents that we file with or furnish to the U.S. Securities and Exchange Commission, including Palo Alto Networks’
most recent Quarterly Report on Form 10-Q filed for the fiscal quarter ended January 31, 2019, which is available on our website at investors.paloaltonetworks.com and
on the SEC's website at www.sec.gov. Additional information will also be set forth in other filings that we make with the SEC from time to time. All forward-looking
statements in this presentation are based our current beliefs and on information available to us as of the date hereof, and we do not assume any obligation to update
the forward-looking statements provided to reflect events that occur or circumstances that exist after the date on which they were made or to update the reasons why
actual results could differ materially from those anticipated in the forward-looking statements, even if new information becomes available in the future.

All information in this presentation is as of February 26, 2019. This presentation contains non-GAAP financial measures and key metrics relating to the company's past
and expected future performance. We have not reconciled diluted non-GAAP net income per share guidance to GAAP net income (loss) per diluted share because we
do not provide guidance on GAAP net income (loss) and would not be able to present the various reconciling cash and non-cash items between GAAP net income
(loss) and non-GAAP net income, including share-based compensation expense, without unreasonable effort. You can also find information regarding our use of non-
GAAP financial measures in our earnings release dated February 26, 2019.

2 | © 2018, Palo Alto Networks. All Rights Reserved.
3 | © 2018, Palo Alto Networks. All Rights Reserved.
Continuous evolution

                                   SaaS                                      Cloud & Virtualization

                                                               z

                                                       MASSIVE OPPORTUNITY
                                                       FOR CYBERCRIMINALS

                     Mobility & BYOD                                          Internet of Things

4 | © 2018, Palo Alto Networks. All Rights Reserved.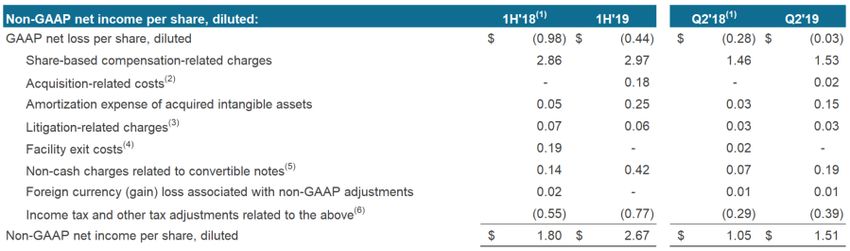
The challenge

                                                                                          SPEED
                                                                   z                Keep pace with
                                                                                    business needs
                            RISK
                            Disjointed tools
                            limit insights

                                                       BALANCING DISJOINTED TOOLS
                                                          AND MANUAL EFFORTS

5 | © 2018, Palo Alto Networks. All Rights Reserved.
Security in the digital age
z
ANALYTICS AI IoT AUTOMATION
DATA DRIVEN AUTOMATED CLOUD DELIVERED
6 | © 2018, Palo Alto Networks. All Rights Reserved.The Palo Alto Networks Security Operating Platform
PREVENT FOCUS ON CONSUME
SUCCESSFUL WHAT MATTERS INNOVATIONS
CYBERATTACKS QUICKLY
Operate with ease using Automate tasks using From our technologies
best practices context and analytics and 3rd parties.
BUILT FOR AUTOMATION
7 | © 2018 Palo Alto Networks. All Rights Reserved.Large and expanding addressable market
Application
Framework
+$5Bn
$24.0Bn
Endpoint Security
$5.2Bn
$19.1Bn
Endpoint Security Web Security $2.7Bn
$4.4Bn
Web Security $2.3Bn
Network Security
(Firewall, IPS, VPN)
Network Security $16.1Bn
(Firewall, IPS, VPN)
$12.4Bn
2017 2020
Sources: IDC, Worldwide Network Security 2016–2020 Forecast, September 2016.
IDC, Worldwide Web Security 2016–2020 Forecast, December 2016.
IDC, Worldwide Enterprise Endpoint Security 2016–2020 Forecast, October 2016.
8 | © 2018, Palo Alto Networks. All Rights Reserved.The power of the hybrid-SaaS model
Product Recurring subscription and support revenue
Attached Non-attached
Hardware Perpetual Support
subscriptions subscriptions
Traps
VM-Series
Threat Prevention
AutoFocus
URL Filtering
Aperture Support
GlobalProtect
Logging Service Professional services
WildFire
Appliances Panorama GlobalProtect cloud service
DNS Security Service
Accessories VM-Series Magnifier
Evident & RedLock
Renewals
9 | © 2018, Palo Alto Networks. All Rights Reserved.Continued strength of customer acquisition
Q2’19
Customer Acquisition >59,000
60,000
Q2’18
~48,000
50,000
Q2’17
>37,500
40,000
Q2’16
>30,000
30,000 Q2’15
>22,000
Q2’14
>15,000
20,000
Q2’13
>10,000
Q2’12
Q2’11 >6,000
10,000
>2,500
-
Note: Fiscal year ends July 31.
10 | © 2018, Palo Alto Networks. All Rights Reserved.Top-25 customer buying behavior
Q1'08
Q2'08
Q3'08
Q4'08
Q1'09
Q2'09
Q3'09
Q4'09
Q1'10
Q2'10
Q3'10
Q4'10
Q1'11
Q2'11
Q3'11
Q4'11
Q1'12
Q2'12
Q3'12
Q4'12
Q1'13
Q2'13
Q3'13
Q4'13
Q1'14
Q2'14
Q3'14
Q4'14
Q1'15
Q2'15
Q3'15
Q4'15
Q1'16
Q2'16
Q3'16
Q4'16
Q1'17
Q2'17
Q3'17
Q4'17
Q1'18
Q2'18
Q3'18
Q4'18
Q1'19
Q2'19
Industry
Federal Government
Federal Government
Media & Entertainment
Telecommunications
High Technology
Financial Services
Aerospace & Defense
High Technology
High Technology
Media & Entertainment
State & Local Government
Professional & Legal Services
Federal Government
Financial Services
High Technology
State & Local Government
Insurance 173x lifetime value
Healthcare (was 127x in Q2’18)
High Technology
Financial Services
Insurance $35.6Mn ticket
Media & Entertainment (was $25.6Mn in Q2’18)
Insurance
Financial Services
Transportation & Logistics
The green cell indicates the quarter of initial purchase. The blue cell indicates each quarter a customer transacted with Palo Alto Networks.
11 | © 2019 Palo Alto Networks. All Rights Reserved.Q2’19 Financial highlights
Q2 FY’19 Y/Y Change 1H FY’19 Y/Y Change
Billings(1) $852.5Mn 26.6% $1.6Bn 27.0%
Revenue $711.2Mn 30.4% $1.4Bn 30.5%
Gross margin %(2) 76.3% 30 bps 76.5% 20 bps
Operating margin %(2) 24.6% 250 bps 22.8% 210 bps
EPS(2) $1.51 $0.46 $2.67 $0.87
Deferred revenue $2.5Bn 32.0% $2.5Bn 32.0%
Free cash flow margin %(2) 35.4% (470) bps 34.4% (960) bps
Adj. Free cash flow margin %(2) 38.2% (300) bps 40.0% (220) bps
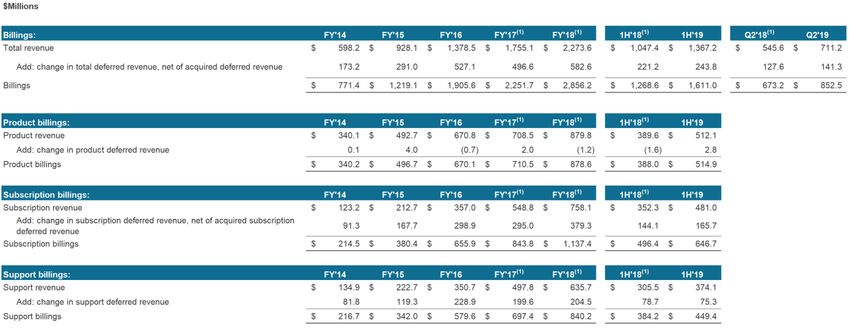
(1) Billings is a key financial metric defined as total revenue plus the change in total deferred revenue, net of acquired deferred revenue, during the period. See appendix for calculation.
(2) Non-GAAP financial measure. See appendix for reconciliation to most comparable GAAP financial measure.
All periods reflect adoption of ASC 606.
Note: Fiscal year ends July 31.
12 | © 2018, Palo Alto Networks. All Rights Reserved.Billings by type
$Millions
FY’14-FY’18 CAGR
Product 27%
Subscription 52% $2,856
Support 40%
$840
$2,252
$1,906
$697
$580
$1,611
$1,137
$1,219 $1,269 $449
$844 $384
$342 $656
$771 $647
$217 $380 $496
$214 $879
$670 $710
$497 $515
$340 $388
FY'14 FY'15 FY'16 FY'17 FY'18 1H'18 1H'19
Product Subscription Support
Billings is a key financial metric defined as total revenue plus the change in total deferred revenue, net of acquired deferred revenue, during the period.
See appendix for calculation.
FY’17-FY’19 reflect adoption of ASC 606.
Note: Fiscal year ends July 31.
13 | © 2018, Palo Alto Networks. All Rights Reserved.Deferred revenue
$Millions $2,526
% of total
$2,279
$1,914
$1,156 46%
$1,692
$1,066 47%
$1,411
$876 46%
$773 46%
$635 45%
$1,369 54%
$1,214 53%
$1,037 54%
$920 54%
$776 55%
Q2'17 Q4'17 Q2'18 Q4'18 Q2'19
Short-term deferred revenue Long-term deferred revenue Total
All periods reflect adoption of ASC 606.
Note: Fiscal year ends July 31.
14 | © 2018, Palo Alto Networks. All Rights Reserved.Revenue by type
$Millions
FY’14-FY’18 CAGR
Product 27% $2,274
Subscription 58%
Support 47%
$636
$1,755
$1,378 $498
$1,367
$758
$350 $374
$1,047
$928 $549
$305
$222 $357
$481
$598
$213 $352
$135
$123 $880
$671 $708
$493 $512
$340 $390
FY'14 FY'15 FY'16 FY'17 FY'18 1H'18 1H'19
Product Subscription Support
FY’17-FY’19 reflect adoption of ASC 606.
Note: Fiscal year ends July 31.
15 | © 2018, Palo Alto Networks. All Rights Reserved.Leverage at scale
$Millions
FY’14 Adj. FCF margin(1): 21.9%
FY’18 Adj. FCF margin(1): 40.5%
FY’14 Op margin(1): 11.6% $926 $921
FY’18 Op margin(1): 21.9% $499
$797
$705
$369 $587 $588
$547
$311
$271 $470
$316 $316
$153
$70 $131
$56
FY'14 FY'15 FY'16 FY'17 FY'18 6M19 FY'14 FY'15 FY'16 FY'17 FY'18 6M19
(1) (1) (1)
Operating income Free cash flow Adjusted free cash flow
(1) Non-GAAP financial measure. See appendix for reconciliation to most comparable GAAP financial measure.
FY’17-FY’19 reflect adoption of ASC 606.
Note: Fiscal year ends July 31.
16 | © 2018, Palo Alto Networks. All Rights Reserved.Appendix
Calculation of billings
(1) In Q1'19, we adopted new accounting guidance related to revenue recognition (ASC 606). As a result, amounts for FY'17 and FY'18 have
been adjusted.
Note: Fiscal year ends July 31.
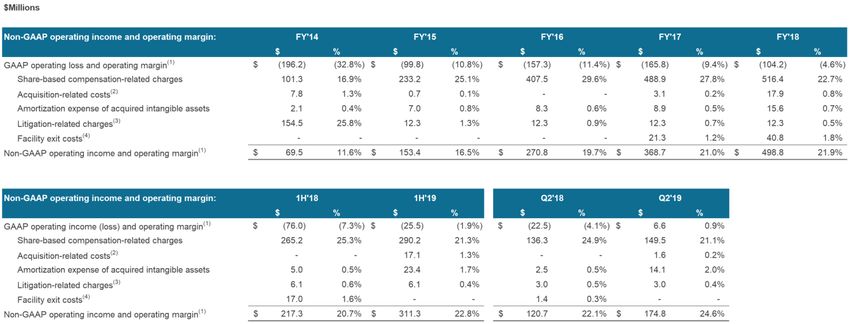
18 | © 2018, Palo Alto Networks. All Rights Reserved.GAAP to non-GAAP reconciliations (1) In Q1'19, we adopted new accounting guidance related to revenue recognition (ASC 606). As a result, amounts for FY'18 have been adjusted. (2) Consists of the amortization of intellectual property licenses. Note: Fiscal year ends July 31. 19 | © 2018, Palo Alto Networks. All Rights Reserved.
GAAP to non-GAAP reconciliations (cont’d)

(1) In Q1'19, we adopted new accounting guidance related to revenue recognition (ASC 606). As a result, amounts for FY'17 and FY'18 have been adjusted.
(2) Consists of acquisition transaction costs, share-based compensation-related to the accelerated vesting of certain equity awards, and costs to terminate certain employment, operating lease, and other contracts of the acquired companies.
(3) Includes expenses for legal services and settlements, including the legal settlement with Fortinet, Inc. of $20.0M in Q2'14, the legal settlement with Juniper Networks, Inc. ("Juniper") of $121.2M in Q3'14, the mark-to-market for the
    warrants issued as part of the settlement with Juniper of $5.9M in Q4'14, and the amortization of intellectual property licenses entered into as part of the settlement with Juniper of $2.0M in Q4'14 and approximately $3.1M each quarter
    thereafter.
(4) For FY'17, consists of charges related to the relocation of our corporate headquarters (impairment loss of $20.9 million and accelerated depreciation). For FY'18, consists of charges related to the relocation of our corporate headquarters
    (cease-use loss of $15.4 million and accelerated depreciation in Q1'18 and additional cease-use loss of $23.8 million in Q3'18) and charges related to the relocation of our research and development center in Israel (cease-use loss of $1.3
    million and accelerated depreciation in Q2'18).
Note: Fiscal year ends July 31.

20 | © 2018, Palo Alto Networks. All Rights Reserved.
GAAP to non-GAAP reconciliations (cont’d)
(1) In Q1'19, we adopted new accounting guidance related to revenue recognition (ASC 606). As a result, certain amounts for FY'18 have been adjusted.
(2) Consists of acquisition transaction costs, share-based compensation-related to the cash settlement of certain equity awards, and costs to terminate certain employment and
operating lease contracts of the acquired company.
(3) Consists of the amortization of intellectual property licenses.
(4) Consists charges related to the relocation of our corporate headquarters (cease-use loss of $15.4 million and accelerated depreciation in Q1'18) and charges related to the
relocation of our research and development center in Israel (cease-use loss of $1.3 million and accelerated depreciation in Q2'18).
(5) For FY'18, consists of non‐cash interest expense related to our convertible senior notes. For Q2’19 and 1H’19, also includes non‐cash losses of $0.4 million and $2.6 million,
respectively, related to early conversions of the convertible notes during those periods.
(6) Effective Q2’18, our non-GAAP effective tax rate changed from 31% to 22% due to the reduction of the U.S. federal corporate income tax rate under the U.S. Tax Cuts and Jobs
Act, which was enacted into law on December 22, 2017.
Note: Fiscal year ends July 31.
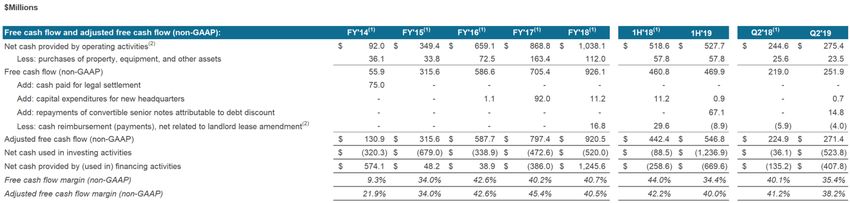
21 | © 2018, Palo Alto Networks. All Rights Reserved.GAAP to non-GAAP reconciliations (cont’d)
(1) In Q1'19, we adopted new accounting guidance related to revenue recognition (ASC 606) and new accounting guidance related to the presentation of restricted cash in the
statement of cash flows. As a result, certain amounts for periods prior to FY'19 have been adjusted.
(2) Cash provided by operating activities during FY'18 includes the receipt of an upfront cash reimbursement of $38.2 million from our landlords in Q1'18 in connection with the
exercise of their option to amend the lease payment schedules and eliminate the rent holiday periods under certain of our lease agreements. The upfront cash reimbursement has
been and will be applied against increased rental payments totaling $38.2 million due in FY'18 through FY'20 under the amended lease agreements. Adjusted free cash flow for
1H'18 and FY'18 reflects an adjustment for the $38.2 million received from our landlords, less related rental payments made during those periods of $8.6 million and $21.4 million,
respectively.
Note: Fiscal year ends July 31.
22 | © 2018, Palo Alto Networks. All Rights Reserved.You can also read