Infoblox Integration with Elastic Stack - DEPLOYMENT GUIDE
←
→
Page content transcription
If your browser does not render page correctly, please read the page content below
DEPLOYMENT GUIDE

Infoblox Integration with Elastic
Stack
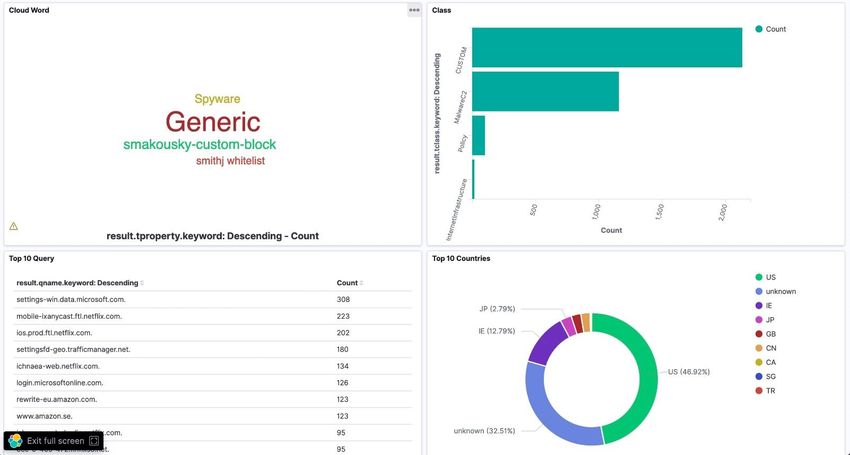
Table of Contents

Introduction                                                                          2
Requirements                                                                          2
Tested Hardware & Software                                                            2
Installation                                                                          2
Deployment Instructions                                                               2
  CSP API Key Retrieval                                                               2
  Python Configuration                                                                4
  Logstash Configuration                                                              6
  Kibana Data Discovery                                                               8
  Kibana Data Visualization                                                          12

©2020 Infoblox Inc. All rights reserved   Infoblox Integration with Elastic Stack – Oct 2020

                                                                                          1 of 20
Introduction
Elastic Stack, formerly known as the ELK Stack, is a popular suite of tools that provides advanced logging,
storing, searching and visualization functionality to data of many types from any source. Elasticsearch,
Logstash, and Kibana work together to make up the core products of Elastic Stack. Elasticsearch handles
search and storage of data, Logstash is the pipeline for retrieving data to send to Elasticsearch, and Kibana is
a web browser user interface to organize and display this data. Elastic Stack is available as a free, open source
local download, but it also provides a paid-for cloud solution. We will be working with the open source version.

Drastically enhance the ability to analyze your network by integrating Elastic Stack’s powerful data exploration
tools with Infoblox’s BloxOne Threat Defense extensive DNS security data.

Requirements
The following items are required to incorporate Infoblox BloxOne Threat Defense DNS security data into Elastic
Stack:

     ●     Access to an Infoblox BloxOne Threat Defense subscription
     ●     Access to an Elastic Stack instance
           o Composed of Elasticsearch, Logstash and Kibana

Tested Hardware & Software
     ●     Ubuntu 18.04 VM
           o Elastic Stack version 7.9.2 installed
                ▪     Elastic Stack composed of Elasticsearch, Logstash and Kibana
           o Python3 installed

Installation
There are several ways to install Elastic Stack. You may prefer different package formats or operating systems
depending on your needs and preferences. Find more information and further links for installing each Elastic
Stack component at https://www.elastic.co/guide/en/elastic-stack/current/installing-elastic-stack.html.
A comprehensive one-all guide for installing and configuring Elastic Stack and its dependencies on Ubuntu
18.04/20.04 can be found at https://phoenixnap.com/kb/how-to-install-elk-stack-on-ubuntu.

Deployment Instructions
CSP API Key Retrieval
You will need a BloxOne Threat Defense API key to pull the DNS data. You can access this key through the
Cloud Services Portal (CSP). API keys are unique identifiers found in many applications to both identify the
application making the API calls and verify the application making the calls has access to do so.

©2020 Infoblox Inc. All rights reserved                                     Infoblox Integration with Elastic Stack – Oct 2020

                                                                                                                            2 of 20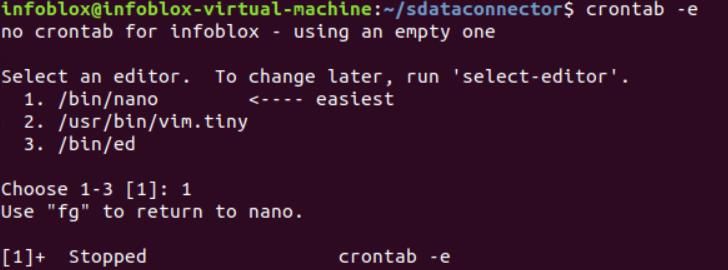
To access your API key:

     1. Log into the CSP at https://csp.infoblox.com.

     2. Upon logging in, hover over your username in the bottom -left corner of the CSP and select User
        Preferences.

     3. A popup will appear. Click Copy to copy your API key to your clipboard. Copy it somewhere you can
        easily access and copy from later, such as Notepad. This will be the key you copy into the Python
        script later.

©2020 Infoblox Inc. All rights reserved                                   Infoblox Integration with Elastic Stack – Oct 2020

                                                                                                                          3 of 20
Python Configuration
We will be using a Python script to gather the most recent ten minutes of DNS event data from Infoblox’s
BloxOne Threat Defense REST API and write it into json log files. To ensure the data is always recent and
updated, we will tell Ubuntu to run this script every ten minutes. Later we will configure Logstash to read the
json and send it to Kibana to be visualized.

Let’s create the Python script. You can save this script anywhere easily accessible to you, such as Documents
or the Desktop. Note: For this demo we will be saving it in /home//dataconnector.

     1. Access the machine where your Logstash instance is installed. Note: For this demo Elastic Stack was
        installed on Ubuntu 18.04.
     2. Open a terminal.
     3. Python3 must be installed for the script to work properly. If it is not already installed, install it with:

       sudo apt install python3.8

     4. Navigate to /home//dataconnector:

       cd /home/infoblox/dataconnector

     5. Create a new Python file:

       touch cspscript.py

     6. Open the file with gedit for editing:

       gedit cspscript.py

     7. Copy and paste the following into the file. Careful to note Python’s spacing and tabbing syntax.
        Indent nested Python newlines with four spaces. Replace the text  with
        the BloxOne TD API key acquired in the CSP API Key Retrieval section of this document. Save and
        close the file when finished.

©2020 Infoblox Inc. All rights reserved                                       Infoblox Integration with Elastic Stack – Oct 2020

                                                                                                                              4 of 20
# -*- coding: utf-8 -*-

  import   os
  import   datetime
  import   calendar
  import   requests
  import   json

  now = datetime.datetime.utcnow()
  ten_minutes_ago = datetime.datetime.utcnow() - datetime.timedelta(minutes = 10)
  filename = f"{ten_minutes_ago.strftime('%Y%m%d_%H%M%S')}_{now.strftime('%H%M%S')}"

  sif_now = calendar.timegm(now.timetuple())
  sif_last_hour = calendar.timegm(ten_minutes_ago.timetuple())

  url = f"https://csp.infoblox.com/api/dnsdata/v1/dns_event?t0={sif_last_hour}&_format=json&t1={sif_now}&source=rpz"

  payload = {}
  headers = {
    'Authorization': 'Token '
  }
  response = requests.request("GET", url, headers=headers, data = payload)

  path = "/tmp/rpz"

                               ←Watch the spacing here!
  if not os.path.exists(path):
      os.makedirs(path)

  completeName = os.path.join(path, filename+".json")
  data = json.loads(response.content)
  write_data = json.dumps(data)

  fh = open(completeName, 'w')
  fh.write(write_data)
  fh.close()

     4. Let’s make sure the script is working. Run:

       /usr/bin/python3 /home//dataconnector/cspscript.py &

           You should see an output like this:

The software utility cron is a time-based job scheduler in Unix-like operating systems. Let’s configure cron to
run the Python script every ten minutes.

     1. Open a terminal.
     2. Open a crontab file for editing:

       crontab -e

©2020 Infoblox Inc. All rights reserved                                      Infoblox Integration with Elastic Stack – Oct 2020

                                                                                                                             5 of 20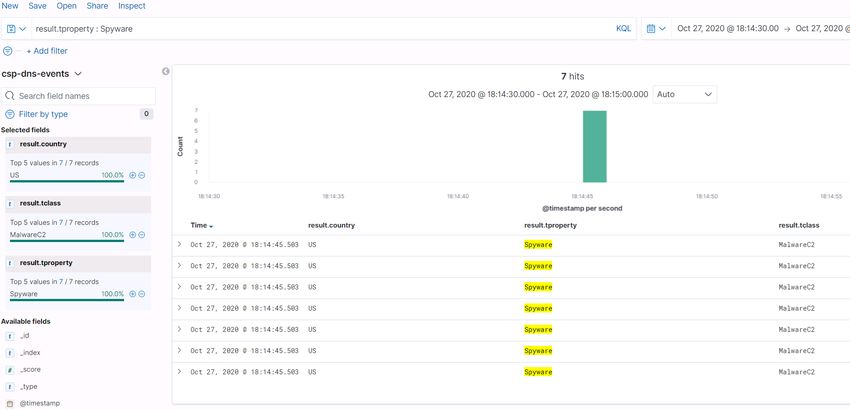
3. Choose your preferred editor if prompted.

     4. Insert the following line into the file as shown below. Save and exit the editor.

       */10 * * * * /usr/bin/python3 /home//dataconnector/cspscript.py &

Logstash Configuration
Logstash is a highly customizable part of Elastic Stack that retrieves data. It can be configured to collect data
from many different sources, such as log files, REST API requests, and more, to be sent to Elasticsearch and
later visualized in Kibana. Hundreds of plugins are available to expand its functionality, and many are included
with the software at installation. We will be using the input plugin file to read the json logs generated by the
Python script. A complete list of available plugins and links to their documentation can be found at
https://www.elastic.co/support/matrix#matrix_logstash_plugins.

Logstash configuration is governed by special configuration files. Where to retrieve data, how to filter it, and
where to output it are configured by these files. For this demo, Elastic Stack was installed on Ubuntu 18.04 via
apt-get, so these files are set by default to live in the /etc/logstash/conf.d directory. Your directories
may be different depending on how Elastic Stack was installed. More information about the Logstash directory
layout can be found at https://www.elastic.co/guide/en/logstash/current/dir-layout.html.

©2020 Infoblox Inc. All rights reserved                                       Infoblox Integration with Elastic Stack – Oct 2020

                                                                                                                              6 of 20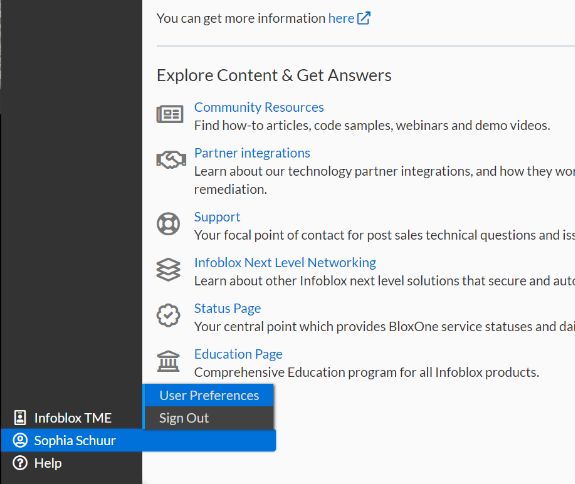
Let’s configure Logstash to grab the DNS security data found in the json files generated by the Python script.

     1. Access the machine where your Logstash instance is installed. Note: For this demo Elastic Stack was
        installed on Ubuntu 18.04.
     2. Open a terminal.
     3. Navigate to where your Logstash configuration (.conf) files are located. In this demonstrative
        environment, these files are located in /etc/logstash/conf.d. Input the following command to
        navigate to the correct directory:

             cd /etc/logstash/conf.d

     4. Create a new file called csp-dns-events.conf:

             sudo touch csp-dns-events.conf

     5. Open the file with gedit for editing:

             sudo gedit csp-dns-events.conf

     6. Copy and paste the following into the file. Save and close the file when finished.

             input {
               file {
                 path => "/tmp/rpz/*"
                 codec => "json"
                 mode => "read"
                 sincedb_path => "/dev/null"
               }
             }

             filter {
               split {
                 field => ["result"]
                 terminator => ","
               }
               mutate {
                 remove_field => ["status_code"]
               }
             }

             output {
               elasticsearch {
                 hosts => ["localhost:9200"]
                 index => "csp-dns-events"
               }
             }

©2020 Infoblox Inc. All rights reserved                                     Infoblox Integration with Elastic Stack – Oct 2020

                                                                                                                            7 of 20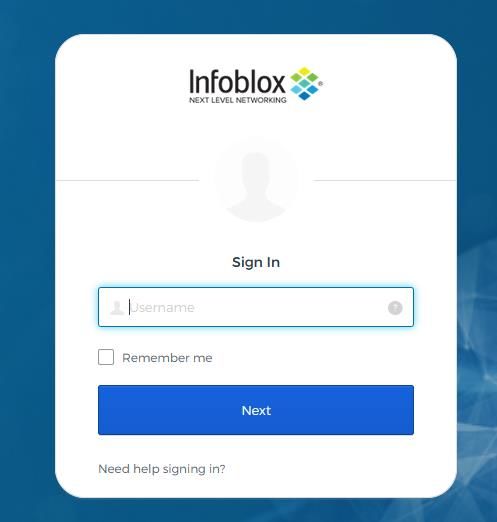
Let’s get a breakdown of what is happening in this code.
                a. Input: Here is where we read the json files created by the Python script. We use the input
                    plugin file.
                b. Filter: This is where we split every record found in the json files into individual hits in
                    Kibana. By doing so, we can directly search and organize by any field returned by the GET
                    request in the Python script. The returned body of the request is placed in one field called
                    result with each record terminated by a comma, so we tell that to Logstash. Using the
                    mutate plugin we remove the extra status_code field, since it creates unnecessary clunky
                    data.
                c. Output: Send the data to Elasticsearch and give this index a name. Thi s is the name that will
                    appear in Kibana when creating a new index.

           Logstash config files follow a specific schema. More information on the structure of config files can be
           found at https://www.elastic.co/guide/en/logstash/current/configuration-file-structure.html

     7. Navigate to your home directory for Logstash. For this demo, this is /usr/share/logstash/. Input
        the following command to navigate to the correct directory:

             cd /usr/share/logstash

     8. Run Logstash with your new configuration:

             sudo bin/logstash -f /etc/logstash/conf.d/csp-dns-events.conf

        Allow several minutes of processing. The console will inform you if there are any syntax errors with
        your config file.
     9. Alternatively, you can simply restart the logstash service, but the console will not warn you of any
        errors with your config file:

             sudo systemctl restart logstash

Kibana Data Discovery
Kibana is the visualization part of the Elastic Stack. It provides a web-based user interface for viewing and
charting the data stored in Elasticsearch. Using Index Patterns, we can map Kibana with the data that our
Logstash configuration is outputting to Elasticsearch.

     1. Access your Kibana instance. Note: If desired, you must configure Kibana to allow remote access,
        such as from a secondary Windows machine. Find instructions here.
     2. From the home page, click Connect to your Elasticsearch index.

©2020 Infoblox Inc. All rights reserved                                        Infoblox Integration with Elastic Stack – Oct 2020

                                                                                                                               8 of 20
3. Your configuration will appear here as an available index pattern. Click Create index pattern.
4. Name the index pattern csp-dns-events. Then click Next step.
©2020 Infoblox Inc. All rights reserved Infoblox Integration with Elastic Stack – Oct 2020
9 of 205. In the Time field, select @timestamp. Then click Create index pattern.
6. Click the menu icon in the topbar. Select Discover.
©2020 Infoblox Inc. All rights reserved Infoblox Integration with Elastic Stack – Oct 2020
10 of 207. Here you will see all the DNS security records retrieved from the CSP.
8. You can perform extensive searching, displaying and filtering here. Add some Available fields in the
left panel to view field totals for this dataset and organize your hits.
©2020 Infoblox Inc. All rights reserved Infoblox Integration with Elastic Stack – Oct 2020
11 of 209. Use the top search bar to return hits with specified field values. Try searching for “result.tproperty :
Spyware”. You can save searches, open searches, apply filters and more.
Kibana Data Visualization
Kibana offers many ways of charting data. Let’s build a pie chart based on the field tclass.
1. Click the menu icon in the topbar. Select Dashboard.
©2020 Infoblox Inc. All rights reserved Infoblox Integration with Elastic Stack – Oct 2020
12 of 202. Click Create new dashboard. We’ll add the chart to this dashboard. Many objects, such as charts,
can live on a dashboard for convenient access and visualization.
3. Click Create new.
4. Select Pie.
©2020 Infoblox Inc. All rights reserved Infoblox Integration with Elastic Stack – Oct 2020
13 of 205. Select your index csp-dns-events.
6. You will see an empty pie chart. Let’s build it up.
a. (Optional) If desired, narrow your dataset by clicking on the calendar dropdown.
b. Under Buckets, click Add → Split slices.
©2020 Infoblox Inc. All rights reserved Infoblox Integration with Elastic Stack – Oct 2020
14 of 20c. Define the Bucket.
i. Aggregation: select Terms.
ii. Field: select result.tclass.keyword.
iii. Size: set to 50.
iv. Click Update when finished.
©2020 Infoblox Inc. All rights reserved Infoblox Integration with Elastic Stack – Oct 2020
15 of 20d. Your chart should look something like below. Save your chart.
e. Give it a Title. Click Save and return.
©2020 Infoblox Inc. All rights reserved Infoblox Integration with Elastic Stack – Oct 2020
16 of 20f. Your chart now appears on your dashboard. Click the gears options icon, then click
Inspect to see a breakdown of data for the chart.
7. Save your dashboard.
8. Give the dashboard a Title. Click Save.
©2020 Infoblox Inc. All rights reserved Infoblox Integration with Elastic Stack – Oct 2020
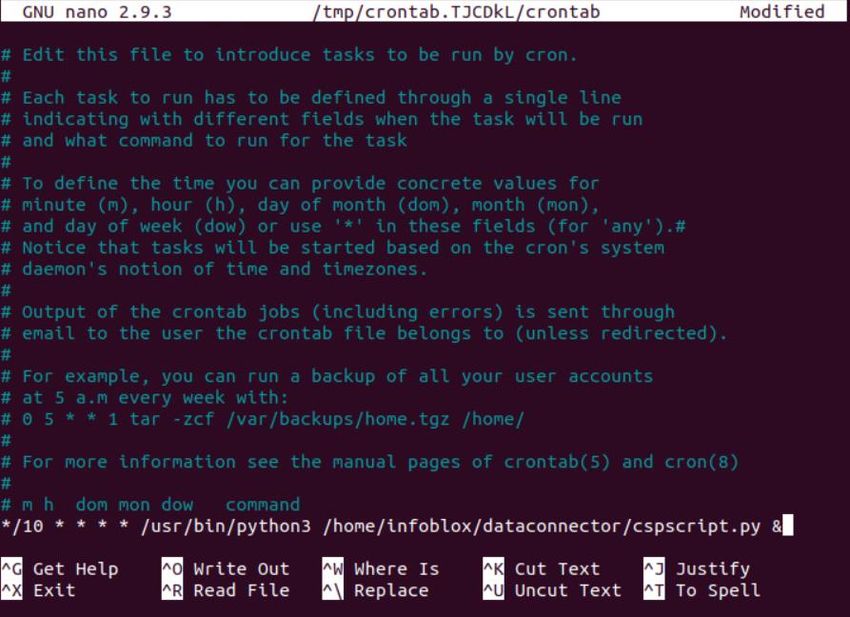
17 of 20You can add many different objects to dashboards, connect them, move them around, filter fields, and
much more. Here are some examples showcasing more of Kibana’s visualization capabilities:
©2020 Infoblox Inc. All rights reserved Infoblox Integration with Elastic Stack – Oct 2020
18 of 20Infoblox enables next level network experiences with its Secure Cloud-Managed Network Services. As the pioneer in providing the
world’s most reliable, secure and automated networks, we are relentless in our pursuit of network simplicity. A recognized industry
leader, Infoblox has 50 percent market share comprised of 8,000 customers, including 350 of the Fortune 500.
Corporate Headquarters | 3111 Coronado Dr. | Santa Clara, CA | 95054
+1.408.986.4000 | 1.866.463.6256 (toll-free, U.S. and Canada) | info@infoblox.com | www.infoblox.com
19
© 2020 Infoblox, Inc. All rights reserved. Infoblox logo, and other marks appearing herein are property of Infoblox, Inc. All other marks
are the property of their respective owner(s).You can also read