6 Month Road Safety Review - January to 15 July 2021 Velma Burns, Research Manager - RSA
←
→
Page content transcription
If your browser does not render page correctly, please read the page content below
6 Month Road Safety Review
January to 15 July 2021

Velma Burns,
Research Manager
                             *Data is current as of 11:59pm on 15
                             July 2021
                             Note: All data for 2018 to 2021 are
                             provisional and subject to change
Long-term trend in fatalities
    2013 - 2020
                                          80                                                                                                           250

                                          70                                                                                5% increase in fatalities in 2020
                                                      192
      Fatalities per million population

                                               188
                                          60
                                                                                  182                                       2020 Target not reached 200
                                                             162
                                                                                                     155
                                          50                                                                                                   147
                                                                                                                      137          140                 150

                                                                                                                                                             Fatalities
                                               41     41
                                                                                   38
                                          40                  35
                                                                                                      32
                                                                                                                                               30
                                                                                                                       28          28                  100
                                          30

                                          20
                                                                                                            2018 safest year on record                 50
                                          10

                                           0                                                                                                           0
                                               2013   2014   2015                2016                2017            2018         2019        2020
                                                                        Fatalities per million population     Fatalities

Note: All data for 2018 to 2021 are provisional and subject to change
Road deaths per million
     inhabitants 2020

    ▪ 42 road deaths per million inhabitants in
      the EU in 2020
    ▪ With 30 deaths per million, Ireland had the
      fifth lowest number of fatalities per million
      population among the EU27 in 2020

https://infogram.com/15-pin-annual-report-road-safety-progress-2020-1h7g6k0jwk87o2o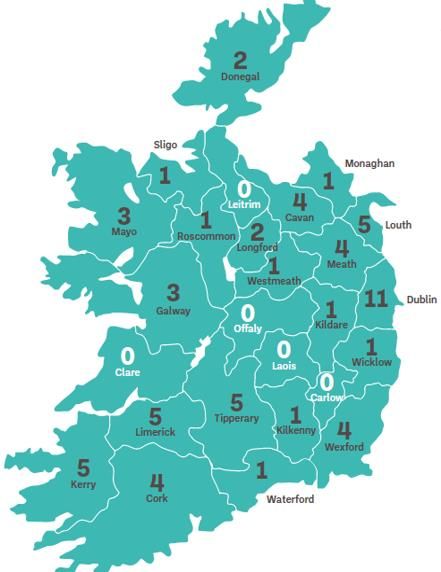
Relative change in road deaths
     in EU 2019 - 2020
     17% decrease in the number of road deaths in the EU 27

https://infogram.com/15-pin-annual-report-road-safety-progress-2020-1h7g6k0jwk87o2o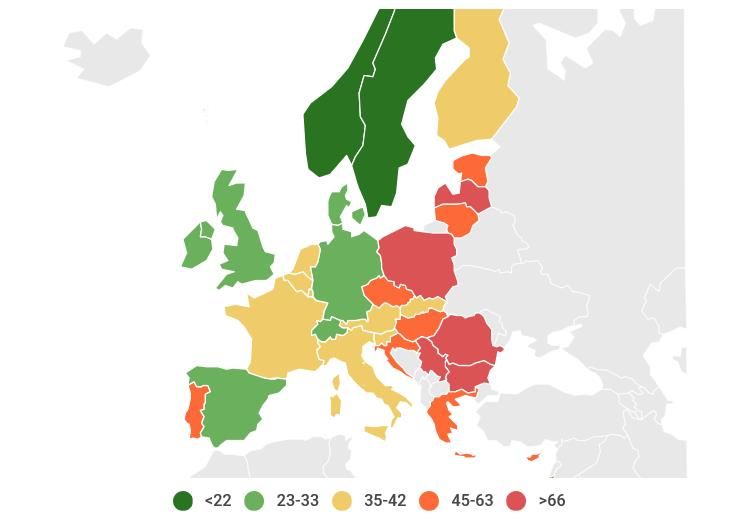
Overview 2021 fatalities
   January to 15 July 2021

   ▪ As of 15 July 2021, there have been 60 fatal collisions, which have resulted in 65 fatalities on Irish roads.

   ▪ This represents 8 fewer fatal collisions and 9 fewer deaths (-12%) compared to provisional Garda data for
     2020.

   ▪ In 2021
     ▪ 25% decrease in the number of fatalities occurring at the weekend compared to 2020
     ▪ 29% reduction in those killed aged 56 and older
     ▪ 75% of fatalities were male (49) and 25% of fatalities (16) were female

Note: All data for 2020 and 2021 are provisional and subject to change
Road user type
     January to 15 July 2021
              45
                                  40
              40                              38
                        36 36
              35
                                         29
              30
              25
                                                                                                                                                                  19
              20                                                                                                                                     17 18
              15                                                  13                                                                                         13
                                                         11 12 10                                             12
                                                                                                                          10
                                                                                                        9                      8
              10                                                                                                                                                       7
                                                                           6           6     5    6
                                                                                                                                     4       4
                5                                                                                                                                2
                0
                                Driver                         Passenger                     Motorcyclist                          Cyclist              Pedestrian
                                                                               2017   2018       2019       2020   2021

   ▪ Increase in the number of drivers (+9) and motorcyclists (+3), while there has been a decrease among passengers (-7),
     pedestrian (-12), cyclist (-2), in 2021 compared to 2020
   ▪ Of the 44 drivers and passengers killed in 2021, 16% were not wearing a seat belt.
Note: All data for 2018 to 2021 are provisional and subject to change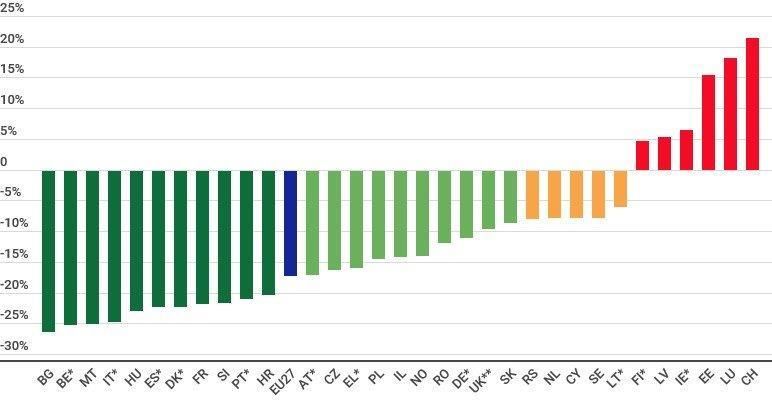
Time of day
     January to 15 July 2021
     25

                                                                                                    21
                                                                                                                        20
     20
                                                                                                                                       18
                                                                                                                   17             17
                                                                                                         16                  16             16
                             15                                      15        15
     15                                                                   14                                                                                            14
                                                                                                              13                                 13
                    12                                                              12                                                                         12
              11                                                                                                                                          11
                                                    10
     10                                         9                                        9                                                            9
                                           8
                                                         7                                                                                                          7
                                  6
                         5
      5
                                                             3

      0
                   midnight-4am                 4am-8am                   8am-12pm                       12pm-4pm                 4pm-8pm                 8pm-12am
                                                                     2017       2018         2019   20202      20213

       ▪ There was a reduction in the number of fatalities occurring between midnight and 8am in 2021
         compared to 2020 (-59%)
Note: All data for 2018-2021 are provisional and subject to change
Month of year
                                                                                                Monthly average deaths
     January to 15 July 2021                                                                    January - June 2021: 10
             20                                19                                        19
                                                                     18
             18
             16
             14
                                                                                                              12
             12                                                                                                    11
                                                                           10
             10           9
                                                                                                      8
              8                                                                    7                                          7
                                                                                                  6
              6                5                     5
              4                                                                                                           3
              2
              0
                           Jan                   Feb                     Mar           Apr        May          Jun        July
                                                                                2020     2021

     ▪ In 2021, car traffic volumes were lower in Jan (-53%) and Feb (-47%) compared to 2020 and had started to
       increase in March (-20%) and April (170%)
Note: All data for 2020 and 2021 are provisional and subject to change
Location of fatalities
     January to 15 July 2021

     ▪ Of the 11 fatalities in Dublin in 2021,
       there were
         ▪ 5 drivers
         ▪ 3 motorcyclists
         ▪ 2 passengers
         ▪ 1 cyclist

Note: All data for 2020 and 2021 are provisional and subject to change
Fatalities by rural and urban
area
January to 15 July 2021
90
80
70
60
50 59 54
51
74% 68% 78% 57 69% 82%
40 53
30
20
25 23
10 21
16
26% 32% 22% 31% 18% 12
0
2017 2018 2019 2020 2021
Urban Rural
Note: All data for 2018-2021 are provisional and subject to change. Rural road is one with a speed limit of 80 km/h or greater, urban is one with a speed limit of 60 km/h or lessOverview 2021 serious injuries
January to 30 June 2021
▪ As of 30 June 2021, there have been 364 serious injury collisions
▪ As of 30 June 2021, there have been 406 serious injuries on Irish roads
▪ This represents 73 fewer serious injuries (-15%) compared to provisional Garda data for 2020
180 164
157
160
140
Serious injuries 120
by road user type 100
97
90 85
80 66
62 56 58
60 50
40
20
0
Driver Passenger Motorcyclist Pedestrian Pedal cyclist
Note: All data for 2020 and 2021 are provisional and subject to change 2020 2021Dangerous behaviours increasing
More permissive attitudes to errant behaviour in 2020, coupled with change in travel patterns
Speeding Drink driving
▪ Increases in self-report admission of speeding ▪ 1 in 10 motorists admit to driving after
on both 50km/h and 100km/h roads. consuming alcohol, in line with trends, but more
▪ The perceived acceptability of speeding has permissive attitude towards acceptable limits for
significantly increased. driving
▪ Strong support for the use of safety cameras
has declined.
Mobile phone use
▪ Small increase in motorists admitting to
Fatigue
texting/checking apps while driving – approx. 1
▪ Significant increase in % of motorists admitting in 10, but incidence of motorists taking
to falling asleep/nodding off while driving preventative safety measures with their mobile
relative to historic data phones has increased.
Source: Driver Attitudes & Behaviour Study
Online survey of 1,241 motorists conducted by B&A on behalf of the RSAConclusion
Renewed efforts required to improve Ireland’s road safety record
Ireland did not see reduction in fatalities in 2020 in line with reduced traffic, and has
slipped to 5th position in EU 27 ranking in 2020.
Drivers and motorcyclists highest risk for fatalities in 2021 to date, but vulnerable
road users represent a higher share of serious injuries to date relative to fatalities.
Increased focus on preventing serious injuries acknowledged and will be of priority
in the next government Road Safety Strategy.
Change in pattern evident for day of week and time of day for fatalities, but Dublin
and rural roads represent high proportion of fatalities.
Concerning regression in attitudes towards speeding suggests increased need for
education/enforcement in this area in particular.
Urgent need for road safety education and enforcement as country opens up.Thank you
Appendix
Age group of fatalities
     January to 15 July 2021
     18                                                                                                                   17
     16
     14                                                          13                      13       13                                 13
                                                                        12
     12
                                         10                                                                  10
     10                                                                                                  9
                                                8
      8                                                                                                           7
      6          5
                            4                                                                                         4
      4
      2
      0
Gender of fatalities
January to 15 July 2021
60
54
49
50
40
30
20
20 16
10
0
Male Female
2020 2021
▪ In 2021, 75% of fatalities were male (49) and 25% of fatalities (16) were female
Note: All data for 2020 and 2021 are provisional and subject to changeDay of week
January to 15 July 2021
25
22
20
20
17
16
15 14 14
13 13 13
12 12 12 12
11 11 11 11
10 10 10 10
10 9 9 9
8 8 8 8 8
7 7
6
5
5
3
2
0
Monday Tuesday Wednesday Thursday Friday Saturday Sunday
2017 2018 2019 2020 2021
▪ In 2021, 41 fatalities occurred on weekdays compared to 41 in 2020, 24 occurred at weekends
compared to 32 in 2020
Note: All data for 2018 to 2021 are provisional and subject to changeLong-term trend in serious injuries
2016 - 2020
1600
1359 1366
1400
1200 1052 1099
965
1000
20% decrease in serious
800
Injuries in 2020
600
400
200
0
2016 2017 2018 2019 2020
Serious Injuries
▪ Between 2019 and 2020, there was a 20% decrease in serious injuries on Irish roads
▪ Total traffic volumes in 2020 were approximately 25-30% below 2019 levels
Note: All data for 2018 to 2021 are provisional and subject to changeRoad user Type, Fatalities and
Serious injuries
Three year average of road user type as percentage of total
100%
90% 24% 20%
80%
70% 6% 20%
11% Pedestrian
60%
14% Cyclist
50% 14%
Motorcyclist
40% 14% Passenger
30% Driver
20% 44%
32%
10%
0%
Fatalities Serious Injuries
Three year average n=141 Three year average n=1275
Note: All data for 2018 to 2021 are provisional and subject to changeKey Statistics from Driver Attitude and Behaviour Study 61% of motorists admit to exceeding 50km/h speed limits by less than 10km/h ‘at least sometimes’ (up from 48% in 2019) 53% of motorists admit to exceeding 100km/h speed limits by less than 10km/h ‘at least sometimes’ (up from 41% in 2019) 36% of motorists admit to exceeding 50km/h speed limits by more than 10km/h ‘at least sometimes’ (up from 26% in 2019) 35% of motorists admit to exceeding 100km/h speed limits by more than 10km/h ‘at least sometimes’ (up from 23% in 2019) 61% of motorists believe it is acceptable to exceed 50km/h speed limits by less than 10km/h (up from 53% in 2019) 59% of motorists believe it is acceptable to exceed 100km/h speed limits by less than 10km/h (up from 45% in 2019) 34% of motorists believe it is acceptable to exceed 50km/h speed limits by more than 10km/h (up from 26% in 2019) 34% of motorists believe it is acceptable to exceed 100km/h speed limits by more than 10km/h (up from 19% in 2019) 41% of motorists stated they ‘strongly support’ the use of safety cameras, down from 57% in 2019. 28% of motorists now indicate they have fallen asleep or nodded off/ even if only for a brief moment when driving (up from 16% in 2019) 10% of motorists admit to texting while driving ‘at least sometimes’ (up from 6% in 2019) 9% of motorists admit to checking apps while driving ‘at least sometimes (up from 4% in 2019) 9% of motorists admit to talking on a handheld phone while driving ‘at least sometimes (down from 12% in 2019) 56% of motorists state that they take preventative safety measures regularly (turn off/on silent, put out of sight) before setting out to drive , up on 40% in 2019 43% of all motorists now believe ‘no alcohol’ can be consumed to remain under legal limit (down from 64% in 2019) 9% of motorists consumed alcohol before driving in past 12 months –largely on a par with previous years
Key Interventions in the first
half of 2021
 Significant focus on deploying Seatbelt Safety campaign to address the number of passenger deaths.
 Concerted messaging to target vulnerable road users in first half of the year particularly cycling and
 pedestrian safety
 Motorcycle safety campaign was deployed early in response to the deaths of 7 motorcyclists in April, in
 addition to the recent ‘Bike Safe’ campaign
 Road safety campaigns deployed with An Garda Síochána around high risk bank holiday weekends
 targeting drug driving, mobile phone use and drink driving. Informed by Garda enforcement statistics.
 The RSA and An Garda Síochána mounted a high profile ‘Back on the Road’ campaign for coming out of
 lockdown
 Particular focus on advertising online and on social media platforms to target young drivers and road users
 The RSA and An Garda Síochána ran an anti speeding campaign to mark UN Global Road Safety week in
 May
Key Finding                                                      Action / Intervention
*Males (Incl. young males) - 75% of fatalities are male          RSA mass media campaigns targeting primary audience of ‘Males’

      Key Findings from review and                               RSA has focused advertising on a special ‘Sports Advertising Package’ targeting
                                                                 males

      planned
Collision              interventions
          Time – peak period 12pm to 4pm, midweek                Our advertising messaging is being deployed in line with collision ‘day of week’
                                                                 and ‘time of day’ patterns*
*Rural Roads – 81.5% of fatalities occur 80kmph+ zones           New ‘Rural Roads’ mass media campaign being developed

Drivers – attitudes to killer behaviors regressing               Mass media interventions on Drink Driving, Non Seatbelt Wearing, Drug Driving,
                                                                 sharing the road safely with vulnerable road users being deployed in second half
                                                                 of the year.

Motorcyclists – second highest fatality rate of users            Motorcycle mass media campaign being deployed in August.

*Speeding – Speeding detections up in 2021                       An Garda Síochána ‘National Slow Down Day’ planned for October, which the RSA
                                                                 will be supporting with advertising
                                                                 Deploying ‘speeding on rural roads’ digital campaign in September.

Serious Injuries – 49% of serious injuries are Vulnerable Road   New road safety TV Series, part funded by the RSA, featuring personal stories of
                                                                 road trauma will air in September
Users
                                                                 RSA publishing ‘Serious Injuries’ Report in October

Traffic volumes returning to pre-covid levels                    Custom designed Staycation campaign will continue throughout August

                                                                 RSA will upweight its road safety messaging in line with increase in traffic
                                                                 volumes.
Driver Fatigue - 1 in 5 fatal crashes & attitudes regressing     RSA deploying its ‘Driver Fatigue’ mass media campaign throughout August
                                                                 The RSA and Applegreen will team up over the August Bank Holiday up to provide
                                                                 free cups of coffee to drivers travelling on Friday 30 July and Monday 2 August
Other planned interventions ‘Back to School’ campaign. September will see the launch of the new Government Road Safety Strategy Mass media campaigns focusing on seatbelt wearing and the safe overtaking of cyclists Launch of a new mass media ‘Older Pedestrian’ road safety campaign Irish Road Safety Week will run from Monday 4 to Sunday 10 October A joint campaign between the RSA and An Garda Síochána to focus on unaccompanied learner drivers
6 Month Road Safety
Review – Enforcement
Statistics
1st January –
30th June 2021

Chief Superintendent
Michael Hennebry

26th July 2021
*Figures are as of 30th June 2021 and are
operational, provisional and subject to change.
                                                  25
Road Traffic Volumes 2020-2021*
Traffic volumes are provided by TII (Transport Infrastructure Ireland) and include all vehicle
types from 15 locations nationwide.
Traffic volumes are trending upwards since January 2021, and are almost back at ‘pre-COVID-
19’ levels.
* Daily traffic volumes are based on all data available and relate to all vehicle types. Data supplied by Transport Infrastructure Ireland. 26Enforcement of ‘Lifesaver Offences’ 2020-2021
Lifesaver Offences –
o Speeding
o Driving while intoxicated
o Using mobile phone while driving
o Non-wearing of seatbelts
There has been an 11% increase in Lifesaver Offences detected up to 30th June 2021
compared to same period last year.
Jan - June 2020 Jan - June 2021 Change (%)
Lifesaver Offences 98,755 109,528 11%
27Enforcement – Speed - January – 30th June 2021
There has been an 13% increase in speed detections up to 30th June 2021 compared to
same period last year.
Jan -June 2020 Jan-June 2021 Change (%)
Speeding
78,364 88,327
offences 13%
Intercept speed detections (AGS): 22% increase. Non-Intercept speed detections: 6%
increase.
Jan-June 2020 Jan-June 2021 Change (%)
Speed - Intercept 32,458 39,685 22%
Speed– Non-Intercept 45,906 48,642 6% 28Enforcement – Drink and Drug Driving
The total number of arrests for drivers on suspicion of driving whilst intoxicated has
decreased by 8% between January and 30th June this year compared to the same
period in 2020.
There were 13% more arrests of drivers on suspicion of Drug-Driving up to the 30th of
June this year than last year.
Drink-Driving arrests are steadily increasing since January 2021 and were higher in
June 2021 than June 2020.
Jan-June 2020 Jan-June 2021 Change (%)
Drink-Driving arrests 2529 2062 -16%
Drug-Driving arrests 1886 1994 13%
Total arrests 4415 4056 -8% 29Enforcement – Drink-Driving
Drink-Driving arrests fluctuated in 2020 generally in line with the reduction in traffic
volumes and Covid -19 restrictions.
Drink-Driving arrests have increased in recent months in line with increasing traffic
volumes and the phased changes to Covid-19 restrictions.
* Daily traffic volumes are based on all data available and relate to all vehicle types. Data supplied by Transport Infrastructure
Ireland.Enforcement – Drug-Driving
Whilst the total number of arrests for driving while intoxicated (Drink and Drugs) are
reduced by 8% this year, Drug Driving arrests are 13% higher this year than the same
period last year.
Drug Driving arrests are significantly higher so far this year.
* Daily traffic volumes are based on all data available and relate to all vehicle types. Data supplied by Transport Infrastructure
Ireland. 31Enforcement – Mobile Phones 2020-2021
Detections of persons using mobile phones whilst driving have increased by 13% this
year so far compared to same period last year.
Overall, detections for use of mobile phones whilst driving fluctuated according to
traffic volumes since February 2020. Detections of this lifesaver offence increased
sharply between January and April 2021.
Jan-June
Jan-June 2020 Change (%)
2021
Mobile Phones 11,436 12,923 13%
* Daily traffic volumes are based on all data available and relate to all vehicle types. Data supplied by Transport Infrastructure
32
Ireland.Enforcement – Seatbelts 2020-2021
Detections for non-wearing of seatbelts are 7% lower this year than during the same
period in 2020. Detections for this lifesaver offence has been trending upwards since
December 2020.
Jan-June
Jan-June 2020 Change (%)
2021
Non-wearing of
4,540 4,222
seatbelts -7%
* Daily traffic volumes are based on all data available and relate to all vehicle types. Data supplied by Transport Infrastructure
33
Ireland.Enforcement – Checkpoints
The number of Mandatory Intoxicant Testing (MIT) Checkpoints are 5% higher this year
so far than last year.
Mandatory Intoxicant Testing (MIT) Checkpoint numbers have increased in line with
rising traffic volumes and easing of COVID-19 restrictions.
Jan-June 2020 Jan-June 2021 Change(%)
MIT
Checkpoints 17169 18023 5%
Other
Checkpoints 83278 54826 -34%
Total 100447 72849 -27%August Public Holiday 2021
The primary purpose of this August Public
Holiday Roads Policing Operation is the
enforcement of ‘Lifesaver Offences’ to
prevent fatal road traffic collisions and
serious injury on our roads.
35You can also read