The Impact of Biodiversity and Urban Ecosystem Services in Real Estate The Case of the Region Ile-de-France - ERES 2021 - Theme G Sustainable Real ...
←
→
Page content transcription
If your browser does not render page correctly, please read the page content below
The Impact of Biodiversity and Urban Ecosystem
              Services in Real Estate
       The Case of the Region Ile-de-France
         ERES 2021 – Theme G Sustainable Real Estate

Carmen Cantuarias-Villessuzanne   Jeffrey Blain   Radmila Pineau

                        4th June, 2021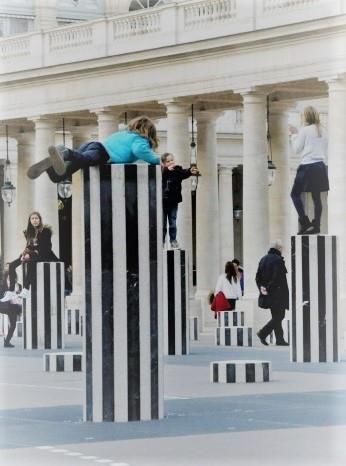
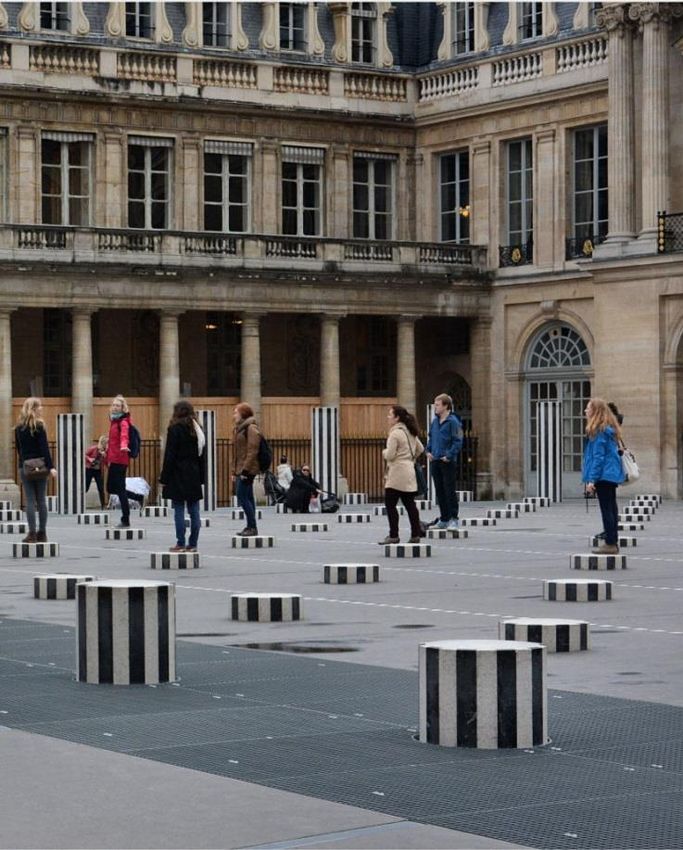
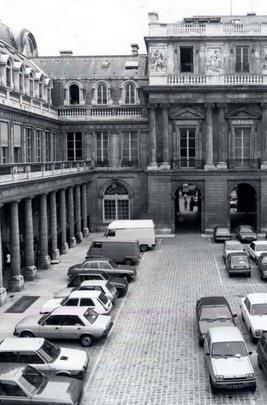
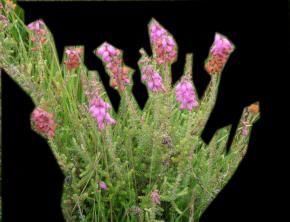
The controversy of the Buren Columms in Paris

  Photo credits: (left) Un jour de plus à Paris; (middle) Jacques Bousiquier; (right) Georges Fontaine.
  Endangered species : le flambé (Iphiclides podalirius); oeillet couché (Dianthus deltoides); fougère des montagnes (Orepteris limbosperma); bruyère ciliée (Erica ciliaris); bergeronnette
  printanière (Motacilla flava)

   Cantuarias, Blain & Pineau                                                             ESPI2R                                                                4th June, 2021                 2 / 27
What is the perception of biodiversity in the French real
estate market?

  Cantuarias, Blain & Pineau   ESPI2R           4th June, 2021   3 / 27
Nature in cities: urban ecosystem services

Urban ecosystem services (UES) of trees, green spaces and urban forests:
     air filtration,
     regulation of microclimate (city scale),
     noise reduction,
     rainwater drainage,
     wastewater treatment,
     recreational and cultural services.

Exploratory research projet
Raising awareness about the value of biodiversity and UES for the French
real estate market in the private residential housing

  Cantuarias, Blain & Pineau        ESPI2R                 4th June, 2021   4 / 27
Data: Cooling service in the region Île-de-France (2017)
                               Cooling service in the region Ile-de-France

                                                                             Cooling service
                                                                                  -5 - -4
                                                                                  -4 - -3
                                                                                  -3 - -3
                                                                                  -3 - -2

                                                                              Source : IDEFESE
                                                                              Author : Jeffrey Blain
                                                                              May 2021

  Cantuarias, Blain & Pineau                 ESPI2R                                         4th June, 2021   5 / 27
Data: Water surfaces in the region Île-de-France
Water surfaces in the region Ile-de-France
Percentage of water surfaces
0,0 - 9,0
9,0 - 18,5
18,5 - 32,3
32,3 - 55,3
55,3 - 99,6
Source : CORINE Land Cover
Author : Jeffrey Blain
May 2021
Cantuarias, Blain & Pineau ESPI2R 4th June, 2021 6 / 27Data: Noise level in the region Île-de-France (2018)
Surface convered by noise (>35db; %)
0,0 - 0,0
0,0 - 15,0
15,0 - 50,0
50,0 - 90,0
90,0 - 100,0
Source : Bruitparif
Author : Jeffrey Blain
May 2021
Cantuarias, Blain & Pineau ESPI2R 4th June, 2021 7 / 27Data: Flood indicator in the region Île-de-France (2017)
Flood indicator in the region Ile-de-France
Flood indicator
143 - 206
206 - 236
236 - 256
256 - 296
Source : IDEFESE
Author : Jeffrey Blain
May 2021
Cantuarias, Blain & Pineau ESPI2R 4th June, 2021 8 / 27Data: Public natural area in the region Île-de-France
Public natural area in the region Ile-de-France
Public natural area indicator
0,000 - 0,170
0,170 - 0,283
0,283 - 0,446
0,446 - 1,000
Source : IDEFESE
Author : Jeffrey Blain
May 2021
Cantuarias, Blain & Pineau ESPI2R 4th June, 2021 9 / 27Data: Average price of transactions for residential housing
in the region Île-de-France (2014–2020)
Evolution rate (%)
-80 - 0
0 - 27
27 - 80
80 - 200
200 - 709
Source : DVF
Author : Jeffrey Blain
May 2021
Cantuarias, Blain & Pineau ESPI2R 4th June, 2021 10 / 27Hedonic price and green areas
Some studies in France:
Bono, Gravel, and Trannoy 2008 demonstrated that the price of
housing in Marseille (1995–2000) is sensitive to the presence of more
than 5% of a natural area in the neighborhood.
Baudry et al. 2009 showed that the distance from the river to the
nearest garden has not effect on apartment’s prices over the period
1994–2001, but the distance to the nearest wooded area increase the
price in the city of Rennes.
Travers, Appere, and Larue 2013 found in the city of Angers that the
price of housing is sensitive to the presence of green spaces, but only
when these green spaces are relatively large.
Cantuarias, Blain & Pineau ESPI2R 4th June, 2021 11 / 27Hedonic price: estimating the social value of local public
goods and amenities
Gravel, Michelangeli, and Trannoy 2006 use a (non-linear) hedonic model
to estimate the implicit prices of 24 local public goods and amenities in
the Paris suburban area on an data set of some 8500 units of housing.
They observed:
pupils/teachers ratio does not explain significantly housing prices;
grade repetition (measured by the fraction of junior high school
students who have failed at least twice at school) affects significantly
housing prices;
housing owners’marginal willingness to pay for reducing commuting
time is higher for public transportation than it is for car
transportation.
Cantuarias, Blain & Pineau ESPI2R 4th June, 2021 12 / 27Data: 5259 IRIS and 101 variables
Description Source Period
Average price of transactions per m2 per IRIS
DVF 2014–2020
in private residential housing
Internal characteristics of housing INSEE 2017
Housing: number of houses,
number of appartments, secondary housing
and vacancy
Size of housing by m2 and by rooms
Property: owners, renters, social housing, free
Age of housing and households
Moving in (years)
Cantuarias, Blain & Pineau ESPI2R 4th June, 2021 13 / 27Data: External characteristics of housing
Description Source Period
Société du Grand
Infrastructure: train station, 2016
Paris,
tramway station, metro, road station 2021
IGN BD TOPO
Centrality: distance (in m) between the
estimated 2018
center of Paris and the center of the IRIS
Environment and transport
Air pollution: IRIS in a sensitive area DRIEE IDF 2015
Noise: area and average dB/IRIS Bruitparif 2018
Individual transport: number of cars INSEE 2017
by household, road in km IGN BD TOPO 2021
Cantuarias, Blain & Pineau ESPI2R 4th June, 2021 14 / 27Data: Socio-economic indicators
Description Source Period
Education: % of baccalauréat holders in the
INSERM 2019
population aged over 15
Income: average income per household
Unemployment: rate
Handworkers: % of handworkers
in the labor force
Cantuarias, Blain & Pineau ESPI2R 4th June, 2021 15 / 27Data: Biodiversity and UES
Description Source Period
Biodiversity indicators DRIEE IDF 2019
Regional natural parks
Project of regional natural parks
Natural area of ecological, faunistic
and floristic interest
Classified site, quarry
Urban ecosystem services IDEFESE 2012–2017
Public natural space indicator of at least
1.5 ha within a radius of 300m around each
inhabitant
Vegetation water retention indicator
Cooling indicator
Cantuarias, Blain & Pineau ESPI2R 4th June, 2021 16 / 27Data: Green areas
Description Source Period
Green areas CORINE Land Cover 2018
Urban green areas (km2 )
Arable lands (km2 )
Vineyards (km2 )
Orchards (km2 )
Meadows (km2 )
Agriculture (km2 )
Forest (km2 )
Swamp km2 )
Rivers (km2 of rivers and waterways)
Water places (km2 of water bodies)
Cantuarias, Blain & Pineau ESPI2R 4th June, 2021 17 / 27Log-linear model: MCO preliminary results
Dependant: ln_price2017 Model 1 Model 2 Model 3 Model 4
Intercept 7.631e+00*** 8.402e+00*** 8.748e+00*** 8.822e+00***
price2016 1.212e-04*** 1.278e-04* 1.879e-04*** 1.377e-04
price2015 6.539e-05
price2014 4.892e-05
bachelor 7.037e-03** 1.318e-02 1.357e-02 . 1.474e-02
family_income 1.005e-05 . -1.867e-05 -1.172e-05 -2.329e-06
unemployment -2.260e-03 -1.579e-02 -1.876e-02 -4.101e-03
housing 3.479e-05 -3.038e-04 -3.042e-04 -5.646e-04
second_homes_pct -6.614e-01* -2.289e+00* -2.343e+00* 1.287e-01
vacancy_pct -1.604e+00** -3.954e-01 3.754e-02 1.767e-01
houses_pct -4.165e-02 8.188e-01** 8.548e-01** 1.011e+00 .
owners_pct -1.972e-01 -1.353e+00 -1.586e+00 . -1.432e+00
hlm_pct 4.354e-02 -6.426e-01 -7.151e-01 -5.075e-01
moving_in 9.992e-06 . -7.942e-06 -2.139e-06 -9.564e-06
car -2.184e-04 . 3.335e-04 2.403e-04 6.149e-04
station_gpe_binOUI 2.910e-01 . 6.028e-01 . 5.921e-01 7.645e-01
tramb inOUI -8.763e-03 7.853e-02 7.865e-02 1.105e-01
airOUI 1.332e-01** 7.593e-02 4.542e-02 -2.417e-01
flood2012 2.419e-03 1.574e-02 1.777e-02 . 1.863e-02
flood2017 -4.097e-03 -1.700e-02 -1.936e-02 . -1.930e-02
city_refreshment2017 -9.008e-03 5.063e-02 6.690e-02 1.007e-01
rivers 7.832e-04 2.747e-01
public_natural_area -1.711e-01 -3.140e-01 -5.527e-01
gree_area -1.443e-02 -1.386e-03 -1.386e-01
centrality -5.297e-06
noise_area -2.984e-02
Signif. codes: 0 ‘***’ 0.001 ‘**’ 0.01 ‘*’ 0.05 ‘.’ 0.1 ‘ ’ 1
Cantuarias, Blain & Pineau ESPI2R 4th June, 2021 18 / 27Log-linear model: MCO preliminary results
Dependant: ln_price2017 Model 1 Model 2 Model 3 Model 4
Multiple R-squared: 0.7921 0.906 0.8941 0.9036
Adjusted R-squared: 0.7785 0.812 0.8051 0.6264
Cantuarias, Blain & Pineau ESPI2R 4th June, 2021 19 / 27Discussion from MCO estimates
Variables of biodiversity and urban green areas are not significant.
Variables of UES: low level but significant for flood variables.
Access to new infrastructure like GPE station is significant for two
model.
Traditional variables as education, income, number of houses,
secondary houses, and vacancy impact the residential price.
Cantuarias, Blain & Pineau ESPI2R 4th June, 2021 20 / 27Next Model: SEM and RE-SEM
The two models will be estimated separately, and finally jointly in the
RE-SEM model (Chakir and Le Gallo 2013; Chakir, De Cara, and Vermont
2011)
The hedonic model, in reduced form RE-SEM is:
K L
Pit = α + αk Xkit + γl Xki + uit
X X
k=1 l=1
uit = µi + it
N
wij jt + vit
X
it = λ
j=1
where Pit is the average price of transactions of residential housing in the
IRIS i to the date t, with i = [1 : 5259] and t = [2014 : 2020].
Cantuarias, Blain & Pineau ESPI2R 4th June, 2021 21 / 27Discussion
Three mechanisms to analyze:
Proximity: to distinguish the mechanism that explain the variation in
the price of residential real estate by the presence of natural spaces
(urban biodiversity and UES), as well as that of the price of the IRIS
neighboring the area.
Anticipation: to identify the variation in prices due to a benefit or a
direct damage by the environmental amenity, of the variation due to
mental processes of anticipation on the part of the owners, or the
possible purchasers.
Peri-urban area – rural area: to characterize the effects in peri-urban
areas from those in rural areas. The dynamics and issues of
artificialization suggest that the impact in price will act in a different
way (Vermont 2016).
Cantuarias, Blain & Pineau ESPI2R 4th June, 2021 22 / 27References I Baudry, Marc, Alain Guengant, Sophie Larribeau, and Matthieu Leprince (2009). “Formation des prix immobiliers et consentements à payer pour une amélioration de l’environnement urbain : l’exemple rennais”. fr. Revue d’Économie Régionale & Urbaine avril.2, p. 369. issn: 0180-7307, 2107-0865. doi: 10.3917/reru.092.0369. url: http://www.cairn.info/revue-d- economie-regionale-et-urbaine-2009-2-page-369.htm (visited on 06/01/2021). Bono, Pierre-Henri, Nicolas Gravel, and Alain Trannoy (Feb. 2008). “L’importance de la localisation dans la valorisation des quartiers marseillais”. fr. Économie publique/Public economics 20. issn: 1373-8496, 1778-7440. doi: 10.4000/economiepublique.6202. url: http://journals.openedition.org/economiepublique/6202 (visited on 06/01/2021). Cantuarias, Blain & Pineau ESPI2R 4th June, 2021 23 / 27
References II

   Chakir, Raja, Stéphane De Cara, and Bruno Vermont (2011).
   “Émissions de gaz à effet de serre dues à l’agriculture et aux usages
   des sols en France : une analyse spatiale”. Economie et Statistique
   44-445. Land Use, pp. 201–221. url: https://www.insee.fr/fr/
   statistiques/fichier/1377859/ES444J.pdf.
   Chakir, Raja and Julie Le Gallo (2013). “Predicting land use allocation
   in France: A spatial panel data analysis”. Ecological Economics 92.
   Land Use, pp. 114–125. issn: 0921-8009. doi:
   https://doi.org/10.1016/j.ecolecon.2012.04.009. url:
   https://www.sciencedirect.com/science/article/pii/
   S0921800912001395.

  Cantuarias, Blain & Pineau      ESPI2R                   4th June, 2021   24 / 27
References III

   Gravel, Nicolas, Alessandra Michelangeli, and Alain Trannoy (2006).
   “Measuring the social value of local public goods: an empirical analysis
   within Paris metropolitan area”. Applied Economics 38.16,
   pp. 1945–1961. url: https://EconPapers.repec.org/RePEc:taf:
   applec:v:38:y:2006:i:16:p:1945-1961.
   Travers, Muriel, Gildas Appere, and Solène Larue (2013). “Évaluation
   des aménités urbaines par la méthode des prix hédoniques : une
   application au cas de la ville d’Angers”. fr. Economie et statistique
   460.1, pp. 145–163. issn: 0336-1454. doi:
   10.3406/estat.2013.10203. url:
   http://www.persee.fr/web/revues/home/prescript/article/
   estat_0336-1454_2013_num_460_1_10203 (visited on 06/01/2021).

  Cantuarias, Blain & Pineau      ESPI2R                    4th June, 2021   25 / 27
References IV

   Vermont, Bruno (Oct. 2016). Prix des terrains à bâtir. Une analyse
   spatiale. Tech. rep. Paris, France: MTE,CGDD. url:
   http://temis.documentation.developpement-
   durable.gouv.fr/document.html?id=Temis-0085414.

  Cantuarias, Blain & Pineau     ESPI2R                   4th June, 2021   26 / 27
Thank you

  Cantuarias, Blain & Pineau   ESPI2R   4th June, 2021   27 / 27
You can also read