EPA TRIENNIAL DBE GOAL FOR FFY 2021 2023 - August 2020
←
→
Page content transcription
If your browser does not render page correctly, please read the page content below

EPA TRIENNIAL DBE GOAL FOR
 FFY 2021 - 2023
 Metropolitan Council Office of Equal Opportunity

August 2020
The Council’s mission is to foster
 efficient and economic growth for
 a prosperous metropolitan region

Metropolitan Council Members
Charles Zelle Chair Raymond Zeran District 9
Judy Johnson District 1 Peter Lindstrom District 10
Reva Chamblis District 2 Susan Vento District 11
Christopher Ferguson District 3 Francisco J. Gonzalez District 12
Deb Barber District 4 Chai Lee District 13
Molly Cummings District 5 Kris Fredson District 14
Lynnea Atlas-Ingebretson District 6 Phillip Sterner District 15
Robert Lilligren District 7 Wendy Wulff District 16
Abdirahman Muse District 8

 The Metropolitan Council is the regional planning organization
 for the seven-county Twin Cities area. The Council operates the
 regional bus and rail system, collects and treats wastewater,
 coordinates regional water resources, plans and helps fund regional
 parks, and administers federal funds that provide housing
 opportunities for low- and moderate-income individuals and families.
 The 17-member Council board is appointed by and serves at the
 pleasure of the governor.

 On request, this publication will be made available in alternative formats to people with
 disabilities. Call Metropolitan Council information at 651-602-1140 or TTY 651-291-0904.

Metropolitan Council Triennial DBE Goal for FFY 2021-2023
Executive Summary
This document presents the Metropolitan Council’s triennial DBE program goal for the federal fiscal
years of 2021-2023 and the methodology used to calculate the goal.

The Metropolitan Council’s DBE program goal for FFY 2021-2023 is 11% DBE participation in EPA-
assisted Council projects.

Methodology Options for Calculating DBE Goal
The goal setting process begins by determining a base figure for the relative availability of DBEs. The
following are optional approaches outlined in 49 CFR 26.45 that a recipient may take toward
determining a base figure. These options are intended to serve as a starting point for the goal setting
process. Any percentage figure derived from one of the optional methodologies should be considered a
basis from which you begin when examining all evidence available in its jurisdiction.
 1. Use DBE Directories and Census Bureau Data – Divide the number of DBEs in your market
 from your DBE directory, by the number of DBEs by the number of all businesses in the same
 NAICS Code using Census Bureau data.
 2. Use a bidders list - Determine the number of DBEs that have bid or quoted (successful and
 unsuccessful) on your DOT-assisted prime contracts or subcontracts in the past three years
 divided by the number of all businesses that have bid or quoted. 1
 3. Use data from a disparity study - Use a percentage figure derived from data in a valid,
 applicable disparity study. 2
 4. Use the goal of another DOT recipient - If another DOT recipient in the same, or substantially
 similar, market has set an overall goal in compliance with this rule, you may use that goal as a
 base figure for your goal. 3
 5. Alternative methods - you may use other methods to determine a base figure for your overall
 goal. 4

The Metropolitan Council’s DBE program goal for FFY 2021 – 2023 was calculated using a base goal
derived from the DBE Directory and Census Bureau Data.

1Using this approach, you must establish a mechanism to directly capture data on DBE and non-DBE prime and
subcontractors that submitted bids or quotes on your DOT-assisted contracts.
2
 Metropolitan Council’s most recent disparity study, released in 2018, was reflective of non-federally assisted
procurements only.
3
 Metropolitan Council’s Transit and Environmental Services procurements make its market unique from other
state-wide recipients
4
 Methodology must be based on demonstrable evidence of local market conditions and be designed to ultimately
attain a goal that is rationally related to the relative availability of DBEs in your market.

Page - 3 | METROPOLITAN COUNCIL
The calculation of this goal involved the following stages:

 1. Projecting future EPA-funded Council projects in FFY 2021-2023
 2. Determining the type of work in future projects
 3. Defining the market area for the Metropolitan Council
 4. Determining the availability of DBEs in the market area
 5. Step One: Calculating the goal’s base figure
 6. Step Two: Adjusting the base figure
 7. Step Three: Additional Adjustment

Projecting Future EPA-funded Council Projects in FFY 2021-2023
Both the Construction and Engineering departments in the Environmental Services Division were asked
to provide a list of projects for the FFY 2021-2023 triennium that will receive EPA (PFA) funding. Those
departments provided a list of 20 projects, which are listed below.

Table 1.
 Project Description Project Value
 Lift Station L46 and L49 $4,200,000
 Excelsior Area Lift Station L19, L20 and L21 $14,200,000
 Orono Area lift station / forcemain L44, L45 and L59 $11,300,000
 HSI East Isles forcemain Improvements $3,400,000
 Metro WWTP Site Preparation & Improvements $9,500,000
 Metro WWTP - Water Systems Renewal and Improvements Phase 2 $7,500,000
 Empire WWTP Solids Improvements Phase 2 $16,000,000
 St Bonifacius lift station / forcemain Rehab. L24 and FM 7508 $22,000,000
 Waconia forcemain 7508 Phase 3 West $2,200,000
 Interceptors 1-SP-200, 1-SP-201 & 1-SP-202 Renewal $12,500,000
 Metro WWTP Electrical Distribution Renewal Phase 3 $39,000,000
 Metro WWTP Electrical Distribution Renewal Phase 4 $15,000,000
 Primary Scum Improvements $1,000,000
 East Secondary Renewal $22,900,000
 Effluent Pumping Station Renewal $2,000,000
 Brooklyn Park Champlin Interceptor (BPCI) Renewal Phase - 2 $8,800,000
 Brooklyn Park Champlin Interceptor (BPCI) Renewal Phase - 3 $14,200,000
 Brooklyn Park Champlin Interceptor (BPCI) Renewal Phase - 4 $6,200,000
 Brooklyn Park New Lift Station L 32 $22,700,000
 Blue Lake Solids Processing – Phase 1 $2,500,000

 Total $237,100,000

Determining the Type of Work in Future Projects
In order to accurately calculate the relative availability of DBEs, the list of future projects provided in
Table 1 must be broken down into their specific types of work by North American Industrial
Classification System (NAICS) codes. The North American Industry Classification System (NAICS) is

Page - 4 | METROPOLITAN COUNCIL

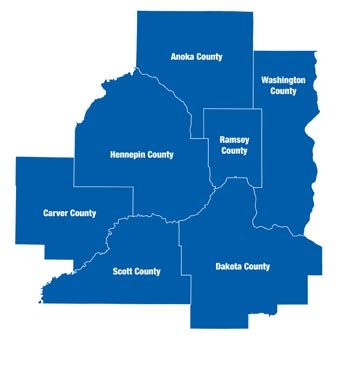
the standard used by Federal statistical agencies in classifying business establishments for the purpose
of collecting, analyzing, and publishing statistical data related to the U.S. business economy

Previous council projects of similarity were used to comprise a list of applicable work types, and values.
Appropriate six-digit NAICS codes were assigned to each work type.

Using previous projects for each of the above categories, a total of 19 six-digit NAICS codes represent
the scopes of work of the projects listed in Table 1. The six-digit NAICS codes, their projected spending
values and the percentage of the total future spending are listed below in Table 2.

Table 2.
 Estimated NAICS
 Work scopes % of Total
 Value codes
 Water and Sewer Line and Related Structures Construction $57,568,993 237110 0.11
 Highway Heavy/Asphalt Paving $3,337,780 237310 0.30
 Poured Concrete Foundation and Structure Contractors $15,127,936 238110 0.09
 Structural Steel $1,509,030 238120 0.32
 Masonry Contractors $1,786,686 238140 0.06
 Roofing Contractors $2,205,130 238160 0.07
 Electrical Contractors and other Wiring Contractors $58,842,774 238210 0.04
 Plumbing, Heating and Air Conditioning Contractors $25,206,740 238220 0.01
 Painting Contractors $826,726 238320 0.06
 Finish Carpentry (Doors and Windows) $531,164 238350 0.07
 Site Preparation $11,204,006 238910 0.16
 All Other Specialty Trade Contractors (Fencing) $74,810 238990 0.07
 Construction Material Wholesalers (Supplies) $11,086,430 423390 0.16
 Trucking $4,424,896 484220 0.22
 All other Support for Road Transportation (Street $39,760 488490
 Sweeping) 0.08
 Surveying/Project Documentation $508,104 541370 0.31
 Landscaping services $2,921,250 561730 0.03
 Water Supply and Irrigation Systems $1,759,000 221310 0.33
 All Other Support Services (Traffic Control) $834,722 561990 0.02
 Misc Fees / Mobilization / Allowances etc. $37,304,063 N/A 0.00
 Total $237,100,000 100%

Defining the Market Area for the Metropolitan Council
The jurisdiction of the Metropolitan Council extends across seven counties around the cities of
Minneapolis and St. Paul. These seven counties are Ramsey County, Hennepin County, Washington
County, Dakota County, Anoka County, Scott County and Carver County and referenced as the Metro
Area for purposes of this report.

The Metropolitan Council maintains a DBE directory with three other government agencies that
together form the Minnesota Unified Certification Program (MNUCP). The MNUCP Directory contains
all certified DBEs that would count towards DBE participation on Metropolitan Council projects.

Page - 5 | METROPOLITAN COUNCIL
The seven county Metro Area best represents the market area for DBEs that perform work with the
Metropolitan Council. Of the 1067 firms included in the MNUCP Directory, 598, or 56%, are located
within the Metro Area. Additionally, in 2019, 38 of the 46 (83%) of DBE firms that received payments
from Council EPA-funded projects were located in the Metro Area. Given the current composition in the
MNUCP Directory, and the record of DBE firms participating in Council projects, the seven county
Metro Area best represents the local market area for the Metropolitan Council.

Determining the Availability of DBEs in the Market Area
The 19 six-digit NAICS codes listed in Table 2 represent the scope of work included in future Council
projects that will receive EPA funding. Using the market area defined in the previous section, the
relative availability of ready, willing, and able DBEs can be calculated using data from the US Census
Bureau. The Census Bureau publishes the Economic Census which includes data on the number of
firms in a given geographic area that perform work in a given NAICS code. This data is available to the
specificity of six-digit NAICS codes.

Using the NAICS code data from the Census Bureau and information from the MNUCP DBE Directory,
relative availability of DBEs for each NAICS code can be calculated by showing what percentage RWA
DBEs represent of the overall pool of firms. This can be calculated only looking at the 19 NAICS codes
listed in Table 2. The table below shows the total number of firms, the number of DBEs, and the
percentage of the total pool DBEs represent for each of the 19 NAICS codes:

Table 3
 NAICS Code Total MN Firms Total DBE Firms DBE Relative
 Availability

 237110 91 10 .11

 237310 79 24 .30

 238110 182 17 .09

 238120 25 8 .32

 238140 215 13 .06

 238160 203 14 .07

 238210 612 23 .04

 238220 741 10 .01

 238320 487 27 .06

 238350 343 23 .07

 238910 241 39 .16

 238990 672 44 .07

Page - 6 | METROPOLITAN COUNCIL
423390 44 7 .16

 484220 179 39 .22

 488490 24 2 .08

 541370 36 11 .31

 561730 1188 35 .03

 221310 3 1 .33

 561990 147 3 .02

Step One: Calculating the Goal’s Base Figure
Calculating the base figure first starts with finding the weighted relative availability (WRA) of DBE firms
for each six-digit NAICS identified in the future spending. This WRA is found by dividing the number of
DBEs in each six-digit NAICS code by the total of all firms in MN in that code. The WRA is then
multiplied by the projected value of future spending in that NAICS code. The result is the total DBE
value for that NAICS. The DBE Values

The table below shows the projected future spending, availability of RWA DBEs and weighted
availability for each NAICS code. The column for “Weighted Relative Availability” is the product
of the columns for “Percentage of Future Spending” and “DBE Availability of RWA Firms.” The
final unadjusted base figure, in the bottom right cell, is the sum of all values in the “Weighted
Relative Availability” column.

Table 4
 Projected Percentage Weighted
 DBE Relative
 NAICS Code Future of Future Relative
 Availability
 Spending Spending Availability

 237110 $57,568,993 24% .11 0.0267

 237310 $3,337,780 1% .30 0.0043

 238110 $15,127,936 6% .09 0.0060

 238120 $1,509,030 1% .32 0.0020

 238140 $1,786,686 1% .06 0.0005

 238160 $2,205,130 1% .07 0.0006

 238210 $58,842,774 25% .04 0.0093

Page - 7 | METROPOLITAN COUNCIL
238220 $25,206,740 11% .01 0.0014

 238320 $826,726 >1% .06 0.0002

 238350 $531,164 >1% .07 0.0002

 238910 $11,204,006 5% .16 0.0076

 238990 $74,810 0% .07 0.0000

 423390 $11,086,430 5% .16 0.0074

 484220 $4,424,896 2% .22 0.0041

 488490 $39,760 >1% .08 0.0000

 541370 $508,104 >1% .31 0.0007

 561730 $2,921,250 1% .03 0.0004

 221310 $1,759,000 1% .33 0.0025

 561990 $834,722 >1% .02 0.0001

 Total 7.4%

The base figure for the overall DBE goal for the FFY 2021-2023 period is 7.4%.

Step Two: Adjusting the Base Figure
The base figure of 7.4% can then be adjusted using past DBE participation on Council EPA-funded
projects over the last Five years. From 2015 - 2019, Council EPA-funded projects attained the following
rates of DBE participation:

 • 2015 – 16.7%
 • 2016 - 13.5%
 • 2017 – 14.4%
 • 2018 – 15.2%
 • 2019 – 10.6%

The median of those five years of participation is represented by the 2017 rate of 14.4%. This value is
then averaged with the base figure to produce an adjusted base figure:

 (7.4% + 14.4%)
 = . % ≈ %
 2

Page - 8 | METROPOLITAN COUNCIL
This adjusted base figure of 11% represents the proposed Metropolitan Council EPA DBE
Program Goal for FFY 2021-2023.

Council Approval
On___________, the Council approved the _______% EPA DBE Triennial Goal.

Page - 9 | METROPOLITAN COUNCIL
390 Robert Street North
 Saint Paul, MN 55101-1805

 651.602.1000
 TTY 651.291.0904
 public.info@metc.state.mn.us
 metrocouncil.org

 Follow us on:
 twitter.com/metcouncilnews
facebook.com/MetropolitanCouncil
 youtube.com/MetropolitanCouncil
You can also read