Mid Suffolk East Suffolk - Gateway to Homechoice
←
→
Page content transcription
If your browser does not render page correctly, please read the page content below
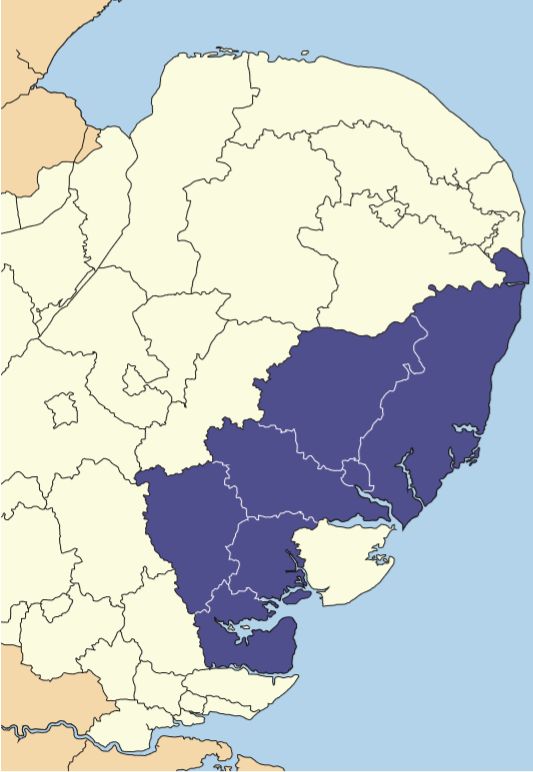
Mid Suffolk

                                                   East Suffolk

        Babergh

                                             Ipswich

Braintree

                                Colchester

    Maldon

                                                                  1
Gateway to Homechoice Annual Report 2019 - 20
This report is intended to summarise the main outcomes for the last year of the Gateway to Homechoice system of choice-
based lettings.
How the scheme operates
The 7 local authorities in the Gateway to Homechoice scheme advertise vacancies in rented social housing using the same
system that operates as follows:
• The local authorities (LAs) use a single IT system and web-site for registering applicants and advertising and
allocating properties.
• Each week the vacant social housing in the area of operation of the 7 LAs is advertised on the Gateway to
Homechoice website.
• Applicants who are registered can indicate up to 2 properties they are interested in either online or by phone.
• All of the vacancies advertised through the scheme are owned by councils or housing associations.
• All of the LAs operate the same allocation policy.
• The allocations policy sets out:
o how people register;
o how registered applicants can choose where they live; and
o how the property is allocated to a specific household.
Qualification and Local Connection
People register with the LA where they live (or would like to live if they come from outside the sub- region of the scheme).
Applicants with no local connection to any of the LAs are ‘demoted’ by one Band compared to someone with the same
housing issue from within the area. An applicant will be considered to have a local connection to the sub-region if:
• their only or principle home is in one of the participating districts; or
• they were placed in specialised housing outside the sub-region, but previously lived here; or
• they are in permanent paid work in the sub-region; or
• they have an adult son, daughter, brother, sister, mother or father who lives here and has done so for at least 5
years.
Shortlisting
The principle of the system is that properties are normally let to the household that wants the property and has been
waiting the longest in the highest Band.
Available properties are advertised on the Gateway to Homechoice website for a week, starting on Thursday morning and
closing on the following Wednesday at midnight. As people place their bids for housing, the system automatically compiles
a shortlist of applicants. The order of the applicants is from Band A down to Band E. If 2 or more applicants have the same
band, then the system will normally place the applicant with the longest date first.
The Gateway to Homechoice website address is www.gatewaytohomechoice.org
21. Number of properties let in each local authority through Gateway to Homechoice between 2015/16 &
2019/20
The number of properties that become available to let each year is affected by a number of factors but the main ones are:
• the number of rented social homes in the area and
• the number of new affordable homes let in that year.
The variations between the LAs reflects mainly the size of their social rented sector. For example, Ipswich and East Suffolk
have the largest number of social homes, while Maldon has the smallest number. The changes from one year to the next
within a local authority area usually reflect the variation in the number of new homes provided.
Number of Lets 2015-16
Number of Lets 2016-17
340
339 Number of Lets 2017-18
Babergh District Council 303 Number of Lets 2018-19
281
356 Number of Lets 2019-20
583
544
Braintree District Council 584
695
667
752
529
Colchester Borough Council 647
658
658
992
1127
East Suffolk Council 1042
981
984
1031
788
Ipswich Borough Council 710
668
650
189
117
Maldon District Council 119
66
151
367
360
Mid Suffolk District Council 338
427
374
32. Total number of properties let in each Local Authority in 2019/20 split by type of rent
Social housing for rent can be let at social or affordable rent levels. Social rent is set using a formula that takes into account
local earnings and house prices, while affordable rent is set at 80% of market rent. In general, affordable rents are higher
than social rents and the gap between them is bigger for bigger properties.
Affordable rents are usually charged for all new social housing. Some housing providers also ‘convert’ properties from
social rent to affordable rent when they become vacant. This raises money to invest in new affordable housing.
Social Rent Affordable Rent
Babergh District Council 235 121
Braintree District Council 497 170
Colchester Borough Council 476 182
East Suffolk Council 474 510
Ipswich Borough Council 610 40
Maldon District Council 61 90
Mid Suffolk District Council 291 83
43. Total number of properties let in 2019/20 split by the number of bedrooms in the property
4 Bed, 50 Studio, 44
3 Bed, 630
1 Bed, 1438
2 Bed, 1676
There were also 2 x 5 bed properties let in 2019/20.
4. Proportion of property lettings in 2019/20 made through Gateway to Homechoice split by age of the
main applicant
Age 16 - 25 Age 26 - 35 Age 36 - 45 Age 46 - 55 Age 56 - 65 Age 66 - 75 Over 76
Over 76, 5%
Age 66 - 75, 7%
Age 16 - 25, 20%
Age 56 - 65, 12%
Age 46 - 55, 12%
Age 26 - 35, 28%
Age 36 - 45, 16%
5About ‘Bands’
When someone applies for housing, the urgency of their application is assessed in line with the Allocations Policy, which
can be viewed and downloaded from the scheme’s web-site. Applications are placed in ‘Bands’ from A to F, depending
on the level of need. The main categories of need for each band are summarised below. (Please look at the website if
you want a complete guide to the banding scheme).
Band Main categories of need
A Critical medical/welfare award
Downsizing from 3 bedroom or larger social housing property
Nominations from supported housing providers with agreed move-on arrangements
B Serious medical/welfare award
Downsizing from 2 bed social housing property
Accepted homeless cases and some cases where homelessness can be prevented
Overcrowding in social or private rented housing
C Moderate medical/welfare award
‘Prevention’ or ‘Relief’ homeless applicants
Homeless households not in ‘priority need’
People sharing facilities with other households or lacking facilities
D Applicants whose needs have been assessed as having a higher need but whose
application has been given reduced preference. Examples include people with no local
connection and households with a poor tenancy history (e.g. arrears, current or previous
eviction action)
E People with no immediate need to move
F Applicants registering for schemes where qualification is based on an assessment of care
needs (such as ‘Extra Care’ or ‘Very sheltered’ housing schemes).
5. Total number of properties let in 2019/20 made through Gateway to Homechoice split by the band
awarded to the applicant
Band F, 2%
Band D, 2%
Band E, 9% Band A, 13%
Band C, 30%
Band B, 44%
66. Types of applicant
We split applicants into 3 categories: Accepted
Homeless
Homeless applicants , 11%
Households that a local authority has accepted a legal duty
to house. Most will be in temporary accommodation. Transfer,
30%
Transfer Applicants
Council or housing association tenants seeking a move to Direct
another property. applicant,
59%
Direct Applicants
All other applicants. The largest groups are people renting
privately and people living with their family.
We want to house a reasonable balance between these
groups. The scheme is designed to recognise how urgently
people need to move, while meeting our legal duties and
promoting a reasonable flow of properties.
7. Applicants housed in 2019/20 through Gateway to Homechoice split by applicant type
Accepted Homeless Direct applicant Transfer
0% 10% 20% 30% 40% 50% 60% 70% 80% 90% 100%
Babergh District Council 36 217 103
Braintree District Council 41 398 228
Colchester Borough Council 135 343 180
East Suffolk Council 41 638 305
Ipswich Borough Council 146 319 185
Maldon District Council 15 116 20
Mid Suffolk District Council 27 227 120
7Accessibility and adaptations
Some disabled people need a home to have certain features for it to be suitable for them. Most commonly, people have
limited mobility and need a property with level access (such as a bungalow or ground floor flat). It is also relatively
common for people to need a level-access shower. A few people need a property adapted specifically for a wheelchair
user.
We are committed to making sure that adapted homes are offered to people who need the adaptations in the property.
We therefore operate a system where people identify their accessibility needs to us and if a suitable property becomes
vacant, people needing the adaptations are given priority first.
8. Properties let through Gateway to Homechoice in 2019/20 to people with a stated accessibility need
Housed with stated
accessibilty needs,
901
Housed with no
stated accessibility
needs, 2939
Waiting times
The table below shows the typical waiting time (in months) for housing, broken down by the band of the applicant. It is
measured by recording how long people have waited when they are housed.
We have excluded those housed applicants who were awarded a downsizing or armed forces priority as well as those who
were housed in a property requiring a local connection. This is because in all three examples, the waiting times give a false
impression to people using the waiting times as a guide to how quickly they could be housed. The reasons for this are as
follows:
• Many people who are downsizing wait for a suitable property to become available in the area of their choice. Their
waiting times are therefore longer than average.
8• The higher priority for people who have served in the armed forces is given to reduce their waiting time. The scheme
therefore distorts the data for people who have no such priority.
• Housing schemes (mainly in villages) requiring a local connection are often let to people in lower bands and with short
waiting times.
By excluding these types of lettings before taking the average waiting times, we think the results are much more
representative of people’s experience of waiting times. The following data shows the typical waiting times for people by
Local Authority and by Band.
9. Waiting times in months
Band A Band B Band C Overall
4.2
9.0
Babergh 17.2
10.1
5.2
9.7
Braintree 18.8
11.2
7.9
14.1
Colchester 25.3
15.8
6.6
10.6
East Suffolk 12.8
10.0
4.3
10.7
Ipswich 23.2
12.7
4.2
10.1
Maldon 13.7
9.3
5.5
9.2
Mid Suffolk 9.3
8.0
9Household Movement
Households register with the District where they live (or where they want to live if they are from outside the area of the
scheme). Once registered, they can ‘bid’ for housing in any of the 7 local authority areas.
There are some exceptions to this policy. In particular:
• If a Council accepts a homeless duty to an applicant, the applicant will normally be restricted to bidding for housing
in the area of that Council.
• New affordable housing is normally offered on first let to people with a connection to the local authority where it is
built. On some rural sites, where there are s106 agreements, the local connection also applies each time they are re-
let.
Imbalances between inward and outward movement can be controlled by advertising properties as available only for
local residents for a period of time. This can be applied to specific property types, for example to 2 bed houses, so that a
Council can restrict bidding until a better balance is reached.
The following tables show the extent of cross-boundary movement between the local authorities. Some of the people
who move between districts may have a connection (for example through work or family) to the area they move to.
The method of calculating inward/outward migration changed at the end of December 2019 and so we expect reduced
cross boundary movement during 2020/21.
10. The movement of households housed through Gateway to Homechoice in 2019/20
Inward Outward Difference
200
164
150 135
109
100
95
79
66 66
51
50
44 39 40 40
35 31 35
26
15 12 14
0
Babergh Braintree Colchester East Suffolk Ipswich Maldon Mid Suffolk
-50
-70
-100
-124
-150
1011. Ethnic groups housed through Gateway to Homechoice in 2019/20 compared with
overall ethnicity in the Gateway to Homechoice area.
Housed through GTHC GTHC Area Ethnicity Proportions (ONS Census 2011)
100.0%
91.7%
90.0% 86.5%
80.0%
70.0%
60.0%
50.0%
40.0%
30.0%
20.0%
10.0%
2.4%0.9% 2.6%1.6% 4.0%2.8%
1.2%2.0% 0.9%0.4% 0.8%0.5% 0.0%0.1% 1.6% 0%
0.0%
Asian or Asian Black or Black Mixed Other Ethnic Other White White British White Irish White Not Stated
British British Group Irish/Traveller
As above, but with the ‘White British’ ethnic group excluded
Housed through GTHC GTHC Area Ethnicity Proportions (ONS Census 2011)
5%
4%
4%
4%
3% 3%
3%
2%
3%
2%
2%
2% 2%
2%
1%
1% 1% 1%
1%
0% 1%
1%
0% 0% 0%
0%
Asian or Asian Black or Black Mixed Other Ethnic Other White White Irish White Not Stated
British British Group Irish/Traveller
1112. Gateway to Homechoice Armed Forces data.
We give additional priority to people who have served in the armed forces.
When we consider an application from someone who has a history of service, we use the same criteria as when we band
all other applicants. When households bid for a property, the household with a service history automatically comes
above all the people in the same Band. This means they are more likely to be housed than someone who has the same
circumstances but has no history of service.
Local Authority where applicant Households housed with Total households housed
Note: Data in this section was registered Armed Forces priority in through GTHC in 2019/20
refers to the local authority 2019/20
(LA) where the applicant
Babergh District Council 6 356
registered. Because
applicants can move Braintree District Council 18 667
between LAs, totals here are Colchester Borough Council 21 658
likely to differ slightly from East Suffolk Council 17 984
the number of property
Ipswich Borough Council
lettings in each LA in the 16 650
tables at the beginning of Maldon District Council 2 151
this report. Mid Suffolk District Council 9 374
Grand Total
89 3840
Overall % Housed
2% 100%
Local Authority where Active Applicants with Armed Forces Total Active Applicants as at 01.04.19
Applicant was registered Priority as at 01.04.19
Babergh District Council 17 844
Braintree District Council 34 1772
Colchester Borough Council 60 2779
East Suffolk Council 66 3797
Ipswich Borough Council 23 2727
Maldon District Council 14 839
Mid Suffolk District Council 18 658
Grand Total 232 13416
Overall % of Active Applicants 1.73% 100.00%
Priority Type Overall Average Waiting Time in Months to be housed through
GTHC in 2019/20 (exclusions apply – see page 9)
Households housed with Armed Forces Priority 7.0
Households housed with no Armed Forces Priority 11.0
1213. Gateway to Homechoice ‘Active Applicants’ data by band as of 1 April 2020
The number of applicants changes all the time as new people register and households move into accommodation or
do not renew their application. Applicant numbers are therefore a ‘snapshot’ at a particular point in time. All of the
data for the report so far has related to the households that have been housed through the scheme and mainly looks
back at the year from April 2019 to March 2020. The data below relates to people waiting to be housed. The report
from which this was generated was taken on 1st April 2020.
The chart shows the number in each Band, in each local authority.
Band A Band B Band C Band D Band E Band F
Babergh 57 158 179 29 420 1
Braintree 85 242 361 86 994 4
Colchester 80 605 685 174 1211 24
East Suffolk 151 417 815 271 2128 15
Ipswich 112 493 642 201 1279 0
Maldon 55 96 49 626 4
9
Mid Suffolk 25 115 131 27 359 1
1314. Gateway to Homechoice Active Applicants Data as of 1 April 2020 compared to the total number of
properties let in each Local Authority area in 2019/20.
The data below compares the number of registered applicants on 1st April 2020 with the number of lettings
made during the previous financial year 2019/20. The data shows the balance between the number of
households waiting for social housing and the number being housed.
Active applicants Properties let in LA
0 500 1000 1500 2000 2500 3000 3500 4000
844
Babergh
356
1772
Braintree
667
2779
Colchester
658
3797
East Suffolk
984
2727
Ipswich
650
839
Maldon
151
658
Mid Suffolk
374
1415. Comparison of the proportion of new and existing properties let in each Local Authority in 2019/20
The next chart compares lets of new housing with lets of existing properties.
Existing New Build
Babergh 271 85
Braintree 525 142
Colchester 526 132
East Suffolk 790 194
Ipswich 626 24
Maldon 74 77
Mid Suffolk 303 71
1516. The proportion of lets made in the Gateway to Homechoice area in 2019/20 split by the number of
bedrooms in the property and the primary applicant’s age group
The data shows the correlation between the age of the main applicant and the size of property let to them. This
information can be helpful when planning what sizes of properties to build to meet future demand.
1 Bed 2 Bed 3 Bed 4 Bed
16 - 25 220 508 36
26 - 35 205 515 334 23
36 - 45 170 249 187 24
46 - 55 227 162 63 3
56 - 65 329 122 81
66 - 75 188 86 1
76 + 143 34
1 Bed 2 Bed 3 Bed 4 Bed
1200 23
1000
334
800
36 24
600
8
187
508 515
400 63 122 1
249 162
200 86
329 34
220 205 170 227 188 143
0
16 - 25 26 - 35 36 - 45 46 - 55 56 - 65 66 - 75 76 +
There were also 2 x 5 bedroomed properties let; one to an applicant in the 26 - 35 age group and one to the
36 - 45 age group.
1617. The proportion of lets made in the Gateway to Homechoice area in 2019/20 split by the type of property
let
The “Specialist Older Person” category mainly comprises flats in sheltered housing schemes but also includes those
properties let that are part of or are linked to sheltered schemes. It is quite common for a few bungalows to be linked to
a neighbouring sheltered housing scheme and for the purposes of the graph below, they are included in the ‘specialist
older person’ category. The “Bungalow” category in the chart therefore only includes those bungalows let that are not
linked to a sheltered scheme.
Bungalow Flat House Specialist Older Person
Babergh 41 109 130 76
Braintree 3 253 257 154
Colchester 9 390 178 81
East Suffolk 181 388 347 68
Ipswich 21 393 160 76
Maldon 4 59 72 16
Mid Suffolk 22 83 135 134
Future Data Requests
If there is something you would like to see reported on now or in the future, please contact the Gateway to Homechoice
co-ordinator, Claire Beckett claire.beckett@cbhomes.org.uk
17You can also read