Rightmove House Price Index - The largest monthly sample of residential property prices
←
→
Page content transcription
If your browser does not render page correctly, please read the page content below
Rightmove
House Price Index
The largest monthly sample of
residential property prices

   January 2018
  National edition

   Copyright © 2018, Rightmove plc. Released 15th January. For media enquiries and interviews please contact
   the Rightmove press office: T | 020 7087 0605 M | 07894 255295 or E | amy.funston@rightmove.co.uk

Busy start to 2018 with increased home-hunter activity
• Early traffic data indicates a busy start to 2018, with Rightmove visits up by an average of over
  9% so far in January compared to same period last year1, averaging over 4 million visits per day
• Average price of property coming to market is up 0.7% (+£2,067) this month on Rightmove,
  tracking over 90% of the UK property market, similar to the 0.6% rise at this time a year ago
  with virtually identical number of properties coming to market
• To have the best chance of a successful sale this year, sellers should note:
    o Buyers are still price-sensitive with sales agreed numbers in the last quarter of 2017 down
       5.5% on the same period a year ago
    o Sellers of properties suitable for first-time buyers set to have greatest chance of sales
       success following last Autumn’s stamp duty saving boost

                                                             National average asking prices
          Month                          Avg. asking price                   Monthly change                       Annual change        Index
       January 2018                           £297,587                              +0.7%                                  +1.1%      230.1
      December 2017                           £295,520                              -2.3%                                  +1.0%      228.5

                       National average asking prices by market sector (excluding Inner London)
          Sector                           January 2018                      December 2017                       Monthly change    Annual change

     First-time buyers                        £188,024                            £185,926                                 +1.1%      +1.9%

     Second-steppers                          £266,380                            £265,303                                 +0.4%      +3.2%

     Top of the ladder                        £519,852                            £515,741                                 +0.8%      +0.2%

    Monthly asking price trend

    £320,000

    £315,000

    £310,000

    £305,000

    £300,000

    £295,000

    £290,000

    £285,000

    £280,000
                  Jan-17 Feb-17 Mar-17 Apr-17 May-17 Jun-17 Jul-17 Aug-17 Sep-17 Oct-17 Nov-17 Dec-17 Jan-18

    Rightmove measured 63,365 asking prices this month, circa 90% of the UK market. The properties were put on sale
    by estate agents from 3rd December 2017 to 6th January 2018 and advertised on Rightmove.co.uk.

2              Copyright © 2018, Rightmove plc. Released 15th January. For media enquiries and interviews please contact
               the Rightmove press office: T | 020 7087 0605 M | 07894 255295 or E | amy.funston@rightmove.co.uk
Overview
Early indicators of activity in this year’s housing market show that demand remains robust, and most of
the key metrics are broadly consistent with the same period last year. Demand as evidenced by visits to
Rightmove shows the average so far in January is currently running over 9% higher than the same period
a year ago, with an average of over 4 million visits each day. The rate of increase in the price of property
coming to market is consistent with last year, up by 0.7% (+£2,067) this month versus +0.6% in the same
period 12 months ago. In spite of the high level of home-hunter visits as we start 2018, sellers should note
that buyers are still being very choosy, as shown by the number of sales agreed in the last quarter of 2017
being lower than a year ago in all regions.
Miles Shipside, Rightmove director and housing market analyst comments: “Considering some of the
gales that buffeted the market in the latter part of 2017, these early readings for 2018 show that there is
currently a good following wind of search activity. To keep this year’s initial buyer momentum with you
rather than against, serious sellers should note that all regions are currently selling at a slower rate than a
year ago, indicating choosier buyers. The total number of sales agreed was 5.5% down in the last quarter
of 2017 compared with the same period in 2016. Setting tempting asking prices and then quickly reducing
them if there is little initial interest will be key to turning this promising level of buyer activity into actual
sales, especially in the less active sectors and locations of the UK.”
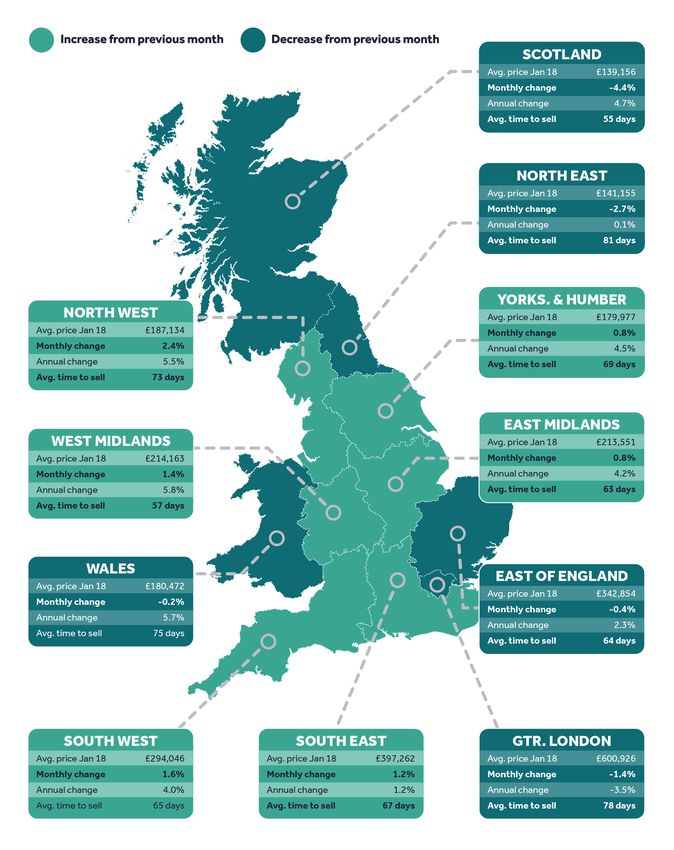
The annual rate of price increase in newly-marketed property is 1.1%, although at a more local level prices
are running 4-6% up in some regions, with only London (-3.5%) recording a year-on-year fall. While the
0.7% increase in asking prices of property coming to market this month is very similar to the 0.6% of the
same period a year ago, both years are well behind the average monthly rise of 1.9% seen at this time of
year in the faster-rising markets from 2013 to 2016. However, the current market’s negative price factors
of stretched buyer affordability and uncertain political outlook are counter-balanced to a degree by tight
supply of suitable properties for sale and the recent near-abolition of stamp duty for first-time buyers.
There is no increase in choice for buyers, with average overall stock per estate agency branch holding
steady at 42 properties, the same as a year ago.
Shipside adds: “There is no sign so far of any rush to come to market and try to sell, with the number of
new-to-the-market properties holding steady against the same period a year ago at around 63,000. With
no increase in fresh supply, and an overall average of 40% of properties on agents’ books already sold
subject to contract, would-be buyers in some sectors and locations of the UK are seeing less choice to
tempt them, fuelling some localised price rises. While potential buyers are still busy looking, they are
looking for good value and the right property . Price rises have had a good run and the return of the days of
optimistic pricing is consequently some years away and contingent upon earnings increasing and interest
rates remaining low. Sellers should get good local advice to ensure that their property price and
presentation are suitable for their local market conditions.”
The boost given to first-time buyers by the abolition of stamp duty for most of their purchases means that
properties in that sector are facing higher demand and consequently more upwards price pressure,
especially if supply is limited. Indeed their typical target sector of two bedrooms and fewer has seen the
biggest rise of 1.1% in the last month, ahead of second-stepper properties at 0.4% and top of the ladder
at 0.8%.
Shipside predicts: “Those selling to ‘quick-off-the-block stamp-duty-saving first-time buyers’ are set to
have a busier first quarter than those trying to sell in other sectors. We expect that many first-time buyers
will act fast to satisfy their appetite to get onto the housing ladder and secure their property at today’s
prices, before any stamp duty savings are eaten up by rising property prices.”
”Setting tempting asking prices and then quickly reducing them if there is little
initial interest will be key to turning this promising level of buyer activity into
actual sales, especially in the less active sectors and locations of the UK.”
Miles Shipside, Rightmove director and housing market analyst
3 Copyright © 2018, Rightmove plc. Released 15th January. For media enquiries and interviews please contact
the Rightmove press office: T | 020 7087 0605 M | 07894 255295 or E | amy.funston@rightmove.co.ukAgent’s view
Chris Chapman, Divisional Managing Director of Estate Agency at Andrews, comments: “Our sales data so
far this year suggests a strong return to house buying activity particularly evident across our network in
Oxfordshire and the South West where buyers are showing significant interest in three- and four-
bedroom family homes. Of course, the Chancellor’s recent announcement that Stamp Duty would be
removed for first time buyers of properties of up to £300,000, or on the first £300,000 of higher value
properties up to £500,000, is the focus of much attention in terms of the impact that it’s having on the
market. Whilst it hasn’t, in our experience, resulted in a huge spike of first-time buyers entering the
market, it has certainly created increased interest from purchasers who had previously felt unable to take
the first step on to the property ladder.”
4 Copyright © 2018, Rightmove plc. Released 15th January. For media enquiries and interviews please contact
the Rightmove press office: T | 020 7087 0605 M | 07894 255295 or E | amy.funston@rightmove.co.ukAverage time to sell and stock
Average 'time to sell' (no. of days) - National
80
75 73
70 68
67
65
65 62
60
59
60 58
57
55 55 55
54
55
50
45
40
Dec-16 Jan-17 Feb-17 Mar-17 Apr-17 May-17 Jun-17 Jul-17 Aug-17 Sep-17 Oct-17 Nov-17 Dec-17
Average stock per agent (including Under Offer/Sold STC)
60
49 50 50 50 49 48
50 47 47
45
42 43 43 42
40
30
20
10
0
Jan-17 Feb-17 Mar-17 Apr-17 May-17 Jun-17 Jul-17 Aug-17 Sep-17 Oct-17 Nov-17 Dec-17 Jan-18
5 Copyright © 2018, Rightmove plc. Released 15th January. For media enquiries and interviews please contact
the Rightmove press office: T | 020 7087 0605 M | 07894 255295 or E | amy.funston@rightmove.co.ukAsking price trends
Five year asking price trend
£320,000
£310,000
£300,000
£290,000
£280,000
£270,000
£260,000
£250,000
£240,000
£230,000
£220,000
Jan-13 Jul-13 Jan-14 Jul-14 Jan-15 Jul-15 Jan-16 Jul-16 Jan-17 Jul-17 Jan-18
% monthly change in average asking prices
2.0%
1.5% 1.2% 1.3%
0.9% 0.9%
1.0%
0.6% 0.6% 0.7%
0.4%
0.5% 0.3%
0.0%
-0.5% -0.2%
-1.0% -0.6%
-1.5%
-2.0%
-2.5%
-2.1%
-2.3%
-3.0%
Jan-17 Feb-17 Mar-17 Apr-17 May-17 Jun-17 Jul-17 Aug-17 Sep-17 Oct-17 Nov-17 Dec-17 Jan-18
6 Copyright © 2018, Rightmove plc. Released 15th January. For media enquiries and interviews please contact
the Rightmove press office: T | 020 7087 0605 M | 07894 255295 or E | amy.funston@rightmove.co.ukRegional trends
7 Copyright © 2018, Rightmove plc. Released 15th January. For media enquiries and interviews please contact
the Rightmove press office: T | 020 7087 0605 M | 07894 255295 or E | amy.funston@rightmove.co.ukLondon trends
Avg. price Avg. price Monthly Avg. price Annual
Transport for London zones
Jan 2018 Dec 2017 change Jan 2017 change
Zone 1 £1,295,435 £1,248,932 3.7% £1,293,729 0.1%
Zone 2 £704,591 £732,673 -3.8% £752,515 -6.4%
Zone 3 £564,050 £583,360 -3.3% £611,210 -7.7%
Zone 4 £473,576 £474,647 -0.2% £469,725 0.8%
Zone 5 £465,450 £470,650 -1.1% £468,817 -0.7%
Zone 6 £490,463 £482,234 1.7% £479,599 2.3%
Average 'time to sell' (no. of days) - London
80 78
75 73
71
70 66
68 67
64 64
65 63
61
59 59 59
60
55
50
45
40
Dec-16 Jan-17 Feb-17 Mar-17 Apr-17 May-17 Jun-17 Jul-17 Aug-17 Sep-17 Oct-17 Nov-17 Dec-17
8 Copyright © 2018, Rightmove plc. Released 15th January. For media enquiries and interviews please contact
the Rightmove press office: T | 020 7087 0605 M | 07894 255295 or E | amy.funston@rightmove.co.ukEditor’s notes
1 Based on 1st – 10th January.
About the Index:
The Rightmove House Price Index methodology has been updated as of January 2018. The report now includes data
for Scotland and a number of measures have been refined. The stock per agent figure now calculates the average
based on the number of properties an agent has on Rightmove each day across the month, rather than the average of
the total number of properties each agent advertised in the month. London asking prices are now broken down into
travel zones. For the purpose of historical comparisons, the historical figures have been restated based on the new
methodology.
The Index includes asking price breakdowns in the housing market to offer trends at three different sectors of the
market: first-time buyer, second-stepper and top of the ladder. Inner London prices have been excluded from this
categorisation as the normal housing ladder is not really applicable.
Advertising property for over 90% of all UK estate agents, Rightmove is in a unique position to identify any immediate
changes in the market. Rightmove’s House Price Index is compiled from the asking prices of properties coming onto
the market via over 13,000 estate agency branches listing on Rightmove.co.uk. Rather than being a survey of opinions
as with some other indices, it is produced from factual data of actual asking prices of properties currently on the
market. The sample includes up to 200,000 homes each month – representing circa 90% of the market, the largest and
most up-to-date monthly sample of any house price indicator in the UK. The Index differs from other house price
indicators in that it reflects asking prices when properties first come onto the market, rather than those recorded by
lenders during the mortgage application process or final sales prices reported to the Land Registry. In essence,
Rightmove’s Index measures prices at the very beginning of the home buying and selling process while other indices
measure prices at points later in the process. Having a large sample size and being very up-to-date, the Rightmove
Index has established itself as a reliable indicator of current and future trends in the housing market.
Rightmove measured 63,365 asking prices this month. The properties were put on sale by estate agents from 3rd
December 2017 to 6th January 2018 and advertised on Rightmove.co.uk.
Market sectors explained:
First-time buyer: This figure represents the typical property a first-time buyer would purchase, covering all two bed
properties and smaller that come to market (houses and flats).
Second-stepper: This figure represents the typical property of a person moving from their first home, covering all
three and four bed properties that come to market (houses and flats) excluding four bed detached houses.
Top of the ladder: This figure represents asking prices at the top end of the market, covering all five bed properties
and above (houses and flats), as well as four bed detached houses.
About Rightmove.co.uk:
Rightmove.co.uk is the UK’s leading property website, displaying details of homes for sale or rent to the largest online
audience. It is consistently ranked the number one property website in the UK (source: Experian Hitwise). It has circa
90% of all properties for sale and at any time displays a stock of over one million properties to buy or rent. The
Rightmove.co.uk site attracts over 130 million visits from home movers each month with time on site averaging over
one billion minutes per month (Rightmove data, July 2017).
9 Copyright © 2018, Rightmove plc. Released 15th January. For media enquiries and interviews please contact
the Rightmove press office: T | 020 7087 0605 M | 07894 255295 or E | amy.funston@rightmove.co.ukYou can also read