Rightmove House Price Index - The largest monthly sample of residential property prices
←
→
Page content transcription
If your browser does not render page correctly, please read the page content below
Rightmove
House Price Index
The largest monthly sample of
residential property prices

  December 2019
  National edition

   Copyright © 2019, Rightmove plc. Released 16th December. For media enquiries and interviews please
   contact the Rightmove press office: T | 020 7087 0605 M | 07894 255295 or E | amy.murphy@rightmove.co.uk

Under embargo for 00.01 hours, Monday 16 th December 2019

     2020 forecast of 2% price rise as election gives window of certainty

• Rightmove predicts 2% rise in price of property coming to market in 2020 as majority government gives
  home-movers a window of certainty for an active spring moving season
• Demand for property remains resilient as we move into 2020, though lack of supply is a concern:
    • The monthly decrease (-0.9%) is the smallest at this time of year since December 2006, showing that
      sellers and their agents think that demand is strong
    • Demand outstripping supply: number of sales agreed so far in 2019 down by just 3% on 2018, while
      number of properties coming to market down by 8%
    • Fundamentals remain sound with low interest rates, lenders competing to lend, high employment, and
      wage growth helping buyer affordability

                                                               National average asking prices
               Month                    Avg. asking price                  Monthly change                      Annual change       Index
          December 2019                      £300,025                              -0.9%                               0.8%        231.9
          November 2019                      £302,808                              -1.3%                               0.3%        234.1
                             National average asking prices by market sector (excluding Inner London)
               Sector                   December 2019                      November 2019                      Monthly change   Annual change
          First-time buyers                  £190,009                           £191,001                              -0.5%        0.9%
      Second-steppers                        £271,394                           £273,291                              -0.7%        1.3%
          Top of the ladder                  £522,095                           £525,633                              -0.7%        1.4%

      Monthly asking price trend

      £320,000

      £315,000

      £310,000

      £305,000

      £300,000

      £295,000

      £290,000

      £285,000

           Rightmove measured 68,152 asking prices this month, circa 95% of the UK market. The properties were put on sale
           by estate agents from 10th November 2019 to 7th December 2019 and advertised on Rightmove.co.uk.

      2
                 Copyright © 2019, Rightmove plc. Released 16th December. For media enquiries and interviews please
                 contact the Rightmove press office: T | 020 7087 0605 M | 07894 255295 or E | amy.murphy@rightmove.co.uk
2020 forecast:
Rightmove predicts that the price of property coming to market in Britain will rise by 2% in 2020. Home-
mover confidence and activity have been dogged by political uncertainty since the 2016 referendum.
With a clear majority in the election, there is now an opportunity to release some of the pent-up
demand in the spring, and for some modest upwards price movement. Sellers’ pricing power will be
enhanced by a lack of choice for potential buyers, with the proportion of estate agent stock that is
available for purchase at its lowest for over two years.
Miles Shipside, Rightmove director and housing market analyst comments: “The greater certainty
afforded by a majority government gives an opportunity for a more active spring moving season, with
some release of several years of pent-up demand. Given the Brexit track record to date, further political
twists and turns should not be ruled out, though with a large majority there is a higher possibility of an
end to the series of Brexit deadlines, and the prospect of an orderly resolution. Rightmove measures
the prices of 95% of property coming to market, and we predict that buyers and sellers will on average
see a 2% rise in those prices by the end of 2020. While this is over twice the current annual rate of 0.8%,
it’s still a relatively marginal increase as it’s a price-sensitive market. There will be regional variations.
London is finally showing tentative signs of bottoming out, and we expect a more modest price rise of
+1% in all of the southern regions where buyer affordability remains most stretched. In contrast, the
largest increases will be in the more northerly regions, repeating the pattern of 2019 with increases in
the range of 2% to 4%.”
2020 demand and supply indicators:
Demand has shown remarkable resilience in the face of the uncertain outlook and various disruptive
Brexit deadlines since the 2016 referendum. One year ago we forecast that there would on average be
no upwards price movement, with 2019 seeing a subdued 0% price change given the uncertain outlook
and stretched buyer affordability. 2019’s annual rise stands marginally above our forecast at 0.8%, with
a stronger than anticipated end to the year. This month’s 0.9% fall is the smallest at this time of year
since December 2006. Prices are being under-pinned and pushed upwards by demand outstripping
supply. Demand from buyers has remained almost level, with the number of sales agreed so far in 2019
down by just 3% on 2018 despite the political uncertainty. In contrast, the number of properties coming
to market is down by 8%.
Shipside observes: “With much of the political uncertainty removed, we expect that the number of
properties for sale will recover as more new sellers come to market, making up some of this year’s lost
ground. However, property supply is still limited, with estate agents having the lowest proportion of
properties available for sale in two years, and this will fuel modest gains in the national average asking
price of property coming to market. The fundamentals remain sound with low interest rates, lenders
competing to lend, high employment, and average wage growth outstripping house price growth and
helping buyer affordability. The statistics for 2019 encouragingly show that the ‘have-to’ and ‘life-
stage’ markets have been carrying on, and we hope that the more certain outlook would encourage
many would-be discretionary movers to finally get off the fence.”
But 2020’s housing market will still fall short of capacity, and the factors to allow it to return to full health
will only be in place when Brexit is well in the past. The final deal with the EU and trade deals with many
other countries are still to be negotiated, and Brexit will continue to dominate the political agenda. In
addition, the main driver of a healthy sustainable market is steadily improving affordability and while this
is moving slightly in the right direction, more needs to be done to help aspiring first-time buyers.
Shipside adds: “First-time buyers are the drivers of the market. Too many are struggling to save the
necessary deposits, and not all of them want to buy a new-build home through Help To Buy. More ways
of getting more people onto the ladder would help to limit rising rents, increase liquidity and transaction
numbers in the housing market, and make the dreams of their own roofs above their heads a reality for
many more of the younger generation.”
Miles Shipside, Rightmove director and housing market analyst says: “The greater certainty afforded by a
majority government gives an opportunity for a more active spring moving season, with some release of
several years of pent-up demand. Given the Brexit track record to date, further political twists and turns
should not be ruled out, though with a large majority there is a higher possibility of an end to the series of
Brexit deadlines, and the prospect of an orderly resolution.”
3
Copyright © 2019, Rightmove plc. Released 16th December. For media enquiries and interviews please
contact the Rightmove press office: T | 020 7087 0605 M | 07894 255295 or E | amy.murphy@rightmove.co.ukAsking price trends
Five year asking price trend
£320,000
£310,000
£300,000
£290,000
£280,000
£270,000
£260,000
£250,000
£240,000
£230,000
£220,000
Dec-14 Jun-15 Dec-15 Jun-16 Dec-16 Jun-17 Dec-17 Jun-18 Dec-18 Jun-19 Dec-19
% monthly change in average asking prices
1.5%
1.1%
1.0%
0.9%
0.7%
0.6%
0.4% 0.4%
0.5% 0.3%
0.0%
-0.5%
-0.2% -0.2%
-1.0%
-0.9%
-1.0%
-1.5% -1.3%
-1.5%
-2.0%
Dec-18 Jan-19 Feb-19 Mar-19 Apr-19 May-19 Jun-19 Jul-19 Aug-19 Sep-19 Oct-19 Nov-19 Dec-19
4
Copyright © 2019, Rightmove plc. Released 16th December. For media enquiries and interviews please
contact the Rightmove press office: T | 020 7087 0605 M | 07894 255295 or E | amy.murphy@rightmove.co.ukAverage time to sell and stock
Average 'time to secure a buyer' (no. of days) - National
85
80 77
75
71
70
70 67 67
65
64 64
65 63
62 62 62 62
60
55
50
45
40
Average stock per agent (including Under Offer/Sold STC)
60.0
53.3 54.4 53.9 53.6
51.9 52.8
50.2 49.7 50.2
50.0 47.8
45.9 46.3
44.8
40.0
30.0
20.0
10.0
0.0
Nov-18 Dec-18 Jan-19 Feb-19 Mar-19 Apr-19 May-19 Jun-19 Jul-19 Aug-19 Sep-19 Oct-19 Nov-19
5
Copyright © 2019, Rightmove plc. Released 16th December. For media enquiries and interviews please
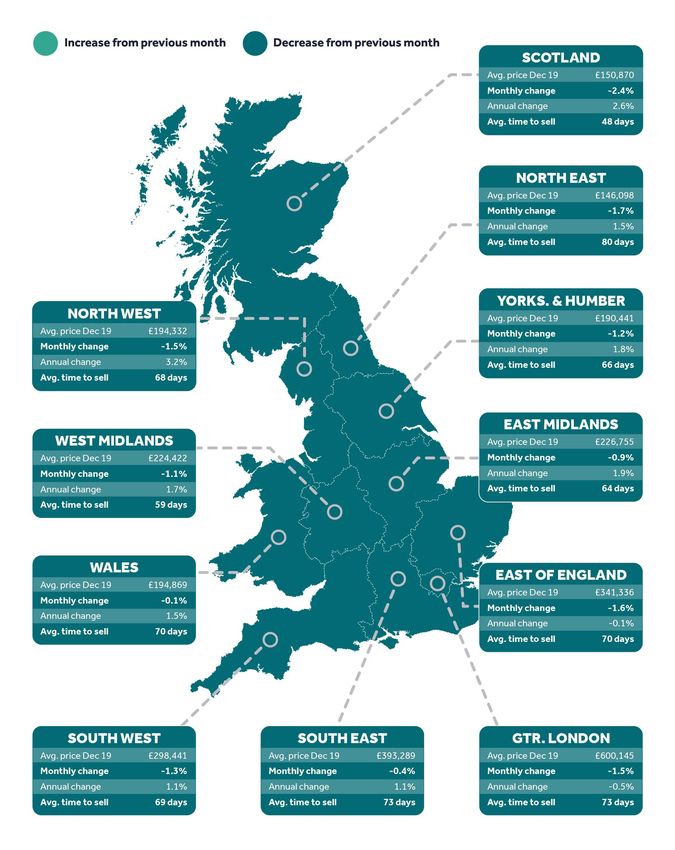
contact the Rightmove press office: T | 020 7087 0605 M | 07894 255295 or E | amy.murphy@rightmove.co.ukRegional trends
6
Copyright © 2019, Rightmove plc. Released 16th December. For media enquiries and interviews please
contact the Rightmove press office: T | 020 7087 0605 M | 07894 255295 or E | amy.murphy@rightmove.co.ukLondon trends
Average 'time to secure a buyer' (no. of days) - London
100
95
89
90
85 82 82
80 78
76
74 73
75 72
68 69 69 69
70 67
65
60
55
50
7
Copyright © 2019, Rightmove plc. Released 16th December. For media enquiries and interviews please
contact the Rightmove press office: T | 020 7087 0605 M | 07894 255295 or E | amy.murphy@rightmove.co.ukLondon trends
Borough data is based on a three-month rolling average and can be used as an indicator of overall
price trends in each borough over time. It is not directly comparable with the overall London
monthly figures.
Avg. price
Borough Monthly change Annual change
December 2019
Tower Hamlets £591,345 -0.2% 1.9%
Barnet £638,500 0.9% 1.3%
Merton £622,298 -0.1% 1.3%
Sutton £461,098 -1.4% 1.3%
Bexley £409,960 -0.3% 1.2%
Hounslow £523,627 -0.5% 1.2%
Barking and Dagenham £315,518 0.3% 0.9%
Lambeth £627,984 2.5% 0.8%
Islington £754,372 0.5% 0.5%
Hackney £622,668 -1.4% 0.3%
Waltham Forest £479,265 -1.4% 0.3%
Southwark £648,429 -1.7% 0.2%
Havering £406,811 -0.7% 0.0%
Lewisham £458,030 0.6% -0.1%
Ealing £545,541 0.2% -0.1%
Greenwich £433,363 -0.4% -0.2%
Bromley £534,129 -0.1% -0.5%
Croydon £427,384 -0.5% -0.7%
Harrow £545,773 -0.8% -0.9%
Redbridge £451,667 -1.3% -1.1%
Newham £411,173 -0.4% -1.1%
Haringey £587,673 -0.7% -1.8%
Richmond upon Thames £807,390 0.6% -2.2%
Westminster £1,421,352 0.6% -2.4%
Hillingdon £479,907 -1.6% -2.6%
Camden £983,639 2.3% -2.7%
Kingston upon Thames £584,967 1.0% -2.9%
Enfield £442,957 0.4% -2.9%
Wandsworth £758,267 0.0% -3.0%
Kensington and Chelsea £1,559,818 -0.7% -3.3%
Hammersmith and Fulham £914,660 -0.7% -3.6%
Brent £552,496 -0.1% -4.2%
8
Copyright © 2019, Rightmove plc. Released 16th December. For media enquiries and interviews please
contact the Rightmove press office: T | 020 7087 0605 M | 07894 255295 or E | amy.murphy@rightmove.co.ukEditor’s notes
About the Index:
The Rightmove House Price Index methodology was updated in January 2018. The report now includes data for
Scotland and a number of measures have been refined. The stock per agent figure now calculates the average based
on the number of properties an agent has on Rightmove each day across the month, rather than the average of the
total number of properties each agent advertised in the month. London asking prices are now broken down into travel
zones. For the purpose of historical comparisons, the historical figures have been restated based on the new
methodology.
The Index includes asking price breakdowns in the housing market to offer trends at three different sectors of the
market: first-time buyer, second-stepper and top of the ladder. Inner London prices have been excluded from this
categorisation as the normal housing ladder is not really applicable.
Advertising property for over 90% of all UK estate agents, Rightmove is in a unique position to identify any immediate
changes in the market. Rightmove’s House Price Index is compiled from the asking prices of properties coming onto
the market via over 13,000 estate agency branches listing on Rightmove.co.uk. Rather than being a survey of opinions
as with some other indices, it is produced from factual data of actual asking prices of properties currently on the
market. The sample includes up to 200,000 homes each month – representing circa 95% of the market, the largest and
most up-to-date monthly sample of any house price indicator in the UK. The Index differs from other house price
indicators in that it reflects asking prices when properties first come onto the market, rather than those recorded by
lenders during the mortgage application process or final sales prices reported to the Land Registry. In essence,
Rightmove’s Index measures prices at the very beginning of the home buying and selling process while other indices
measure prices at points later in the process. Having a large sample size and being very up-to-date, the Rightmove
Index has established itself as a reliable indicator of current and future trends in the housing market.
Rightmove measured 68,152 asking prices this month, circa 95% of the UK market. The properties were put on sale by
estate agents from 10th November 2019 to 7th December 2019 and advertised on Rightmove.co.uk.
Market sectors explained:
First-time buyer: This figure represents the typical property a first-time buyer would purchase, covering all two bed
properties and smaller that come to market (houses and flats).
Second-stepper: This figure represents the typical property of a person moving from their first home, covering all
three and four bed properties that come to market (houses and flats) excluding four bed detached houses.
Top of the ladder: This figure represents asking prices at the top end of the market, covering all five bed properties
and above (houses and flats), as well as four bed detached houses.
About Rightmove.co.uk:
Rightmove.co.uk is the UK’s leading property website, displaying details of homes for sale or rent to the largest online
audience. It is consistently ranked the number one property website in the UK (source: Experian Hitwise). It has circa
95% of all properties for sale and at any time displays a stock of over one million properties to buy or rent. The
Rightmove.co.uk site attracts nearly 141 million visits from home movers each month with time on site averaging 1.1
billion minutes per month (Rightmove data, July 2019).
9
Copyright © 2019, Rightmove plc. Released 16th December. For media enquiries and interviews please
contact the Rightmove press office: T | 020 7087 0605 M | 07894 255295 or E | amy.murphy@rightmove.co.ukYou can also read