2019 INDUSTRIAL MARKET STATISTICS 2020 TRENDS & PROJECTIONS - CBRE METRO VANCOUVER INDUSTRIAL TEAM
←
→
Page content transcription
If your browser does not render page correctly, please read the page content below
2019
            INDUSTRIAL MARKET STATISTICS
            2020 TRENDS & PROJECTIONS
            CBRE METRO VANCOUVER INDUSTRIAL TEAM

2019 INDUSTRIAL MARKET STATISTICS | 2020 TRENDS & PROJECTIONS   |1
VACANCY & ABSORPTION FORECAST
Inventory (Sq. Ft.) Vacancy (%)
Inventory (Sq. Ft.) Vacancy (%)
7,000,000 7.0%
7,000,000 7.0%
FORECAST
6,000,000 6.0%
6,000,000 6.0%
5,000,000 5.0%
5,000,000 5.0%
4,000,000 4.0%
4,000,000 4.0%
3,000,000 3.0%
3,000,000 3.0%
2,000,000 2.0%
2,000,000 2.0%
1,000,000 1.0%
1,000,000 1.0%
0 0.0%
0 0.0%
-1,000,000 -1.0%
-1,000,000 2009 2010 2011 2012 2013 2014 2015 2016 2017 2018 2019 2020F -1.0%
Absorption (SF)
2009 New Supply2011
2010 (SF) Vacancy
2012 (%)2013 "No Absorption"
2014 Forecast
2015 "Mid Absorption"
2016 2017 Forecast
2018 "High
2019 Absorption"
2020FForecast
Absorption (SF) New Supply (SF) Vacancy (%) "No Absorption" Forecast "Mid Absorption" Forecast "High Absorption" Forecast
Source: CBRE Research, Q4 2019
VACANCY ABSORPTION
The industrial market outperformed the projections from Total absorption in Metro Vancouver ended with
a year ago hitting a new historic low of 1.2% 4.39 MSF in 2019, above the 5-year average of
The current rate amounts to only 2,369,587 SF of 4.02 MSF. Significant build to suits from BMW and
vacant space in Metro Vancouver including Abbotsford Euro Asia Inc. helped beat the average and this will
and TFN be the case for 2020 with major build to suit projects
scheduled to complete for Sobey’s and Saputo
The municipalities of Richmond, Tri-Cities, Delta and
North Vancouver have the lowest vacancy rates with For the second year in a row Delta led Metro Vancouver
next to no industrial inventory and a below-market with the highest absorption at 1.13 MSF, followed by
vacancy rate of 1% Richmond (940 KSF) and Surrey (817 KSF). Surrey led
the market in new supply adding 1.4 MSF into inventory
Vancouver is among the tightest markets in North
followed by Delta (1 MSF) and Abbotsford (621 KSF)
America, second behind Toronto at number one and
just ahead of third place Los Angeles With ongoing demand and supply imbalance we project
positive absorption higher than in 2019 at 4.6 MSF to
Strong demand and lack of supply will keep the industrial 5 MSF. Development activity is near record levels with
sector resilient to other economic factors throughout 5.9 MSF under construction; however, with over 50%
2020. We project the vacancy rate to stay at the same already preleased or presold we anticipate little relief
level or increase slightly to 1.5% in the coming year
2019 INDUSTRIAL MARKET STATISTICS | 2020 TRENDS & PROJECTIONS |2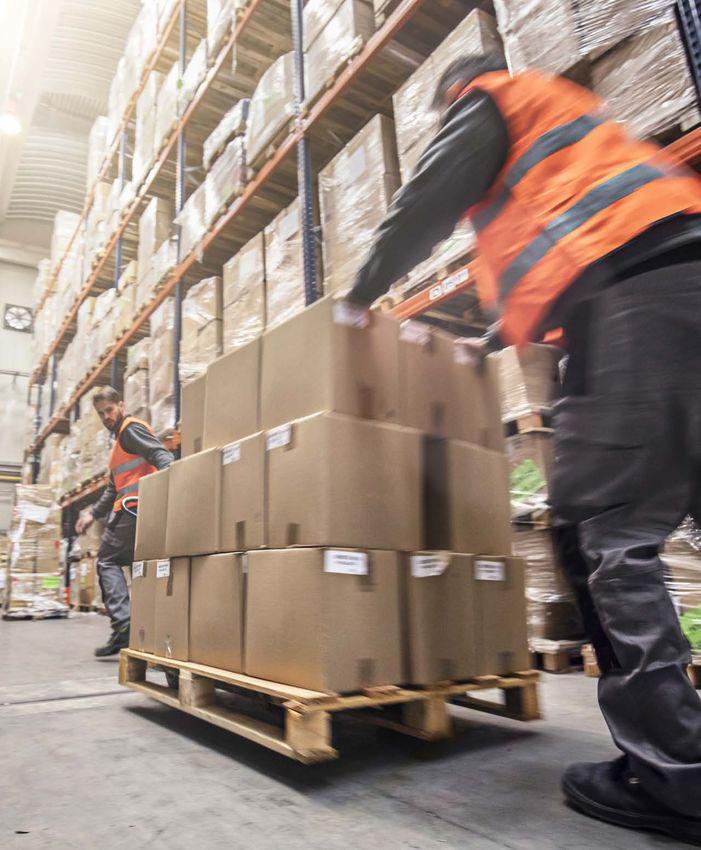
VACANCY & ABSORPTION FORECAST
AVERAGE ASKING RATE VS VACANCY & AVAILABILITY RATE
Average Asking Rate ($ per Sq. Ft.) Rate (%)
$14.00 9.0%
FORECAST
$13.00 8.0%
$12.00 7.0%
$11.00 6.0%
$10.00 5.0%
$9.00 4.0%
$8.00 3.0%
$7.00 2.0%
$6.00 1.0%
$5.00 0.0%
2008 2009 2010 2011 2012 2013 2014 2015 2016 2017 2018 2019 2020
Average Asking Rate Availability Rate Vacancy Rate
Source: CBRE Research, Q4 2019
AVERAGE ASKING RATES
The year-end average asking rate for Metro Vancouver
was $13.15 PSF up 10.9% YOY, the 3rd consecutive
increase YOY above 10%. This was 5% YOY lower than
the growth experienced in 2018 and 2017
The most significant increases in the average asking
rates were seen in Richmond (25%), Abbotsford (22%)
and Surrey (14%)
Persistent low vacancy will continue to drive rental
growth in 2020. We forecast rental growth stabilizing
around 7% to 9% for the year
When we look at Metro Vancouver in context of the
West Coast and major industrial markets, it is lower
than the average rental rates in Los Angeles ($14.50
CAD), Oakland ($16.07 CAD), San Diego ($15.74 CAD)
and just ahead of Seattle ($12.00 CAD)
2019 INDUSTRIAL MARKET STATISTICS | 2020 TRENDS & PROJECTIONS |3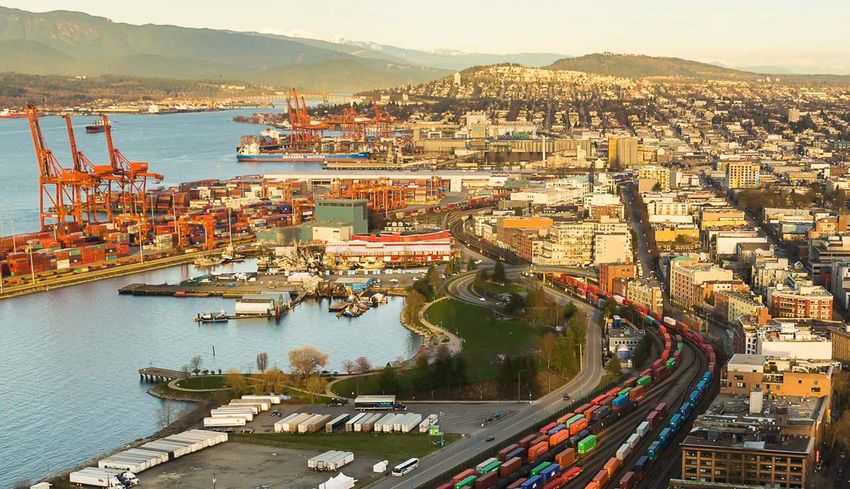
OCCUPIER DEMAND
2019 saw continued strong demand from large format occupiers. There were 17 lease
transactions over 100 KSF, 7 more than in 2018
Food & Beverage (2.6%) saw a significant decline after leading the way in 2018 (27.2%).
This segment of the market will rebound as significant developments are underway led
by Walmart in South Surrey
Heading into 2020 the demand is led again by 3PL and Warehouse & Distribution.
This is mostly due to growth in e-commerce, and activity form the Port of Vancouver
and the Vancouver airport
E-commerce accounts for just over 10% of all retail sales in Canada, with a projected
growth of 3% by end of year
Amazon is still the most active occupier in our market, and with their current requirements
will increase their existing footprint significantly in 2020/2021. In many West Coast
markets Amazon accounts for half of all active requirements
35.1% 34.5%
Warehousing & 2019 3rd Party Logistics
Distribution TOP VANCOUVER
INDUSTRIAL
TRANSACTIONS
2.6%
Food & Beverage 13.8%
6.6% Manufacturing & Distribution
Film Related
7.4%
Aerospace
2019 INDUSTRIAL MARKET STATISTICS | 2020 TRENDS & PROJECTIONS |4
SIGNIFICANT NEW SUPPLY - 2020
          Q1
         CAMPBELL HEIGHTS NORTH             CEDAR COAST SOUTH SURREY
         BUSINESS PARK                      SURREY, BC
         SURREY, BC                         126,417 SF | 75% PRE-LEASED
         136,000 SF | 100% PRE-LEASED

          Q2
         DELTA IPORT                        RICHMOND INDUSTRIAL CENTRE     18991 34A AVENUE
         DELTA, BC                          BUILDING 3                     SURREY, BC
         484,920 SF | 50% PRE-LEASED        RICHMOND, BC                   122,370 SF
                                            200,000 SF | 100% PRE-LEASED

         SOUTH SURREY BUSINESS PARK         INTRAURBAN BRENTWOOD           7770 NORTH FRASER WAY
         BUILDING 4                         BUILDING 1-3                   BURNABY, BC
         SURREY, BC                         BURNABY, BC                    88,535 SF
         154,742 SF | 56% PRE-LEASED        105,000 SF | 100% PRE-SOLD

          Q3
         WESTPOINTE BUSINESS CENTRE         MASON CORPORATE CENTRE         THIRTY8 AVENUE BUSINESS CENTRE
         DELTA, BC                          ABBOTSFORD, BC                 BUILDING A & B
         195,564 SF | 29% PRE-SOLD          167,939 SF | 60% PRE-SOLD      SURREY, BC
                                                                           147,542 SF | BUILDING B 100% PRE-LEASED

         GRUBNER CENTRE                     COAST CORPORATE CENTRE
         LANGLEY, BC                        PORT COQUITLAM, BC
         169,500 SF                         192,522 SF

          Q4
         SERIES BUSINESS CENTRE
         BUILDING 3
         RICHMOND, BC
         152,802 SF

2019 INDUSTRIAL MARKET STATISTICS | 2020 TRENDS & PROJECTIONS                                                        |5
SALES & INVESTMENTS
Transaction volume fell to a 10-year low, but remained active with 432 transactions
Strata sales still dominated the sale market accounting for over 70% of all transactions
Total transaction volume for the year ended at $1.4B as compared to $1.9B in 2018.
The decline in total value is attributed to the lack of industrial investment product
in 2019 with only 7 transactions over $20M compared with 15 transactions in 2018
Due to the lack of product, the average sale price rose to $329 PSF, up 15% from 2018
With the run up in lease rates over the past 3 years we have seen cap rates move
up 25 to 50 basis points, however, should a trophy asset come to market we would
expect to see some cap rate compression strictly due to the scarcity of such
an acquisition
There is no shortage of capital looking for opportunities with the perceived low
risk in Metro Vancouver and the market poised to do well in 2020 with continued
growth in sale price and lease rates
INDUSTRIAL SALE MARKET
Total Value ($ millions) Sale Value $ per sq. ft. $ per sq. ft.
$2,000 $400
$1,800 $360
$1,600 $320
$1,400 $280
$1,200 $240
$1,000 $200
$800 $160
$600 $120
$400 $80
509 DEALS
490 DEALS
498 DEALS
598 DEALS
432 DEALS
524 DEALS
478 DEALS
475 DEALS
381 DEALS
451 DEALS
541 DEALS
491 DEALS
$200 $40
$0 $0
2008 2009 2010 2011 2012 2013 2014 2015 2016 2017 2018 2019
Source: CBRE Research, Q4 2019
2019 INDUSTRIAL MARKET STATISTICS | 2020 TRENDS & PROJECTIONS |6
2019 TOP 10 INVESTMENT DEALS BY PRICE
      INDUSTRIAL SALE MARKET
                   ADDRESS                         MARKET                     PRICE                           PURCHASER

               3131 Lake City Way                  Burnaby                 $146,000,000                    Larco Investments

              FAMA Business Park                    Surrey                 $66,150,000              CanFirst Capital Management

              4560 Tillicum Street                 Burnaby                 $40,650,000                           Beedie

             2323 Quebec Street &
                                                  Vancouver                $38,000,000                       TPMG Capital
             68-88 East 7th Avenue

               18920 36th Avenue                    Surrey                 $29,000,000                      Private Investor

             2992 Mt. Lehman Road                 Abbotsford               $25,500,000                   Hungerford Properties

                11511 No. 5 Road                  Richmond                 $21,900,000                           PIRET

             3625 Brighton Avenue                  Burnaby                 $20,000,000                 Rockwell Pacific Properties

               365 Railway Street                 Vancouver                $18,000,000                         Allied REIT

                5370 271st Street                  Langley                 $15,200,000                           Beedie

      2019 TOP 10 LEASE DEALS
           ADDRESS                    MARKET          SIZE (SF)                  TENANT                               INDUSTRY

   1425 & 1451 Derwent Way             Delta           282,526         Veritiv Operating Company                          3PL

       3200 E Broadway               Vancouver         258,000        CEVA Logistics Canada ULC                           3PL

4327 Salish Sea Way - Building 2     TFN Lands         250,000       Canadian Alliance Terminals Inc.                     3PL

        4300 80 Street                 Delta           234,629             MTU Aero Engines                          Aerospace

       7451 Nelson Road              Richmond          230,050                Ingram Micro                           Distribution
   3084 Peardonville Road &
                                     Abbotsford        179,057            Flexiforce Canada Inc.            Manufacturing & Distribution
      2285 Queen Street
      16131 Blundell Road            Richmond          178,787             Euro Asia Transload                            3PL

      820 Cliveden Place               Delta           174,473           Trail Appliances Limited                    Distribution

     27475 58th Crescent              Langley          162,000             General Motors Inc.                       Distribution

        3261 192 Street                Surrey          160,928        IEM Industrial Electrical Mfg.        Manufacturing & Distribution

     2019 INDUSTRIAL MARKET STATISTICS | 2020 TRENDS & PROJECTIONS                                                                   |7
LAND SALES
Developers are looking or have contemplated the
concept of multistorey industrial as a solution for high
land costs in Metro Vancouver for some time. However,
with only a handful of high-profile projects in North
America the concept is yet to be fully proven as a
solution or financially viable
2019 saw less than 300 acres in total sales, down over
100 acres from 2018. This decline is simply due to the
lack of available land as the appetite from owner/users
and developers is at an all time high
Only 8 sales over 10 acres occured, which will inevitably
put more pressure on the vacancy in the coming years
with the lack of significant development sites coming
to market
Land prices saw another year of growth at 23%,
bringing the three-year total to 119%. We project price
increases to be far more muted in 2020 as the sale
and lease rates do not justify the current land prices
or expectations from vendors
2019 TOP 10 LAND SALES
ADDRESS MARKET SIZE (ACRES) PURCHASER
14933-14995 Colebrook Road Surrey 25.01 Beedie
18930 & 18970 24th Avenue Surrey 19.69 PIRET & Cedar Coast
3231 No. 6 Road Richmond 9.51 Conwest Group of Companies
1168 & 1170 Derwent Way Delta 14.82 Beedie
6856 152nd Street & 15331 68th Avenue Surrey 13.22 Conwest Group of Companies
10566 Scott Road Surrey 14.21 Vancouver Fraser Port Authority
1491 & 1515 Kingsway Avenue Port Coquitlam 9.68 Conwest Group of Companies
1154-1156 Kingsway Avenue Port Coquitlam 10.35 Surrey Cedar Ltd.
9697-9765 190th Street Surrey 5.72 Beedie
9760 190th Street Surrey 4.88 Beedie
*Excludes share transfer transactions.
2019 INDUSTRIAL MARKET STATISTICS | 2020 TRENDS & PROJECTIONS |8FOR MORE INFORMATION CONTACT
CHRIS MACCAULEY HAYDEN FERRILL
Senior Vice President | Industrial Properties Sales Representative
Personal Real Estate Corporation 778 372 1934
604 662 5190 hayden.ferrill@cbre.com
chris.maccauley@cbre.com
JOE INKSTER ANTHEA LO
Senior Vice President | Industrial Properties Real Estate Services Assistant
Personal Real Estate Corporation 778 372 3936
604 662 5134 anthea.lo@cbre.com
joe.inkster@cbre.com
ILYA TIHANENOKS KATIE MACSKASY
Senior Associate Real Estate Services Assistant
778 372 3930 604 662 5100
ilya.tihahenoks@cbre.com katie.macskasy@cbre.com
CBRE Limited | 1021 West Hastings Street | Suite 2500 | Vancouver, BC V6E 0C3
This disclaimer shall apply to CBRE Limited, Real Estate Brokerage, and to all other divisions of the Corporation; to include all employees and independent contractors (“CBRE”). The information
set out herein, including, without limitation, any projections, images, opinions, assumptions and estimates obtained from third parties (the “Information”) has not been verified by CBRE, and CBRE
does not represent, warrant or guarantee the accuracy, correctness and completeness of the Information. CBRE does not accept or assume any responsibility or liability, direct or consequential,
for the Information or the recipient’s reliance upon the Information. The recipient of the Information should take such steps as the recipient may deem necessary to verify the Information prior to
placing any reliance upon the Information. The Information may change and any property described in the Information may be withdrawn from the market at any time without notice or obligation to
the recipient from CBRE. CBRE and the CBRE logo are the service marks of CBRE Limited and/or its affiliated or related companies in other countries. All other marks displayed on this document
are the property of their respective owners. All Rights Reserved.
2019 INDUSTRIAL MARKET STATISTICS | 2020 TRENDS & PROJECTIONS |9You can also read