A composite approach to gauge trading & investment risk on the JSE
←
→
Page content transcription
If your browser does not render page correctly, please read the page content below
A composite approach to gauge trading & investment risk on the JSE

Dwaine van Vuuren, July 2014

©2014, PowerStocks Investment Research                                                          1
A composite approach to gauge trading & investment risk on the JSE

1. INTRODUCTION
We discuss a composite approach to gauging short-term liquidity risk on the JSE, deploying a 4-component JSE Liquidity Risk Index (STL4) derived from equal
weight parts of the following daily measurements:

    1.   JSE McClellan Volume Oscillator (VMCOS)
    2.   New Hi’s less new Low’s Breadth Index (HILO)
    3.   JSE percentage from 20-day moving average (Price momentum)
    4.   Options-derived Volatility Index (SAVI)

STL4 does an excellent job of measuring short-term risk inherent in the market, since not all the above 4 representations of short term liquidity risk on the JSE
are perfect all the time, meaning the “cocktail” approach with a diversified set of metrics provides superior, more consistent results.

2. COMPONENT-1: JSE McClellan Volume Oscillator (VMCOS)
To measure short -term liquidity flows on the JSE using volume breadth, we deploy the McClellan Volume Oscillator (VMCOS.)The underlying measurement
for measuring liquidity is daily advancing and declining volume for all JSE listed ordinary shares excluding debt, derivatives, ETF’s and ETN’s. It is often said
that volume precedes price on the markets and this is certainly true when measuring liquidity.

To calculate daily advancing volume, we add up the volume traded of all shares that rose in price for the day. Declining volume is then the sum of all volume
for shares that fell in price for the day. To represent net liquidity flow for the day we subtract total declining volume from advancing volume. If this is a
positive number then the market experienced a “liquidity inflow” and if it is negative, it experienced a “liquidity outflow.”

To cater for the large and steady increase in volumes traded on the JSE over the last decade we divide the net liquidity by the total volume of the day to
represent net liquidity as a percentage of all volume traded. This allows valid comparison of numbers and levels seen today with numbers and levels seen in
the distant past.

                            NET DAILY LIQUIDITY (NDL) = (ADVANCING VOLUME – DECLINING VOLUME)/ALL VOLUME*100

©2014, PowerStocks Investment Research                                                                                                             2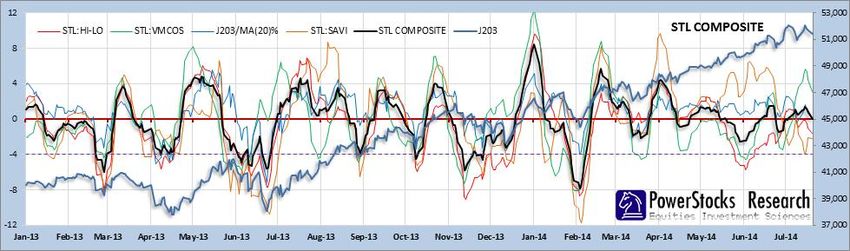
A composite approach to gauge trading & investment risk on the JSE

NDL can be rather volatile, rendering it less useful in daily raw form, as depicted below.

Once we have net daily liquidity we can now calculate the famous Volume McLellan Oscillator (VMCOS.) This is just the difference between the 19-period
exponential moving average of NDL (commonly known as the 10% smoothed index) and the 39-period exponential moving average of NDL (the 5% index.)
Whilst the 19 and 39-period exponential moving averages of NDL are more useful for market timing than the volatile, unsmoothed NDL, it is the difference
between these two (the VMCOS) we are interested in as this represents money leaving the market (negative) or money entering the market (positive.)
30
             10% INDEX LESS 5% INDEX (VMCOS)    36-PERIOD SMOOTHED (5% INDEX)                   18-PERIOD SMOOTHED (10% INDEX)              J203:ALSH                    47,500
25

20                                                                                                                                                                       45,500

15

10                                                                                                                                                                       43,500

 5
                                                                                                                                                                         41,500
 0

 -5
                                                                                                                                                                         39,500
-10
                                                       “The McClellan Oscillator is a market breadth indicator used in technical analysis
                                                               to evaluate the rate of money entering or leaving the market.”
-15                                                                                                                                                                      37,500
       18/3/13
       25/3/13

       12/4/13
       18/4/13
       24/4/13
       30/4/13

       13/5/13
       17/5/13
       23/5/13
       29/5/13

       10/6/13
       14/6/13
       21/6/13
       27/6/13

       15/7/13
       19/7/13
       25/7/13
       31/7/13

       13/8/13
       19/8/13
       23/8/13
       29/8/13

       10/9/13
       16/9/13
       20/9/13
       27/9/13
       3/10/13
       9/10/13

       6/11/13

       4/12/13

       13/1/14
       17/1/14
       23/1/14
       29/1/14

       10/2/14
       14/2/14
       20/2/14
       26/2/14

       10/3/14
       14/3/14
       20/3/14
        2/4/13
        8/4/13

        7/5/13

        4/6/13

        3/7/13
        9/7/13

        6/8/13

        4/9/13

        7/1/14

        4/2/14

        4/3/14
      15/10/13
      21/10/13
      25/10/13
      31/10/13

      12/11/13
      18/11/13
      22/11/13
      28/11/13

      10/12/13
      17/12/13
      23/12/13
      31/12/13
©2014, PowerStocks Investment Research                                                                                                                             3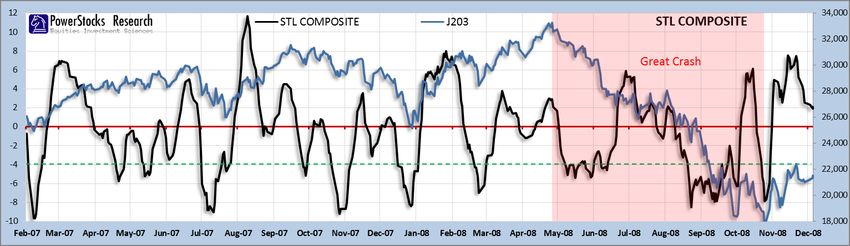
A composite approach to gauge trading & investment risk on the JSE

We see that the 5% and 10% indexes dipping below zero obviously represent net liquidity outflows, but the difference between the two (VMCOS) signals
these outflows sooner, providing more timeous warning. VMCOS represents short-term liquidity flows and clearly from the chart, the JSE is generally
weak/vulnerable/falling when the VMCOS is less than zero (red shading=negative liquidity) and is strong/rising when VMCOS is positive (green
shading=positive liquidity inflows.)

It is important to interpret the VMCOS from the perspective of the positioning of the 5% and 10% indexes used to derive it. A negative VMCOS derived from
two positive 5% and 10% indexes thus has less ominous connotations than one derived from two negative 5% and 10% indexes. In most cases the first
instance just signals a healthy minor pullback in an otherwise healthy JSE up-trend. Similarly, one should not become too enthused with a swing from
negative to positive for the VMCOS when the 5% and 10% indexes are themselves below zero.

Whilst VMCOS is an excellent representation of short-term liquidity flows, it can tend to whipsaw around zero on occasion, frustrating some market timing
efforts. These whipsaws can be significantly reduced by smoothing VMCOS itself. We achieve this by measuring a 10-period exponential moving average of
VMCOS and a 21-period exponential moving average of VMCOS and measuring the DIFFERENCE between these two. When the 10-period EMA of VMCOS
rises above the 21-period EMA, this warns that medium-term liquidity flows are accelerating and the JSE is likely to rise. When the 10-period EMA of VMCOS
falls below the 21-period EMA then this warns that medium-term liquidity flows are slowing and the JSE is likely to fall very shortly. The 10-period EMA, 21-
period EMA and their difference thus provide the perfect trifecta for traders wanting to manage short-term market risk, as displayed in the chart below.

 7
             DIFFERENCE        21-PERIOD SMOOTHED OF VMCOS        10-PERIOD SMOOTHED OF VMCOS        J203:ALSH                                        47,500
 6
 5
 4
                                                                                                                                                      45,500
 3
 2
 1                                                                                                                                                    43,500
 0
 -1
                                                                                                                                                      41,500
 -2
 -3
 -4
                                                                                                                                                      39,500
 -5
 -6
                                                                   MTL COMPONENTS
 -7                                                                                                                                                   37,500
       18/3/13
       25/3/13

       12/4/13
       18/4/13
       24/4/13
       30/4/13

       13/5/13
       17/5/13
       23/5/13
       29/5/13

       10/6/13
       14/6/13
       21/6/13
       27/6/13

       15/7/13
       19/7/13
       25/7/13
       31/7/13

       13/8/13
       19/8/13
       23/8/13
       29/8/13

       10/9/13
       16/9/13
       20/9/13
       27/9/13
       3/10/13
       9/10/13

       6/11/13

       4/12/13

       13/1/14
       17/1/14
       23/1/14
       29/1/14

       10/2/14
       14/2/14
       20/2/14
       26/2/14

       10/3/14
       14/3/14
       20/3/14
        2/4/13
        8/4/13

        7/5/13

        4/6/13

        3/7/13
        9/7/13

        6/8/13

        4/9/13

        7/1/14

        4/2/14

        4/3/14
      15/10/13
      21/10/13
      25/10/13
      31/10/13

      12/11/13
      18/11/13
      22/11/13
      28/11/13

      10/12/13
      17/12/13
      23/12/13
      31/12/13
©2014, PowerStocks Investment Research                                                                                                         4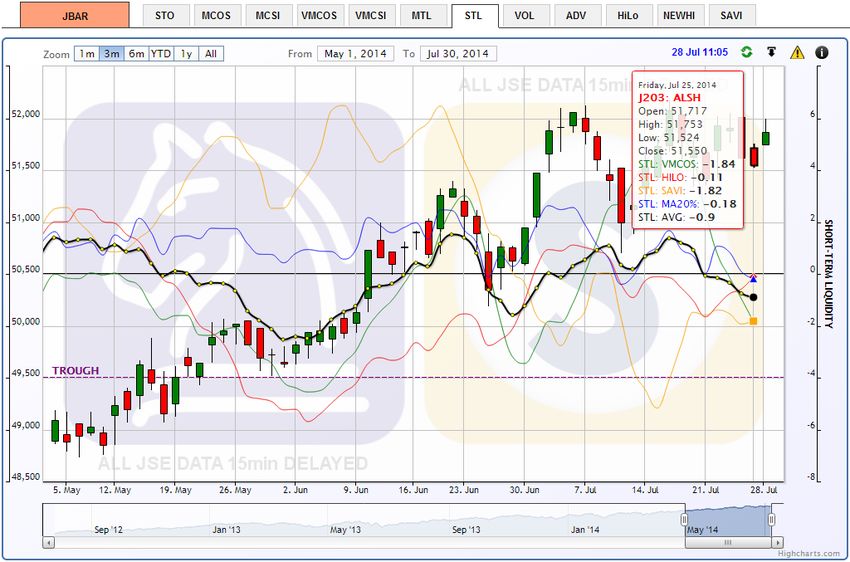
A composite approach to gauge trading & investment risk on the JSE

3: COMPONENT-2: New High’s LESS New Low’s Breadth (HILO Index)
This is a proprietary index developed by PowerStocks Research
                                                                          NET NEW 10-DAY HI’S = (New 10-day Hi’s – New 10-day Low’s)/(# of shares on JSE)*100
which tracks the daily net percentage of JSE shares making both           NET NEW 50-DAY HI’S = (New 50-day Hi’s – New 50-day Low’s)/(# of shares on JSE)*100
new 10-day (2 week) and 50-day (10 week) highs:

When either of these indexes are less than zero it means more shares are making new lows than new highs (bearish) and when the number is positive it
shows more shares are making new highs than those making new low's (bullish.) The net new 10-day highs index is a faster moving one than the 50-day net
new highs (due to the shorter period being examined) and since by definition a share has to be making new 10-day highs in order to be making new 50-day
highs, you can view the net 10-day line as a leading indicator for the net-50-day line (or view them similarly to a fast and slow moving average pair).

Thus, when the net 10-day Hi line is below the net 50-day Hi line it means weakness is setting in which if persists will start making the net 50-day Hi’s fall. In
fact, when the 10-day Hi line crosses under the 50-day Hi line for more than 3-5 days, this is an excellent early warning of an impending JSE correction,
which works 70% of the time. When both lines are both below zero then this is very negative, especially if they are both falling. Similarly if the orange line is
above the black line and both are positive and rising then this is very bullish for the market as breadth is accelerating.

It is clear then that the DIFFERENCE between the net new 10-day highs and the net new 50-day highs is a very good interpretation of short term liquidity
acceleration (rising difference), deceleration (falling difference), outflows (negative difference) and inflows (positive difference.)

©2014, PowerStocks Investment Research                                                                                                              5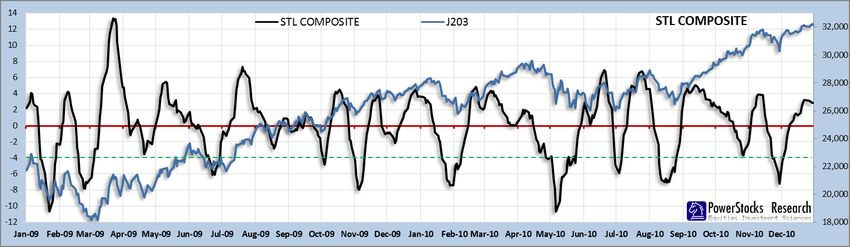
A composite approach to gauge trading & investment risk on the JSE

4: COMPONENT-3: J203 Percent from 20-day moving average
This is a well-known indicator that merely tracks the percentage the J203 is trading above or below its 20-day simple moving average.

The chart below shows the J203, its 20-day moving average and the percentage difference between the J203 and its 20-day moving average. When the
percentage difference is positive, it means J203 is trading above her 20-day moving average (bullish or positive liquidity) and when the difference is negative
it means J203 is trading below her 20-day moving average (bearish or negative liquidity):

This indicator measures price action momentum and is useful to keep us in the markets when the JSE is steamrolling upwards whilst breadth may be
declining. Make no mistake, the declining or negative breadth is a severe warning, but this indicator lets us join the ride when the market is still showing
extreme momentum. The indicator can whipsaw from time to time and it is useful to take a 2 or even 5-period moving average of the difference to eliminate
whipsaws, which of course comes with a price of delayed signals.

Unlike all the other three components used in the Liquidity Risk Index (STL4) this component is lagging meaning some damage has to set in on the J203
before we get the liquidity warning and thus our exit signal. All the other components are leading meaning they warn you of a liquidity crunch before the
market actually puts in her final peak. However this indicator is our insurance policy against a rising market on the backdrop of falling breadth (which is rare
but can occur from time to time.)

©2014, PowerStocks Investment Research                                                                                                            6

A composite approach to gauge trading & investment risk on the JSE

5: COMPONENT-4: Options-derived Implied Volatility (SAVI)
The South African Volatility Index (SAVI) Top 40 is a forecast of Equity Market risk in South Africa. It is modelled on the VIX©, a popular measure for the
volatility of the S&P 500. The SAVI Top 40 enables investors to gauge fear and market sentiment relating to the local Equity Market. In essence, the SAVI
constructs a forward-looking index that provides a daily prediction of market volatility in three months' time. It is calculated using implied volatilities obtained
daily from specific Top 40 options. Since it is well documented that there exists a negative correlation between the underlying index level and its volatility,
the SAVI can be thought of as a "fear" gauge.

Although most institutional investors view low implied volatility on the SAVI as a sign of complacency and a warning for a possible market top, we have found
it more useful to take a contrarian view to this and stay vested in the JSE when volatility is low and get out the JSE when volatility rises. Our assumptions,
derived from research we did when constructing the TroughFinder-IV Selling Pressure Index, is that a rise in volatility is normally what precedes market tops
and corrections. To this end we have constructed a SAVI oscillator derived from an exponential moving average of the SAVI's inverted rate of change, as
displayed below. When it is above zero, it is implying low volatility expectations from the options traders and it means we want to stay long, and conversely,
when it is negative it implies raised volatility expectations from the options traders and means we want to exit the JSE. To this end, high positive values are
viewed as bullish and low negative values are viewed as bearish. You can see that the SAVI index dropping below zero provides for excellent intermediate
term market top warnings.

©2014, PowerStocks Investment Research                                                                                                               7
A composite approach to gauge trading & investment risk on the JSE

6: CREATING A COMPOSITE OF SHORT-TERM LIQUIDITY RISK
We have demonstrated four excellent diversified measures of JSE short-term liquidity risk, and want to combine them into a single Short-Term Liquidity Risk
Index (STL4), but in order to do this we must normalize each of the 4 components across a common range of values to ensure one component does not
dominate another just because its calculation methodology yields larger numbers.

Once we have done this, we run a multiple-regression analysis against the J203 over a 10-year period to determine optimal weightings for each of the 4
components to create a non-equal weighted composite index best suited for market timing. The optimal result is shown below where STL:HI-LO is 33%
weighted, STL:VMCOS is 30% weighted, J203/MA(20)% is 22% weighted and STL:SAVI is 15% weighted:

Sometimes the index flags high liquidity risk by dipping below zero (negative liquidity) and yet the JSE continues to rise. It is important to remember that the
index reflects LIQUIDITY RISK in the JSE and not necessarily the PROBABILITY OF A RISE/FALL. Of course high liquidity risk is most often accompanied by a JSE
correction but not always!

There are two ways you can incorporate risk into your trading using this index. The first is to remain long whenever the STL4 is above zero and stay in cash (or
short) when it is below zero. The second, more preferred method is to split your exposure up into four and be exposed long to the market according to the
number of the STL4 components that are above zero. So for example, currently the index on the right of the chart is positive, but two of the components are
still negative, implying we only have 2 out of 4 or 50% of our resources (funds) long on the market. As the liquidity risk rises and more and more components
of the index fall below zero, you adjust your equity to the implied risk by pulling more money out the market and vice versa.

©2014, PowerStocks Investment Research                                                                                                            8
A composite approach to gauge trading & investment risk on the JSE 7: STL4 DAILY UPDATED CHART Subscribers get access to daily updates and SMS/email alerts for STL4 from the JBARSTL charts menu: ©2014, PowerStocks Investment Research 9
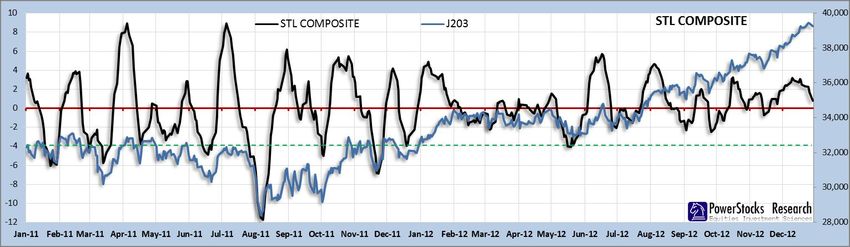
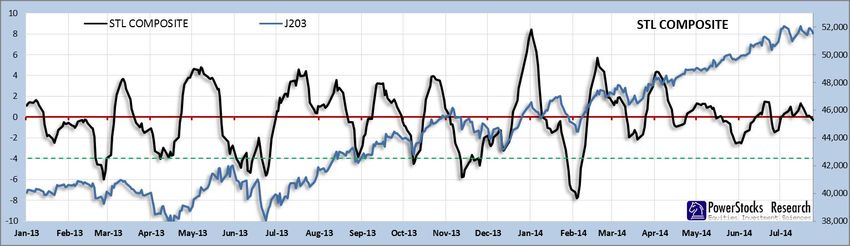
A composite approach to gauge trading & investment risk on the JSE

8: ARCHIVE OF HISTORIC STL4 PERFORMANCE

*Green dashed line = 1 standard deviation line – go long when STL4 rises above this line from below, for an early-bird buy-on-the-dip signal.

©2014, PowerStocks Investment Research                                                                                                          10
A composite approach to gauge trading & investment risk on the JSE

*Green dashed line = 1 standard deviation line – go long when STL4 rises above this line from below, for an early-bird buy-on-the-dip signal.

©2014, PowerStocks Investment Research                                                                                                          11
You can also read