MARKET ANALYSIS: NASDAQ100 (HOURLY) - Wyckoff Analytics
←
→
Page content transcription
If your browser does not render page correctly, please read the page content below
WYCKOFF MARKET REPORT
                                                                                                                                      VOLUME #2
                                                                                                                                        9.18.2020
Welcome to the Wyckoff Market Report! In each issue you’ll find a concise analysis of the overall U.S. market, a “Chart of
Interest,” as well as industry groups of interest, and up to 20 liquid stocks or ETFs identified through the weekly selection
process we use to populate our own watchlists. We focus on stocks and ETFs in emerging uptrends after building a cause,
anticipating that they may become actionable in the future.

MARKET ANALYSIS: NASDAQ100 (HOURLY)
                                                                                                        Market trend:
                                                                                                        Long-term: UP
                                                                                                        Intermediate: UP
                                                                                                        Short-term: DOWN
             Change of
             Behavior            Automatic Rally                                                        Point-and-Figure targets:
                                                                                     No lift
                                                                                                        Down swing count: 10,350 – 9,735
                                                                                                        Analysis:
                                                                      Upthrust Attempt
                                                                                                        Rotation out of big tech stocks has
                                                                                                        produced an abrupt Change of Behavior.
                                                                                                        Currently, the market is under pressure
                                                                                                        and in position to move further to the
                                                                                                        downside. A one-to-one measured
                Selling Climax
                                                                                                        move suggests 10,215 as a potential
                                       Secondary Test                                                   target, consistent with PnF price
                                                                                                        objectives. If a more pronounced
                                                                                                        reaction occurs, actionable set-ups may
                                                                                                        emerge after further stopping and
                                                                                                        testing actions. For now, we want to
                                                                                                        identify resilient groups and stocks that
                                                                                                        are outperforming the market.

CHART OF INTEREST: DRAFTKINGS (DKNG)
                                                                                         SOS
                                                                                                        Analysis:
                                                                                                        As the NFL and NBA get back into
                                                                                                        action, this week’s chart of interest is
                                                                                                        DraftKings, a sports fantasy enterprise.
                                                                                                        After uneventful IPO price action, the
                                                                                                        stock rallied from $10 to $40. This
                                                                                  Higher Lows =
                                                                                  evidence of
                                                                                                        advance was accompanied by
                                                                                  absorption            increasing institutional demand, a
                                                                                                        bullish sign. A Re-accumulation trading
                                                                                                        range followed with a good causality,
                                                                                                        suggesting potential PnF price targets of
                                                                                                        $85-92. The stock is currently in very
                                                                                                        high demand, so we need to wait for a
                                                                                                        low-risk point of entry. The most recent
                                                                                                        Sign of Strength may be followed by a
                                                                                                        Back-up action or another Re-
                                                                         RS new high = Leadership       accumulation, either of which could
                                                                                                        present an actionable opportunity.
DISCLAIMER: The content in this newsletter is for informational and educational purposes only; it is not investment advice. We do not
recommend the purchase or sale of any individual investment, and do not assume any liability or responsibility whatsoever for any trading or
investment decisions you make. You understand and acknowledge that: (1) there is a very high degree of risk involved in trading securities,
including the total loss of your capital; (2) you alone are responsible for your investment and trading decisions and results; (3) any reliance that
you place on information in this newsletter is strictly at your own risk. (See full disclaimer, p. 6)
www.WyckoffAnalytics.com                                                                  Copyright © 2020 Wyckoff Associates, LLC. All Rights Reserved.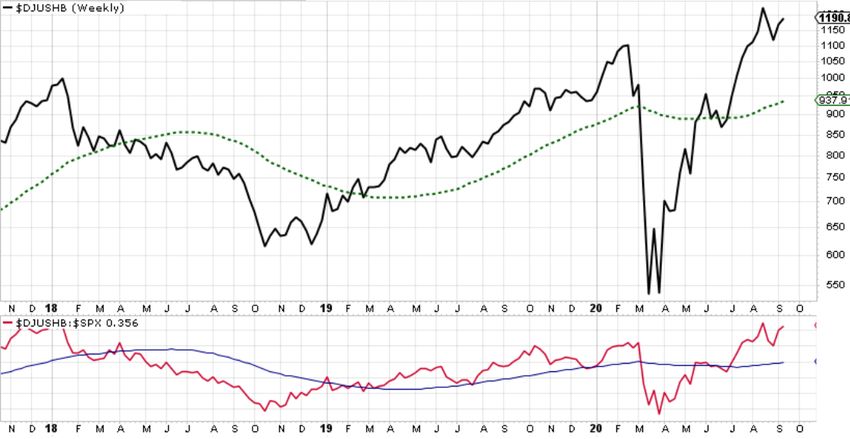
WYCKOFF MARKET REPORT
VOLUME #2
9.18.2020
INDUSTRY GROUPS OF INTEREST
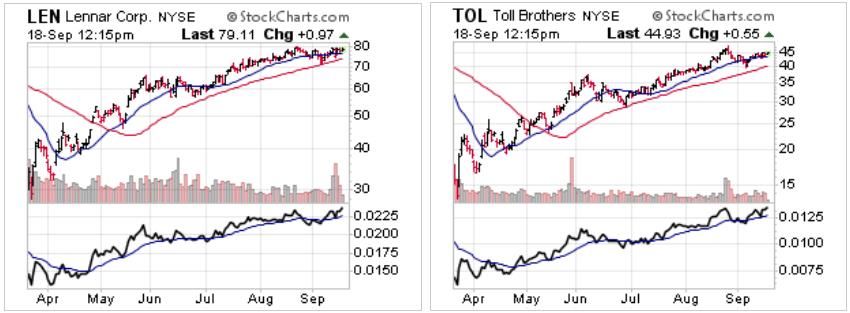
Symbol: $DJUSHB (Home
Construction)
Analysis: New highs in price and
relative strength in this group are
being fueled by low interest rates
as well as Covid-related reloca-
tions. Technically, the group is in
well-established uptrends in price
and relative strength. Though
short-term consolidation is possi-
ble, this group contains several
appealing trade candidates.
Notable stocks in the group:
LEN, PHM, DHI, TOL, KBH, MDC
Symbol: $DJUSFT (Footwear)
Analysis: This group’s price is at
an all-time high, with relative
strength confirming its leadership
character. Overall market
weakness may result in a short-
term reaction. If the group’s
relative strength is maintained,
the component stocks will likely
continue to thrive and attract
additional buying.
Notable stocks in the group: NKE,
DECK, SKX, RCKY
Symbol: $DJUSAR (Airlines)
Analysis: Though this group is not
in a relative strength leadership
position yet, the price structure
suggests that accumulation may
be nearing completion. Price may
AR
re-test the AR high in a shallow
reaction before the next rally.
Stocks in this group need be
carefully vetted before making
any commitments.
Notable stocks in the group: LUV,
DAL, ALK, UAL
Other groups of interest: $DJUSAT, $DJUSMG, $DJUSRR, $DJUSCC, $DJUSTK, $DJUSVN, $DJUSSD, $DJUSTB, $DJUSRQ, $DJUSCA
www.WyckoffAnalytics.com Copyright © 2020 Wyckoff Associates, LLC. All Rights Reserved.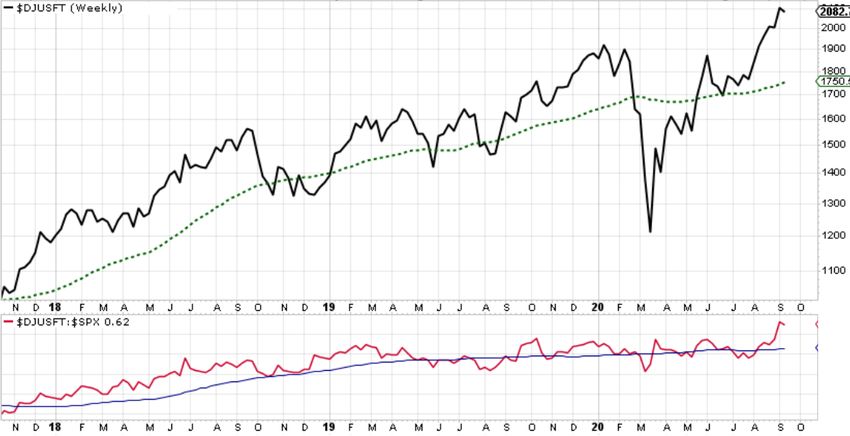
WYCKOFF MARKET REPORT
VOLUME #2
9.18.2020
TOP STOCKS OF INTEREST
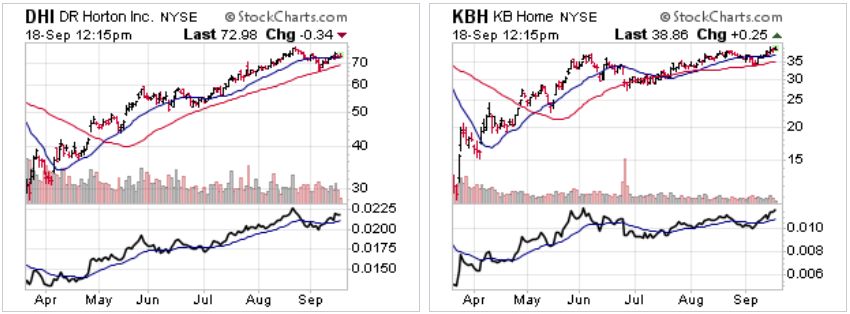
Moving averages
20-day EMA = blue
50-day SMA = red
Relative strength = black
30-day moving average = blue
DHI: Currently consolidating in a dynamic uptrend. KBH: The series of higher lows indicates absorption.
Watch for completion of this Re-accumulation. Watch for a Change of Character into a new uptrend.
LEN: A new high in relative strength may be leading TOL: Relative strength confirms continued
price; be on the alert for a potential breakout. leadership in the current uptrend.
SKX: The price structure suggests absorption. Watch DECK: The flat Re-accumulation trading range
for a Back-up after a Sign of Strength. suggests continuation of the prior steep markup.
www.WyckoffAnalytics.com Copyright © 2020 Wyckoff Associates, LLC. All Rights Reserved.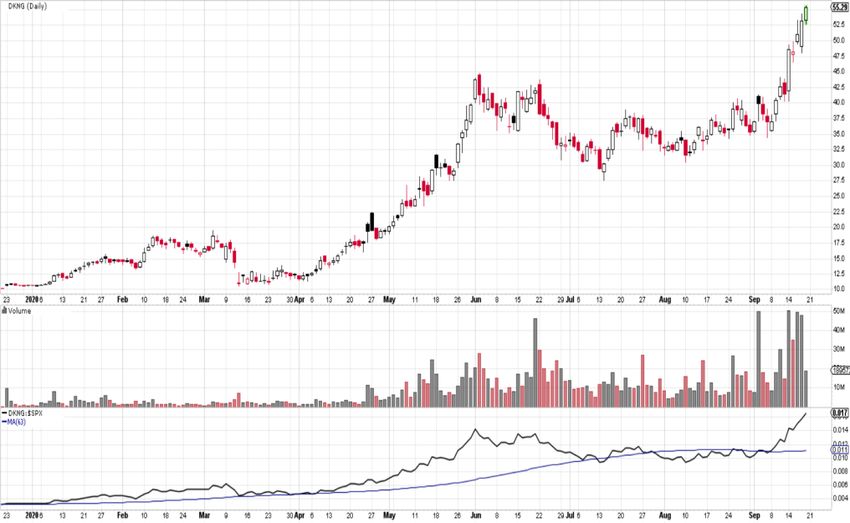
WYCKOFF MARKET UPDATE
VOLUME #2
9.18.2020
TOP STOCKS OF INTEREST
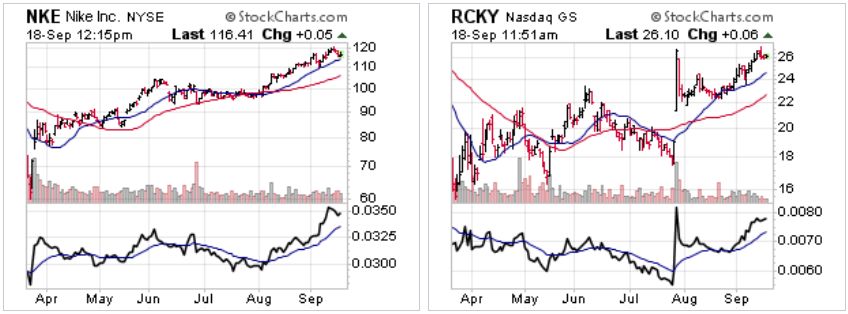
Moving averages
20-day EMA = blue
50-day SMA = red
Relative strength = black
30-day moving average = blue
NKE: An important markup following Re- RCKY: In this small-cap stock, an aggressive SOS is
accumulation is confirmed by relative strength. holding as the Back-up action nears completion.
ALK: Late-stage accumulation confirmed by emerging DAL: Absorption appears in the upper part of the
relative strength uptrend. A pullback is possible here. trading range. Possible pullback before take-off.
LUV: Re-accumulation follows a sharp rally off the UAL: Not the strongest in the group, but price is
V-bottom low. Price is near resistance. consolidating in the upper part of the May-June SOS.
www.WyckoffAnalytics.com Copyright © 2020 Wyckoff Associates, LLC. All Rights Reserved.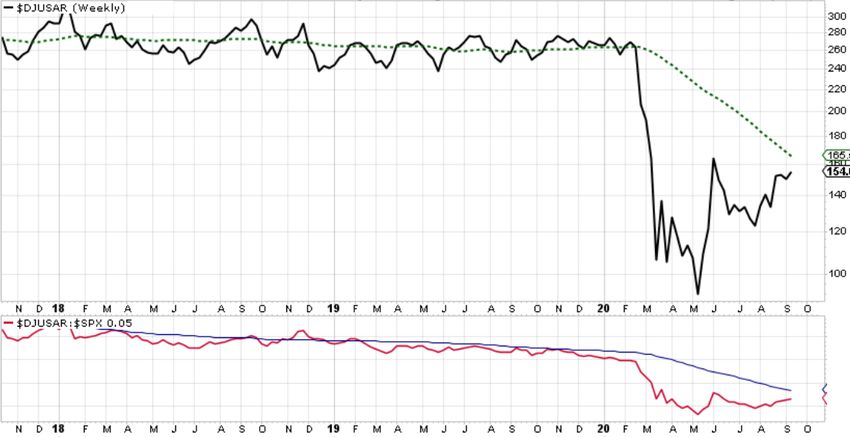
WYCKOFF MARKET UPDATE
                                                                                                                  VOLUME #2
                                                                                                                    9.18.2020

SELECTION METHODOLOGY

  During a market uptrend, we seek large and mid-cap stocks as well as liquid ETFs:
  1. In sync with the trend of the overall market
  2. In confirmed uptrends in both absolute and relative performance
  3. Included in industry groups displaying both absolute and relative outperformance
  4. That present substantial reward-to-risk ratios, with price objectives estimated by Point-and-Figure counts
  5. In or approaching potentially actionable positions within Wyckoff price structures
  During a market downtrend, we highlight inverse ETFs or defensive stocks likely to benefit from the decline.

  Schematic illustrations of our screening algorithm during an uptrend

                  ACCUMULATION                                      Criteria for candidate selection in a market
                                                                    uptrend
                                           Selection POE
                                                                    1. The stock or ETF price displays absolute and
                                                                       relative strength compared with the market.
                                                                    2. The stock’s or ETF’s industry group also
                                                                       shows outperformance.
                                                                    3. PnF price targets suggest attractive reward-
                                                                       to-risk ratios.
                                           Selection POE            4. The stock or ETF is in or approaching an
                                                                       actionable position.
                                                                    5. Purchase of any stock selection should be
                                                                       timed to coincide with a rally phase in stock
                                                                       indexes.

               RE-ACCUMULATION

   Schematic illustration of our screening algorithm during a downtrend:

                                                                    Criteria for candidate selection in a market
                                                                    downtrend

                                                                    1. The industry group or sector displays
                                                                       weakness relative to the market and may
                                                                       have an associated inverse ETF, OR
                                                Selection POE       2. Defensive industry groups or stocks are
                                                                       typically in an established uptrend.
                                                                    3. PnF price targets suggest attractive reward-
                  DISTRIBUTION                                         to-risk ratios.
                                                                    4. The stock or inverse ETF is in or approaching
                                                                       an actionable position.

www.WyckoffAnalytics.com                                              Copyright © 2020 Wyckoff Associates, LLC. All Rights Reserved.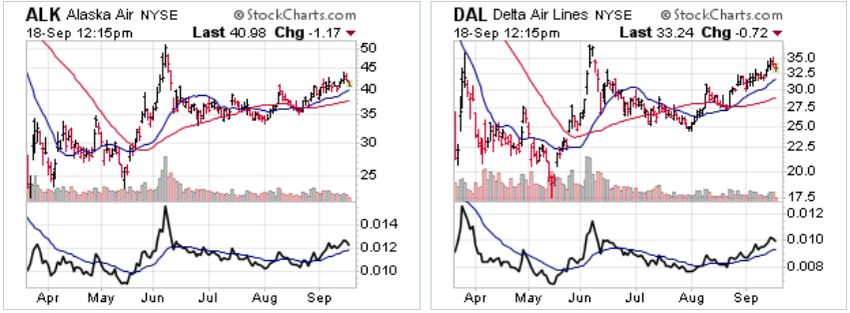
WYCKOFF MARKET UPDATE
                                                                                                                          VOLUME #2
                                                                                                                            9.18.2020

TERMINOLOGY AND IMPORTANT NOTE ON INDUSTRY GROUPS AND STOCKS OF INTEREST

  Key to Wyckoff Abbreviations (to learn more, please see “Wyckoff Schematics” at www.wyckoffanalytics.com/wyckoff-
  method/)

  BC – Buying Climax                 AR – Automatic reaction (after BC)           LPS – Last point of support
  SC – Selling Climax                AR – Automatic rally (after SC)              LPSY – Last point of supply
  SOS – Sign of Strength             ST – Secondary test                          POE – Point of entry
  SOW – Sign of Weakness             UT – Upthrust                                ChoCh – Change of character
  PnF – Point & Figure               UTAD – Upthrust after distribution           ChoBeh – Change of behavior
  TR – Trading range                 BO – Breakout                                SO – Shakeout
  The stocks and ETFs profiled in this newsletter are potential candidates for our personal watchlists as of the date of
  publication of this newsletter. They may not yet be actionable, but we may consider them for investment when the
  market is either in or poised to resume an uptrend after building a sufficient cause. However, at any time it’s possible
  that deterioration of a stock’s price and volume signature (or of the overall market environment) will undermine its
  attractiveness as a trade candidate. In addition, please note that by listing any security in this newsletter, we are not
  making a commitment to trade it in our own accounts, nor are we recommending it for purchase. (See “Full
  Disclosure”, below). All traders need to make investment decisions (including point of entry, initial stop-loss and
  trade management) that are consistent with their own goals, trading plan and risk tolerance.

FULL DISCLAIMER
The content of this newsletter is for informational and educational purposes only; nothing herein should be construed as
investment advice. We do not recommend the purchase or sale of any individual investment, and do not assume any
liability or responsibility for any of your investment or trading decisions or results. We make no representations or
warranties of any kind, express or implied, about the completeness, accuracy, reliability, timeliness or suitability of the
newsletter content for any individual or institutional investor.

You alone are responsible for your investment and trading decisions and results; any reliance that you place on
information in this newsletter is strictly at your own risk. You understand and acknowledge that: (1) there is a very high
degree of risk involved in trading securities, including the total loss of your capital; and (2) you assume any and all risk
associated with your investment and trading decisions. Wyckoff Analytics, its principals, officers, directors, employees
and contractors, as well as its third-party providers, assume no responsibility or liability whatsoever for your trading and
investment decisions and results.

The principals, officers, directors, employees, contractors and affiliates of Wyckoff Analytics are not registered investment
advisors or broker-dealers and do not recommend or suggest any securities to buy or sell. You acknowledge and
understand that the principals, officers, directors and employees of Wyckoff Analytics and its third-party providers or
contractors may or may not have open positions in any security mentioned in this newsletter. You assume any and all risk
associated with your investment decisions irrespective of whether the principals, officers, directors, employees,
contractors and affiliates of Wyckoff Analytics hold positions in investment vehicles mentioned on this newsletter.

It should not be assumed that the market or trade candidates, as well as the underlying methods and techniques
underlying trade candidate selection, will be profitable or that they will not result in losses. Accordingly, you should not rely
solely on the newsletter content in making any trade or investment. Rather, you should always conduct additional
independent research to allow you to form your own opinions prior to placing any trade or investment. You should always
check with your broker or licensed financial advisor to determine the suitability of any investment, and to verify pricing and
other relevant information.

www.WyckoffAnalytics.com                                                      Copyright © 2020 Wyckoff Associates, LLC. All Rights Reserved.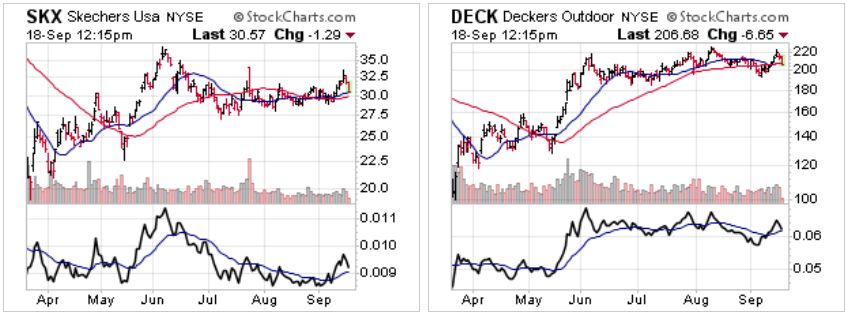

You can also read