REGULAR UPDATES # 25 MAY 19 2021 - Kraft Analytics Group
←
→
Page content transcription
If your browser does not render page correctly, please read the page content below

R EGULAR UPDATES # 25
     MAY 19 2021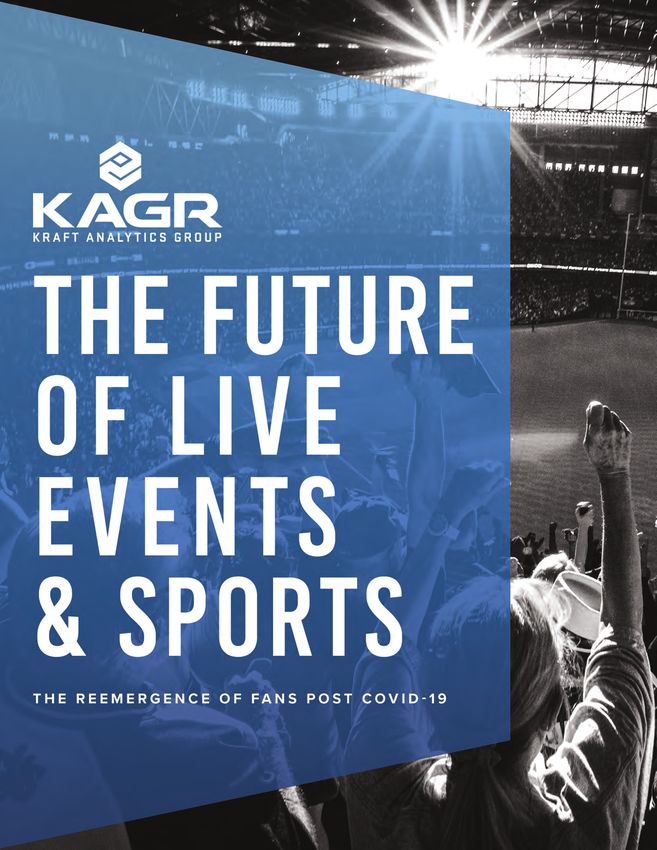
BACKGROUND
             In KAGR’s 25 th update, we celebrate our one-year anniversary of the “Future of Live Events &
             Sports: The Re-Emergence of Fans Post Covid-19”. In May 2020, the KAGR team embarked on a
             data-driven journey to better define and understand the future of live events and sports during the
             recovery from COVID-19. Our goal was to predict fan interest in attending games and live events
             when they resume.

             At KAGR, we triangulate past behavioral data with qualitative and consumer insights to forecast
             future action. Over the past year, we have used our technical and analytic capabilities via machine
             learning and data collection to track the following:

                                 • How 32 U.S. markets are rebounding
                                 • How businesses in those markets are recovering
                                 • How fan engagement has changed

             As we enter our second year and live events have resumed, we continue to closely track how our
             framework1 for understanding Fan Demand is impacted based on market-specific factors, venue
             initiatives, and fan avidity. We have sifted through all the noisy data to bring you insights on how
             live events and sports will be different as a result of the COVID-19 pandemic.

             May 19 2021: Update Overview

             Over the past two weeks, federal and local government announcements have resulted in the rolling
             back of several restrictions including removing capacity constraints and social distancing protocols
             (e.g. masks, 6 feet distance). The NFL released their 2021 schedule last week to an enthusiastic fan
             base and has seen strong early signs of demand. The NHL and NBA playoffs have kicked off and the
             WNBA begins their 25th season with a full season tournament including several games airing on
             Amazon Prime Video. As capacity restrictions are removed, we remain focused on defining: which
             fans will attend, what do they expect when they return, and how has their willingness to pay
             changed?

             In this update, we explore:
                                 • Increases in KAGR Fan Demand Index as COVID-19 cases drop and
                                   consumer behaviors rise
                                 • A lookback at KAGR Fan Demand Index trends over the past year
                                 • Sell-through trends across leagues

1 See Figure 8 on page 9 “KAGR Fan Demand Framework”
                                                                                                                    1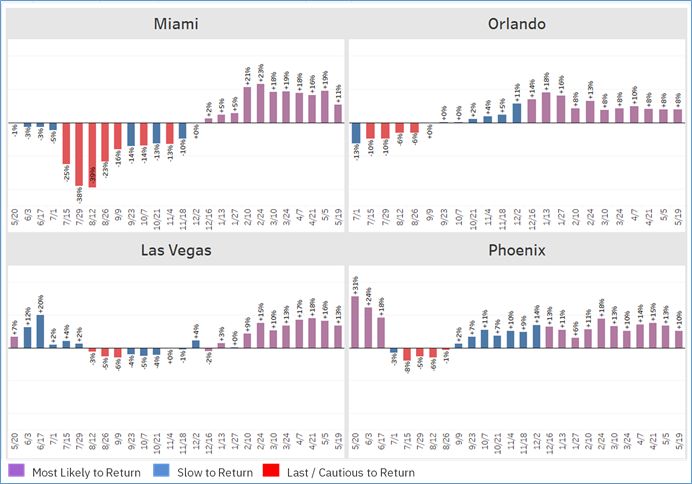
MARKET ANALYSIS
The KAGR Fan Demand Index jumped over 10% week over week, with several markets seeing decreases in
recent confirm COVID-19 cases, strong vaccination rates, and increases in consumer behaviors.
• COVID-19 Cases down 23%: 27 of 32 markets saw recent confirmed COVID-19 case numbers
decrease
o Significant decreases were seen in New York City (-62%), Detroit (-52%), and Philadelphia
(-50%)
o The overall number of recent confirmed COVID-19 cases (per 1,000) also dropped to 1.3
(from 1.9 on May 6th). The lowest per capita markets remains Los Angeles (0.3), San
Francisco (0.5), and Oklahoma City (0.6); highest is still Detroit (2.9, down from 6.0 on
May 6th)
o Tracking Percent of Positive Tests across markets: 23 of the 32 markets have percent of
positive COVID-19 tests below the 5% threshold (up 6 from last report). The average
percent positive tests metric this week was 4% (down from 4.9% last report)
o The percent of vaccine rollout by market: rollout of one shot (45%) is up 8% in the past
two weeks
Markets with highest percent of the population vaccinated include: Boston (61%),
Pittsburgh (54%), and Philadelphia (54%)
Markets with the lowest vaccinated rate include: Tuscaloosa (34%) and New
Orleans (34%)
• Consumers Behaviors up significantly across markets:
o Economic mobility2 increased 14.6% this week, with visits to casual dining restaurants
and grocery stores as key drivers
Positive week-over-week changes occurred in all 32 markets, including Chicago
(+20%), Oklahoma City (19%), and Tampa and New York City both at +18%
Ranking of markets by economic mobility2:
• Pittsburgh has the highest mobility value (95 out of 100)
• Miami has the lowest (75 out of 100)
This week four markets moved groupings – two markets moved from Slow to Return to Most Likely to
Return and two markets in the reverse direction (Figure 1). As all markets welcome fans, we will be
transitioning our market grouping labels to be better reflect the impact of the market’s indicators on
willingness to attend and overall demand. In this issue we shift our Last to Return grouping to Cautious to
Return. Check out market changes over time in our interactive Fan Demand Index visual.
F IGURE 1 . KAGR FAN DEMAND INDEX*
BY RECENT CONFIRMED CASES
* KAGR Fan Demand index uses a variety of market data including COVID-19 factors, economic indicators, and other
consumer behavior information
2 A measure of economic activity using consumer shopping behavior and visits to businesses
2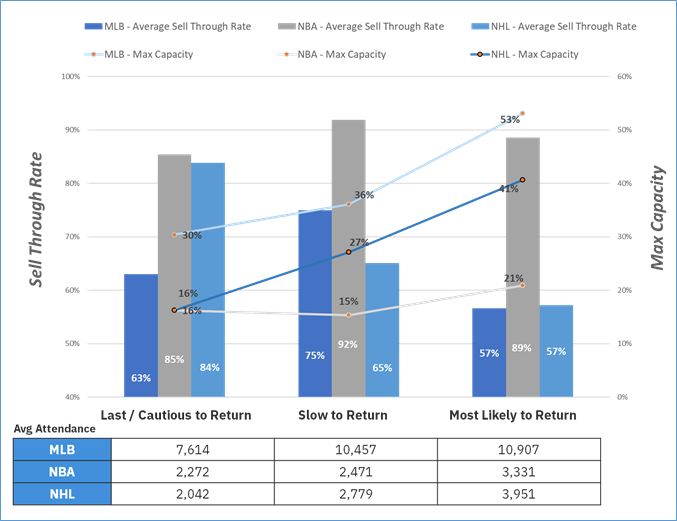
Specific markets insights include:

            • Positive Change: Slow to Return to Most Likely to Return
                    o Detroit moved back to Most Likely to Return (after 4 weeks) with a decrease in
                      recent confirmed COVID-19 cases (-52%) and increase in dining and
                      entertainment activity (+12%)
                    o Pittsburgh also moved up this week; recent confirmed COVID-19 cases are
                      down 31%. Pittsburgh also has the second highest vaccination rate across
                      market for at least one-shot (54%)
            • Negative Change: Most Likely to Return to Slow to Return
                    o Cleveland dropped to Slow to Return with a decrease in in dining and
                      entertainment activity (-19%); vaccination rate for one-shot is also low
                      compared to other markets (42%)
                    o Austin also dropped this week; Austin is amongst the lowest vaccination rate
                      across markets (40%) and saw gradual declines in dining and entertainment
                      activity (-2%)
KAGR FAN DEMAND INDEX CHANGES: YEAR-OVER-YEAR REVIEW
As we continue to explore trends, we will be watching the impact of vaccination rates on market and fan
behaviors, including:
            • For which markets will vaccination significantly impact fan demand?
            • Will fan demographics change in markets where vaccination rates are lower?
            • How will leagues and teams be impacted as COVID-19 cases fluctuate?

                  FI GURE 2. % CHANGE I N KAGR FAN DEMAND I ND EX
                                 (MAY 202 0-MAY 202 1)

In Figure 2, we explore change in the KAGR Fan Demand Index between May 2020 and May 2021. Some
year-over-year highlights include:
             • New York City and San Francisco consistently held the lowest KAGR Fan Demand Index
            • Tuscaloosa, Oklahoma City, and Houston remained three of the highest ranked markets
            • Beyond New York City and San Francisco, the largest year-over-year KAGR Fan Demand Index
              change was seen by Boston, Washington D.C., and New Orleans
            • Southeast, Southwest, and Midwest markets held significantly higher KAGR Fan Demand Index
              over Northeast and West markets

                                                                                                          3
MARKET INDICATOR TRENDS

We have collected and analyzed a diverse dataset from a wide range of data sources including public
health and government data, consumer and service industry information, and numerous publications. In
Figure 3, we look at three key indicators across all markets: air travel, dining and entertainment, and
consumer behaviors.
          • Dining and entertainment activity had the most significant recovery over the
            past year (+70%)
          • Current air travel aligns most closely to pre-pandemic levels
          • Consumer behaviors was the least impacted in May 2020 and has improved
            62% over the past year

       FIGURE 3. % CHANGE IN REPRESENTATION MARKET INDI CATORS
                           (MAY 2020-MAY 2021)

                                                                                                          4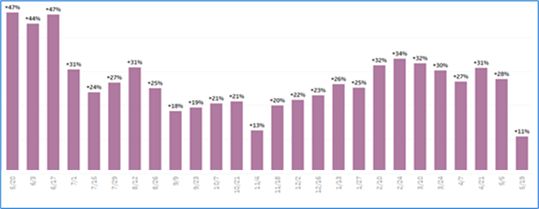
MARKET DEEP DIVE: MOST VOLATILE MARKETS

 Four markets experienced the greatest fluctuations in KAGR Fan Demand Index compared to others
 (Figure 4): Miami, Orlando, Las Vegas, and Phoenix. These markets saw sizable increases in
 COVID-19 cases in July 2020 and January 2021, and a sharp increase in fan demand once COVID-19
 cases dropped. Assuming COVID-19 cases stay low, we expect these markets to remain among
 those Most Likely to Return. Highlights for these four markets include:
                • All four markets experienced large increases in COVID-19 cases in July 2020;
                  Miami saw the highest per capita COVID-19 cases (10.1) in late July
                • These markets were also hard hit in January 2021; Phoenix was most impacted
                  with 11.6 COVID-19 cases per capita at that time
As vaccination rates differ across markets, we anticipate some market volatility if COVID-19 cases
start to rise in a material way.

                 FIGURE 4. KAGR FAN DEMAND INDEX VS. ALL MARKETS
                                 (J ULY 2020-MAY 2021)

For a view of all market changes over time, please see our interactive Fan Demand Index visual.

                                                                                                     5
MARKET DEEP DIVE: CONSISTENT MARKET GROUPINGS

Three (of thirty-two) markets remained in the same market groupings throughout the Future of Live
Events and Sports series: New York City (Last / Cautious to Return), Tuscaloosa (Most Likely to
Return), and Indianapolis (Most Likely to Return). Figure 5 and 6 displays market specific KAGR Fan
Demand Index compared to other markets for New York City and Tuscaloosa.

                 FIGURE 5. NEW YORK CITY KAGR FAN DEMAND INDEX
                                (JULY 2020-MAY 2021)

                  FIGURE 6. TUSCALOOSA KAGR FAN DEMAND INDEX
                                ( J ULY 2020-MAY 2021)

The pandemic and market specific restrictions had a significant impact on KAGR Fan Demand Index in New
York City. As the market begins to open, our analysis shows that caution remains and demand for full
stadium events will take time to return. Conversely, KAGR Fan Demand Index was high throughout the
pandemic in Tuscaloosa with strong demand and attendance during this fall’s college football season.

                                                                                                         6
FAN AVIDITY AT A GLANCE
The NFL 2021 schedule officially released on May 12th with strong early demand and rising ticket prices for
several marquee games (Tampa Bay @ New England in Week 4). This week we look at sell-through trends across
markets for MLB, NBA, and NHL teams as the MLB moves into its second month of the season and NBA and
NHL playoffs begin.
MLB, NBA, AND NHL SELL-THROUGH TRENDS
In Figure 7, we examine sell-through over the past two weeks across MLB, NBA, and NHL.
FIGURE 7. MLB, NBA AND NHL SELL-THROUGH ACROSS KAGR
MARKET GROUPINGS (MAY 4 2021-MAY 16 2021)
7SPECIFIC INSIGHTS (FIGURE 7) INCLUDE:
• NBA teams has seen the highest sell-through rate, on average 38% greater than MLB and
33% greater than the NHL. The NBA has the strictest capacity restrictions across leagues;
significantly lower than MLB and NHL in Slow to Return and Most Likely to Return
markets
• The KAGR Slow to Return markets continue to outperform both Most Likely to Return
and Last/Cautious to Return markets across all leagues; the most significant difference is
within the MLB, with Slow to Return markets selling through 26% more
• MLB sell-through has slowly declined since the opening week in early April, with a sharp
drop off across all market groupings
o Most Likely to Return markets:
Opening Day: 94%
Home Games 2-5: 81%
Current: 57%
o Slow to Return markets:
Opening Day: 96%
Home Games 2-5: 90%
Current: 75%
o Last / Cautious to Return markets:
Opening Day: 94%
Home Games 2-5: 74%
Current: 63%
• As leagues return and capacity restrictions are lifted, we will be tracking how
current sell-through compares to pre-pandemic demand. Our goal is to better understand
which leagues and teams may be most impacted. A few early highlights:
o MLB: despite initially strict capacity restrictions, Chicago maintains
the highest sell-through rate (100%). This matches its position as the
most attended KAGR analyzed market prior to the pandemic
o NBA: a handful of markets have shown relative demand on par with
pre-pandemic levels. For example, the Portland Trailblazers recently
opened their arena to fans, and through 2 games have maintained 100%
sell-through. This is consistent with Portland’s previous behavior pre-pandemic
(95%)
With MLS season underway, we will be tracking attendance across markets and begin reporting in the
coming weeks. The first three games show strong early results with attendance double that of NBA and
NHL indoor stadiums.
8Looking for MORE?
What fan demand questions are you looking to answer? We would love to hear from
you.
We welcome your feedback and questions. Please share with us at
FutureSportsandEvents@kagr.com.
FIGURE 8. KAGR FAN DEMAND FRAMEWORK
9You can also read