Amelioration the performance of photovoltaic stations for pumping and lighting installed in the Douar Zragta of the rural commune of Isly ...
←
→
Page content transcription
If your browser does not render page correctly, please read the page content below
J. Mater. Environ. Sci. 2 (S1) (2011) 532-537 Baghaz et al.
ISSN : 2028-2508
CODEN : JMESCN
Colloque International « Journées des Géosciences de l’Environnement »
Oujda, 21, 22 et 23 Juin 2011 « Environnement et développement durable ».
Amelioration the performance of photovoltaic stations for pumping and
lighting installed in the Douar Zragta of the rural commune of Isly
Prefecture of Oujda Angad
E. Baghaz1, R. Gaamouche1, K. Hirech1, M. El Ouariachi1, M. F. Yaden1, T. Mrabti1, B.
Tidhaf2, F. Bagui3, E. Chadli1, K. Kassmi1*
(1)
Mohamed First University Faculty of Science, dépt de Physique, laboratory LETAS, Oujda, Maroc.
(2)
Mohamed First University , ENSA, laboratory, LETAS, Oujda, Maroc.
(3)
Laboratory, IRISE, Ecole d’Ingénieurs Ei CESI, Rouen, France.
*E-mail : khkassmi@yahoo.fr
Abstract
In this paper we present the results on improving the performance of both photovoltaic (PV), lighting and
pumping domestic Douar Zragta installed in the rural municipality of Issly. From the modeling of electrical
PV panels we have deducted the losses of energy provided by the panels in the order of 15-20% and 10% due
to the lack of tracking the sun. All these results allowed us to deduct losses of about 33% of the cost of the
facilities.
Key words: Photovoltaic System (PV), lighting and pumping domestic PV panels, Pspice simulator, loss of
energy, sun tracker, solar controller, solar batteries.
1. Introduction
Today, the sector of the renewable energy of photovoltaic (PV) represents the most realistic alternative that
can address the issue of exhaustion of translational energy and environmental problem [1]. The eastern region
has enormous potential in solar energy, it receives an amount of energy of about 2500 kWh/m² per year. This
is very favorable for the installation of photovoltaic stations of pumping and domestic lighting, and thus their
improvements through the PV systems that are currently news [1-2].
In this framework, we have installed under context Program United Nations of development (PNUD)
Art Gold Morocco two stations, pumping and lighting domestic Douar Zragta to the rural municipality of the
prefecture Isly Oujda Angad. The objective of this initiative is in the one hand contribute to the improvement
of living conditions of the population of isolated sites, and in another hand promote PV systems made in the
laboratory [2]. In this paper we present a description of these stations and the first results in terms of energy
losses due to the absence of PV systems made in the laboratory [2] (MPPT control, tracking the sun, regulator
charge / discharge , ...).
2. Results and discussions
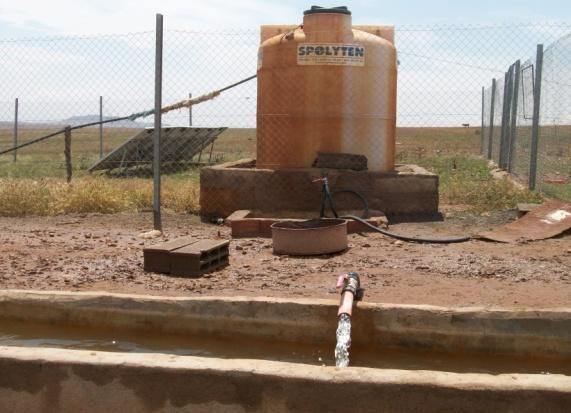
2.1. Photovoltaic stations of pumping the water and domestic lighting
In (Figures 1 and 2) we are showns photographs of two PV stations of lighting and pump installed in Douar
Zragta of the rural commune of Isly Prefecture of Oujda Angad. Station lighting (PV (700 W), classic
532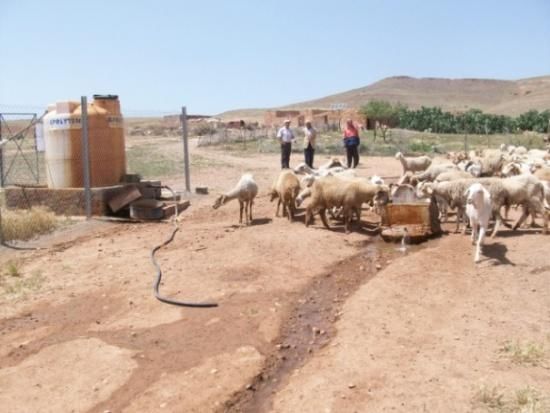
J. Mater. Environ. Sci. 2 (S1) (2011) 532-537                                      Baghaz et al.
ISSN : 2028-2508
CODEN : JMESCN
              Colloque International « Journées des Géosciences de l’Environnement »
            Oujda, 21, 22 et 23 Juin 2011 « Environnement et développement durable ».

controller, batteries (24 V), inverter DC / AC (1 kW, 24 V/220 V.) produces electric energy to light three
hoses of an energy of about 1800 Wh per day. The pumping station (power 1.2 kW) produced over the sun, a
quantity of water of about 20 tons per day.

                            Figure 1: Photovoltaic stations for domestic lighting.

                             Figure 2: Photovoltaic stations pumping for water

2.2. PV Station of lighting
2.2.1. The Electrical operation and the energy loss
We analyzed the electrical functioning of the PV panels used in the two stations. From the Pspice simulator we
deduced the electrical model of PV cells forming the PV. In this paper, we present only the results for lighting
station. The characterization obtained results for two solar radiations, are shown in (Figure 3.) It appears a
very good agreement between experiment and simulation, and an optimum voltage of about 35 V. This value
is very important that fixed by the batteries (24 V). Therefore this installation presents electrical energy losses
[2]. To evaluate these losses we have experienced the full operation of the station and compared the results
with those derived optimal in Pspice (Figure 4). The obtained results show that the power supplied by the PV

                                                       533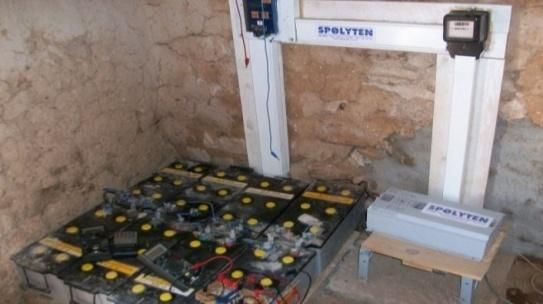
J. Mater. Environ. Sci. 2 (S1) (2011) 532-537                                      Baghaz et al.
             ISSN : 2028-2508
             CODEN : JMESCN
                           Colloque International « Journées des Géosciences de l’Environnement »
                         Oujda, 21, 22 et 23 Juin 2011 « Environnement et développement durable ».

             panels is less than optimal. As shown in Figure 5, the energy losses can reach 20%. The economic study of
             these losses is estimated at 20% of the cost of the complete station. Also, we estimated the energy loss due to
             the lack of tracking the sun to 10% (13% of the cost of station).
                       The overall results show that need the DC-DC converter, MPPT controls [2] and the follower of the
             sun [3] to reduce energy loss and therefore the cost of the facilities. In the following we describe the tracker
             and the controller [4] in progress at the laboratory to reliability and reduce cost of installations.

                    5                                                                                       160
                                                                                                                         Experience:
                                                                                                            140                             2

                    4                                                                                                           Le = 828 W/m ,
                                                                                                            120                             2
                                                                                                                                Le = 587 W/m .

                    3                                                                                       100          Simulation:

                                                                                                  Ppv (W)
          Ipv (A)

                                                                                                                80
                            Experience:
                    2                                                                                           60
                                               2
                                   Le = 828 W/m ,
                                               2
                                   Le = 587 W/m .                                                               40
                    1
                            Simulation:                                                                         20
                    0                                                                                           0
                        0      5       10 15 20 25 30 35 40 45                                                       0      5      10 15 20 25 30 35 40 45
                                                       Vpv (V)                                                                                    Vpv (V)

                                      Figure 3: Simulated and measured Current-Voltage characteristics and Power-Voltage as a
                                                                 function of the solar irradiance.

            500                                                                                          20

            450
                                                                                                         15
            400
                                                                                            Losses (%)
Ppv (W)

            350                                                                                          10

            300
                                       Experience,                                                          5
            250                        Simulation (Optimum).

            200                                                                                             0
              15:15                 15:30           15:45          16:00   16:15   16:30                    15:15         15:30          15:45          16:00   16:15   16:30
                                                            Hour                                                                                 Hour

                              Figure 4: Power measured and simulated (Optimal)                                  Figure 5: Energy losses of the station PV
                                           of station PV lighting                                                              lighting.

                                                                                           534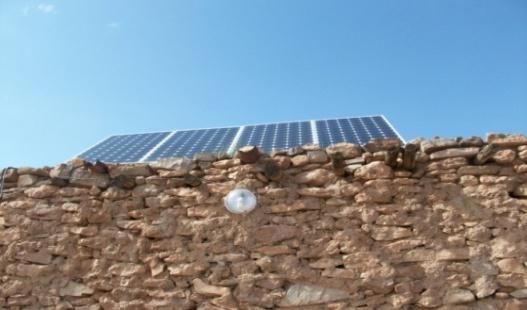
J. Mater. Environ. Sci. 2 (S1) (2011) 532-537 Baghaz et al.
ISSN : 2028-2508
CODEN : JMESCN
Colloque International « Journées des Géosciences de l’Environnement »
Oujda, 21, 22 et 23 Juin 2011 « Environnement et développement durable ».
2.2.2. Reliability of the PV stations by the monitoring of the sun
The further optimization by continuing trajectory of the sun is a technique that allows better use of
photovoltaic cells [3]. Indeed, many works focus their interest on the continuation of the sun to maximize the
capture of sunlight by keeping the active area of solar panels should be perpendicular to the solar radiation.
Different guidance systems are available in commercial and offer trade in accordance with their forms for
reporting gains of around 20-30% depending on the techniques and technologies used. In this context, we are
currently conducting studies to reduce energy losses due to the positioning of the PV station of (Figures 1 and
2). This is based on the development of a control-based PIC microcontroller to control the tracking system in
azimuth and elevation axes (Figure 6):
The azimuth is the position of the sun in its daily movement from east to west.
Elevation is the height of the sun above the horizon, which varies according to season.
In our study, we adopt an approach based control method of programming a closed loop circuit using a
programmable PIC 16F877. It also uses LDR light sensors for detecting the position of the light source, and
two motors to move the panels along the two axes.
The overall system design (Figure 6) allows us to track the maximum power point tracking (MPPT
control), followed by the sun and a better control charge / discharge (next paragraph) numerically.
Figure 6: Synoptic diagram of the overall system
2.2.3. Block charge / discharge of solar batteries
To ensure reliable operation of photovoltaic stations lighting (Figures 1 and 2), we are conducting research on
the block charge / discharge of solar batteries. The objective is to integrate in the same previous PIC
microcontroller (Figure 6), controlling and management of the charge / discharge the battery. Our primary
concern is to improve the management algorithms of solar regulators, and consequently increasing the life of
the battery by avoiding the problems of gassing and deep discharge.
The synoptic diagram of the PV system including the power charge / discharge is shown (Figure 7).
It is based on the order of a DC / DC converter with a PWM signal (Pulse Width Modulation) [2] generated by
535J. Mater. Environ. Sci. 2 (S1) (2011) 532-537 Baghaz et al.
ISSN : 2028-2508
CODEN : JMESCN
Colloque International « Journées des Géosciences de l’Environnement »
Oujda, 21, 22 et 23 Juin 2011 « Environnement et développement durable ».
a PIC16F877 microcontroller. Management charge / discharge of the battery are realized following the
flowchart of (Figure 7) in three phase:
1st phase: normal charging or charging by a constant current (Bulk). This phase is characterized by the
gradual increase in blood to reach about 80% of the state of battery charge.
2nd phase: charging by a constant voltage (absorption phase). It is characterized by a gradual decrease of
the load current to the low values of the order of several tens of mA.
3rd phase (maintenance phase or floating) is then passed to a floating charge phase, that is to say, a
constant voltage charge to keep the battery charged and thus compensate for losses due to self -discharge.
Figure 7: Organization chart control charge / discharge.
Conclusion
In this paper we have described the stations PV (lighting and pumping) and the electrical operation of the
lights station. The results go up that it is not suitable and energy losses can reach 30%. These lines induce loss
of 33% of the cost of installation. Looking ahead, we aim to improve reliability and the two stations by
reducing all energy losses (installation, adaptation, tracking the sun, control charge / discharge ...) and the cost
of installation.
Acknowledgment
This work is supported by:
programme Thématique d’Appui à la Recherche Scientifique (PROTARS III) D43/06,
de la Coopération Marocco-Belge, CUI -2008-2012, « Commission Universitaire Institutionnelle de la
CUD (Coopération Universitaire pour le développement), Energies renouvelables: Photovoltaïques.
programme des Nations Unis au Développement PNUD Art Gold Maroc, 2008 2 ENV OO.
536J. Mater. Environ. Sci. 2 (S1) (2011) 532-537 Baghaz et al.
ISSN : 2028-2508
CODEN : JMESCN
Colloque International « Journées des Géosciences de l’Environnement »
Oujda, 21, 22 et 23 Juin 2011 « Environnement et développement durable ».
Reference
1. Stéphane VIGHETTI « Systèmes photovoltaïques raccordés au réseau :Choix et
dimensionnement des étages de conversion » Thèse de doctorat de L’Université de Grenoble
24 septembre 2010.
2. M. El Ouariachi, T. Mrabti, Ka.Kassmi, K. Kassmi, Analysis, ‘Optimization and Modelling of
Electrical Energies Produced by the Photovoltaic Panels and Systems’, 18th Mediterranean
Conference On Control and Automation, IEEE, ISBN 978-1-4244-8091-3/10/ IEEE. pp: 1614-
1619, 2010
3. M. Serhan and L. El-Chaar « TWO AXES SUN TRACKING SYSTEM: COMPARSION with a
FIXED SYSTEM » International Conference on Renewable Energies and Power Quality
(ICREPQ’10) Granada (Spain), 23th to 25th March, 2010.
4. Hicham Fakham, Di Lu, Bruno Francois, «Power Control Design of a battery charger in a Hybrid
Active PV generator for loadfollowing applications », IEEE Transaction on Industrial
Electronics, Vol. 58, Iss. 1 , pp. 85-94, Jan. 2011
(2011) www.jmaterenvironsci.com
537You can also read