Forced vibration test of pedestrian steel bridge using eccentric mass shaker
←
→
Page content transcription
If your browser does not render page correctly, please read the page content below

IOP Conference Series: Earth and Environmental Science

PAPER • OPEN ACCESS

Forced vibration test of pedestrian steel bridge using eccentric mass
shaker
To cite this article: J I Rastandi et al 2021 IOP Conf. Ser.: Earth Environ. Sci. 622 012010

View the article online for updates and enhancements.

                                This content was downloaded from IP address 46.4.80.155 on 05/09/2021 at 09:51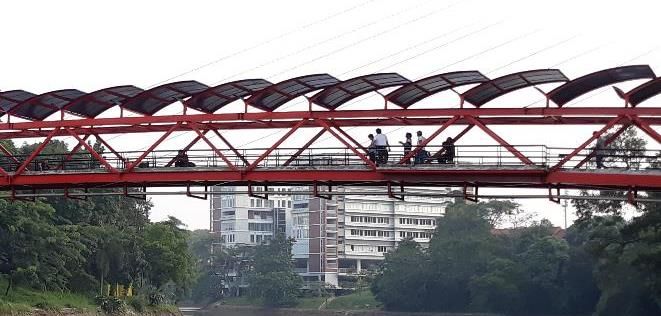
ISCEE 2020                                                                                                     IOP Publishing
IOP Conf. Series: Earth and Environmental Science 622 (2021) 012010                        doi:10.1088/1755-1315/622/1/012010

Forced vibration test of pedestrian steel bridge using eccentric
mass shaker

                     J I Rastandi1, K Pramesti1, and M Orientilize1
                     1
                      Civil Engineering Department, Universitas Indonesia, Depok, Indonesia 16424

                     E-mail: mulia@eng.ui.ac.id

                     Abstract. The dynamic test has been performed on Jembatan Teksas, Universitas Indonesia. The
                     purpose of the test was to obtain the dynamic parameters, which are the natural frequencies, the
                     mode shapes, and the damping ratio. The test was conducted by applied forced excitation using
                     an eccentric mass shaker. The dynamic responses were recorded using accelerometers and
                     vibrometer during forced vibration state and a free vibration state. A comparison study was
                     conducted through the 3D finite element analysis using SAP2000. The test could obtain five
                     mode shapes of the bridge and the damping ratio. Close results were found between FE analysis
                     and the test result. The average damping ratio obtained was 1.72% which was within the range
                     of welding steel structures according to reference. Compared to the test conducted in 2011 and
                     2013, the bridge is in good condition which is indicated by its natural frequency where the current
                     test decrease less than 2%.

1. Introduction
Bridge health monitoring system is a part of structural maintenance to meet the needs for providing safer
transportation. The monitoring is conducted by applying a dynamic load on bridges and analyzing the
response. A dynamic test is usually performed by applying excitation to the structure directly. Periodic
monitoring will result an early detection if damage has been indicated. The results will help the owner
to identify the structural conditions and take immediate repairing. The dynamic response of an elastic
structure is determined based on the natural frequencies, damping and mode shape vibration [1]. There
are three types of dynamic tests; ambient vibration, forced vibration, and free vibration test [2]. Modal
analysis can be used to determine the dynamic parameters [3].
    Several research [4-8] explored the use of forced vibration test (FVT) and experimental modal
analysis to detect damage to existing civil structures. Salawu and Williams [4] conducted a forced-
vibration test on RC bridge with a total length of 104m which consist of 6 spans. The test was conducted
before and after repairing the deck. The hydraulic actuator was used to apply the dynamic load. The
natural frequency of that bridge decrease as 3% after repairing was conducted. The study concluded
that the decrement exceeding 5% indicates that the damage occurred. Hogan et al [7], performed a
dynamic test on a precast RC bridge in Auckland. Eccentric mass shaker was used to generate dynamic
load on transversal and longitudinal direction meanwhile the vertical excitement was generated by an
electrodynamic shaker. The natural frequency and the mode shape were obtained. Setareh dan Gan [8]
reported a dynamic test on steel bridge in Virginia, USA by using an electrodynamic shaker. The results
were compared to a FE analysis, and the difference was about 6%. The dynamic response which
was natural frequency, mode shape and damping ratio was attained.
    Eccentric mass shaker is rarely used for dynamic test of bridges in Indonesia. The dynamic load is
applied traditionally by using vehicles and this is expensive. The use of eccentric mass shaker as an
alternative of force vibration test for bridge health monitoring was introduced. The test was conducted
on a pedestrian bridge, Jembatan Teksas, in Universitas Indonesia. It is a steel-truss footbridge with a
              Content from this work may be used under the terms of the Creative Commons Attribution 3.0 licence. Any further distribution
              of this work must maintain attribution to the author(s) and the title of the work, journal citation and DOI.
Published under licence by IOP Publishing Ltd                          1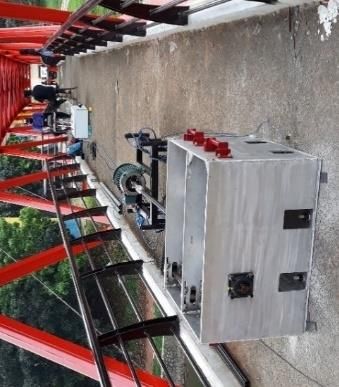
ISCEE 2020                                                                                IOP Publishing
IOP Conf. Series: Earth and Environmental Science 622 (2021) 012010   doi:10.1088/1755-1315/622/1/012010

total span of 84 meters which was opened for public in 2007. As a part of bridge health monitoring
system in the university; dynamic tests had been performed twice, in 2011 [9] and 2013 [10]. The first
test applied impulse excitation using an impulse hammer and the last test was conducted by human
excitations. EMS was employed on the third test conducted in 2020. The excitation is a sinusoidal load.

2. Research Methodology
The dynamic test was conducted by applying sinusoidal force using an ANCO MK-139-10 eccentric
mass shaker. Prior to the test, the FE analysis using SAP2000 was performed to get the general dynamic
response of the bridge and as guide for the dynamic test. Figure 1 shows the bridge and the FE model.
The shaker was placed in the middle of the bridge as shown in figure 2. Excitation was applied in two
directions, horizontal and vertical to get both modes. The accelerometer and laser vibrometer were used
to measure the response of the structure. Four sensors were attached along the length of the bridge, at
the edge (sensor #1), 1/4L (sensor #2), 1/2L (sensor #3), and at 3/4L (sensor #4). The placement was
based on the FE results to ensure that the sensor can capture the particular mode shape. The vibrometer
was located on quarter span (1/4L) and in the middle (1/2L) of the bridge. Natural frequency, mode
shape, and damping ratio were obtained by performing a free and forced vibration test. Furthermore, the
results were compared to dynamic response attained from FE analysis.

                                Figure 1. The bridge and the 3D Model

    Three-dimensional FE modelled as shown in figure 1 was generated by SAP2000. The steel truss has
yield stress as 380 MPa, and the floor was made of K225 concrete with fc’ equals to 18,7 MPa. Two
different connections type were modelled, pinned and rigid connections and the results were compared
to the experiment results to seek the closest assumption. The mass sources include in the model were
the steel deck, the roof, and the handrails.

           Figure 2. Eccentric mass shaker installed on Jembatan Teksas Universitas Indonesia

                                                     2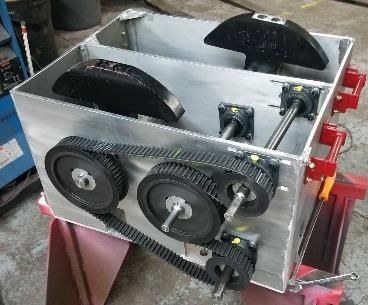
ISCEE 2020                                                                                 IOP Publishing
IOP Conf. Series: Earth and Environmental Science 622 (2021) 012010    doi:10.1088/1755-1315/622/1/012010

   The responses obtained from both the accelerometer and the vibrometer were in time-domain which
were transformed into frequency-domain by the Fast Fourier Transformation (FFT) method [11] by
using SIGVIEW software. The natural frequency of the structure was obtained based on the peak value
of the Frequency Response Function (FRF) where the first peak value is the natural frequency. Half-
power bandwidth method was used to determine the damping ratio of the structure [1]. The mode shape
can be obtained by plotting each accelerometer reading amplitude, which has the same frequency. The
direction of the amplitude can be obtained by checking the imaginary part [11].

3. Results and Discussion

3.1 The Mode Shapes dan The Natural Frequency
Table 1 presents the first six modes as a result of the FE analysis based on two different connection
types of truss element. The mode shapes are shown in Figure 3 – 6. Assuming the connection as a rigid
joint improve the stiffness of the bridge which results in higher frequency. The difference is not
significant in the vertical mode where the difference is only about 1-2%. A significant effect was
detected on first torsion mode; where the natural frequency of rigid connection is 20% higher than
pinned connection. However, the natural frequency of the rigid connection model has closer results to
the experiment than the pinned connection. If data from free vibration is used as a reference, on average,
the difference of rigid connection is about 11% whereas pin connection is 13%. Opposite result was
found if forced vibration was used as a baseline. The natural frequency of pin connection is closer to the
experiment with the difference of 11% whereas the rigid connection was 14%.

      Table 1. The Mode shapes and the natural frequencies obtained from structural modelling
                                                     Natural Frequency (Hz)
            Mode Shapes
                                  Pin Connection          Rigid Connection          Free Vibration
                      st
        Transverse 1 Mode              1.798                   1.976                    1.829
                 st
        Vertical 1 Mode                1.997                   2.026                    2.413
                 st
        Torsion 1 Mode                 2.743                   3.294                     NA
                      nd
        Transverse 2 Mode              4.109                   4.588                    3.685
        Vertical 2nd Mode              4.600                   4.700                    5.503
        Torsion 2nd Mode               5.982                   6.345                    6.085

                           (a)                                                (b)
     Figure 3. The first and the second transverse mode shapes; (a) FE analysis; (b) dynamic test

                                                     3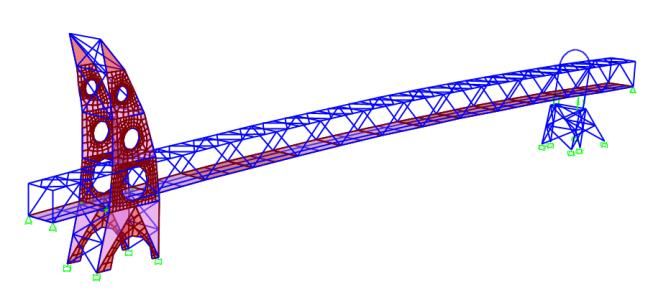
ISCEE 2020                                                                                IOP Publishing
IOP Conf. Series: Earth and Environmental Science 622 (2021) 012010   doi:10.1088/1755-1315/622/1/012010

                         (a)                                                (b)
       Figure 4. The first and the second vertical mode shapes; (a) FE analysis (b) dynamic test

                                                   (a)

                                                   (b)
   Figure 5. The first torsional mode shapes based on the FE analysis; (a) side view; (b) top view

                                                   (a)

                                                   (b)
  Figure 6. The second torsional mode shapes based on the FE analysis; (a) side view; (b) top view

                                                   (a)

                                                   (b)
   Figure 7. Torsion second mode shape obtained from the dynamic test. (a) side view; (b) top view

                                                     4
ISCEE 2020                                                                                          IOP Publishing
IOP Conf. Series: Earth and Environmental Science 622 (2021) 012010             doi:10.1088/1755-1315/622/1/012010

    Table 2 list the comparison of natural frequency attained from the free and forced vibration test. As
presented, the results are almost similar to the deviation is around 0,1% to 2,9%. However, the test
could not capture the first torsion mode. This is due to the placement of the accelerometers that were
located in the longitudinal centerline of the bridge. Since the first mode is pure torsion, hence it could
not detect the mode. Meanwhile, the second torsional mode has a transversal movement, therefore it can
be acquired by the accelerometer. The movements are shown in Figure 5(b) and Figure 6(b). It seems
that the accelerometer should be located at the edge of the bridge width near the handrail to catch the
first mode. The measurement from accelerometer was compared to vibrometer and presented in Table
3. Both sensors have similar results where the difference was less than 2%.

     Table 2. Comparison of natural frequency obtained from forced vibration and free vibration
                                                                 Frequency (Hz)
                Mode
                                        Forced Vibration       Free Vibration        Deviation    Average
                     st
       Transverse 1 Mode                     1.827                 1.829                0.1%       1.828
                st
       Vertical 1 Mode                       2.409                 2.413                0.2%       2.411
                st
       Torsion 1 Mode                         NA                    NA                   -               -
                     nd
       Transverse 2 Mode                     3.578                 3.685                2.9%       3.632
                nd
       Vertical 2 Mode                       5.450                 5.503                1%         5.477
                nd
       Torsion 2 Mode                        6.093                 6.085                0.1%       6.089

        Table 3. Comparison of natural frequency measured by accelerometer and vibrometer
                                                                 Frequency (Hz)
                Mode
                                            Accelerometer                  Vibrometer            Deviation
       Transverse 1st Mode                      1.828                           1.827              0%
       Vertical 1st Mode                        2.411                           2.367              2%
                st
       Torsion 1 Mode                            NA                             NA                   -
                     nd
       Transverse 2 Mode                        3.632                           3.568              2%
                nd
       Vertical 2 Mode                          5.477                           5.514              1%
                nd
       Torsion 2 Mode                           6.089                           6.038              1%

3.2. The Damping Ratio
The damping ratio determined by the half-power bandwidth method presented in Table 4. The ratio
varies from 1.3% to 2.0%, with the average ratio of 1.72%. The value is within the range of the damping
ratio suggested by Newmark and Hall [12], where the welded steel structure has the ratio of 2 to 3%.

                          Table 4. The damping ratio of the bridge based on dynamic test
                                                                    Damping
                                                Mode
                                                                     Ratio
                                       Transverse 1st Mode           2.0%
                                       Vertical 1st Mode              1.9%
                                       Transverse 2nd Mode            1.4%
                                       Vertical 2nd Mode              2.0%
                                       Torsion 2nd Mode               1.3%

                                                           5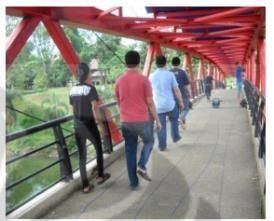
ISCEE 2020                                                                                 IOP Publishing
IOP Conf. Series: Earth and Environmental Science 622 (2021) 012010    doi:10.1088/1755-1315/622/1/012010

3.3. The Comparison to the Previous Test
As mentioned earlier, the bridge has been tested twice, in 2011 and 2013. Excitation was applied by a
hammer in 2011 and human in 2013 as shown in Figure 8. The natural frequency of three dynamic tests
is compared and presented in Table 5. As presented, except torsion, the frequency does not change much
within seven years where the difference is relatively small, 0,4% – 2%. Refer to reference [4], the data
indicate that the bridge is in “healthy condition”. Unfortunately, the frequency of the second mode of
torsion decrease by 20% compared to the year of 2013. This value exceeds the maximum allowance
decrement suggested by Salawu and Williams, which is limited to 5% [4]. However, based on physical
examination in the field, there was no damage observed on the bridge. The result of 2013 related to
second torsional mode is unacceptable since the gap with other mode shapes is too large. Moreover,
test on 2013 relied only from one sensor and accelerometer, whereas the 2020 test consists of four
sensors, accelerometers and vibrometer. Therefore, in the next few years, the dynamic test should ensure
to capture the natural frequency of the second mode of torsion to verify the decrement. Based on 2020
test, it can be concluded that the bridge is in good condition without any damage.

                             (a)                                                 (b)

                    Figure 8. Dynamic Test of Jembatan Teksas (a) 2011; (b) 2013

             Table 5. Comparison of frequencies obtained with the previous dynamic tests
                                                           Frequency (Hz)
                   Mode
                                    Test in 2011    Test in 2013      Test in 2020     Deviation
          Transverse 1st Mode           1.818            NA              1.831           1%
          Vertical 1st Mode             2.457            2.441           2.410           2%
          Torsion 1st Mode              3.69             2.930            NA               -
                        nd
          Transverse 2 Mode              NA              NA              3.661             -
                   nd
          Vertical 2 Mode               5.55             5.493           5.530           0.4%
                   nd
          Torsion 2 Mode                 NA              7.570           6.051           20%

4. Conclusion
The forced vibration test conducted on Jembatan Teksas Universitas Indonesia could identify three
important dynamic parameters, which are the first five modes, the natural frequency and also the
damping ratio of the bridge. However, it is important to put the sensors on an appropriate location to
capture the desired mode shape. Preliminary study with the FE analysis is suggested to guide the field-
test.

                                                     6
ISCEE 2020 IOP Publishing
IOP Conf. Series: Earth and Environmental Science 622 (2021) 012010 doi:10.1088/1755-1315/622/1/012010
The test found the similar natural frequency measured from accelerometer, vibrometer and the FE
analysis. The FE results are close to the experiment when truss connection is assumed as pin rather than
rigid, with a deviation of 11%. The change of natural frequency of the bridge within seven years is less
than 5% which indicate that there is no damage and the bridge is in a good condition.
Acknowledgement
Universitas Indonesia supports this work through Hibah PUTI, contract number: NKB-
1186/UN2.RST/HKP.05.00/2020
References
[1] Chopra A K 2006 Dynamics of Structure: Theory and Applications to Earthquake Engineering
(New Jersey: Pearson Education, Inc.)
[2] Cunha A and Caetano E 2006 Experimental modal analysis of civil engineering structures Sound
& Vibration 40 pp 12-20.
[3] He J and Fu Z F 2001 Modal Analysis (Oxford: Butterworth-Heinemann)
[4] Salawu O S and Williams C 1995 Bridge assessment using forced-vibration testing, ASCE
Journal of Structural Engineering 121 pp 161-173.
[5] Dyke S J, Bernal D, Beck J L, and Ventura C July 2003 Experimental Phase II of the Structural
Health Monitoring Benchmark Problem, 16th ASCE Engineering Mechanics Conference,
Seattle, WA.
[6] Maeck J 2003 Damage Assessment of Civil Engineering Structures by Vibration Monitoring, PhD
Thesis Civil Engineering Department, K. U. Leuven.
[7] Hogan L S, Wotherspoon L, Beskhyroun S, and Ingham J 2016 Dynamic field testing of a three-
span precast-concrete bridge ASCE Journal of Bridge Engineering 21 pp 1-5.
[8] Setareh M and Gan S 2018 Vibration testing, analysis, and human-structure interaction of a
slender footbridge ASCE Journal of Performance of Constructed Facilities 32 pp 1-5.
[9] Rifki M 2011 Analisis Periode Getar dan Redaman Struktur Jembatan Teksas Berdasarkan Data
Pengukuran Vibrasi, Bachelor’s Thesis Universitas Indonesia, Depok, Indonesia.
[10] Zulhaida N 2013 Identifikasi Karakteristik Dinamik Jembatan Teksas Dengan Monitoring
Vibrasi, Thesis Universitas Indonesia, Depok, Indonesia.
[11] Bracewell R N 2000 The Fourier Transform and Its Application (New York McGraw Hill)
[12] Newmark N M and Hall W J 1982 Earthquake Spectra and Design (California: Earthquake
Engineering Research Institute)
7You can also read