Time-frequency energy analysis of deepwater explosion shock wave signals based on HHT
←
→
Page content transcription
If your browser does not render page correctly, please read the page content below
MATEC Web of Conferences 336, 01017 (2021) https://doi.org/10.1051/matecconf/202133601017
CSCNS2020

 Time-frequency energy analysis of deepwater
 explosion shock wave signals based on HHT
 Linna Li1, and Yue You1, *
 1 College of Science, Wuhan University of Science and Technology, 430065 Wuhan, China

 Abstract. In order to study the time-frequency characteristics of shock
 wave signals under deep water explosion conditions, experiments are
 performed using water medium explosion containers to simulate different
 water depth conditions, and signal analysis is performed on the shock wave
 data obtained in the experiments. Traditional time-frequency analysis
 methods such as Fourier transform and wavelet transform have many
 limitations on deep-water explosion shock wave signal analysis, the HHT
 method is used to analyse the experimental data from the three-dimensional
 Hilbert spectrum, marginal spectrum and instantaneous energy spectrum.
 The results show that the time-frequency method can effectively extract the
 frequency components of the deep-water explosion load signal in different
 periods. It provides a reference for people to understand the time frequency
 characteristics of shock wave signals in deep water.

 1 Introduction
 With the rapid development of engineering explosion technology, explosion technology
 has been developed from the first military research to civil water explosion projects, such as
 channel widening, wharf construction and water conservancy facilities construction, etc.
 People are paying more and more attention to the safety and damage of engineering
 explosions Features [1]. Therefore, the research on underwater shock waves has important
 practical significance.
 In the 1820s, Fourier transform was widely used in the field of signal processing as a
 classic signal analysis technique after Fourier put forward the “Analytical Theory of Heat
 Conduction” [2]. It can transform the time series samples in the time domain into the
 spectrum in the frequency domain, but it cannot reflect the changes of local instantaneous
 frequency, so it is only suitable for quasi-steady-state signals.
 At present, the most widely used tool for processing nonstationary signals is wavelet
 analysis, which was introduced by French physicist Morley in the 1980s [3]. Wavelet
 transform uses wavelet windows to solve the contradiction of time frequency resolution,
 which is obtained in blasting signal analysis. It has a wide range of applications. Literature
 [4] uses wavelet packet technology to analyse the energy propagation law of blasting signals
 under different blasting conditions, Hubei Provincial Key Laboratory Fund of Metallurgical
 Industry Process System Science. And deepens people’s understanding of the harm of

 *
 Corresponding author: 2591107497@qq.com

© The Authors, published by EDP Sciences. This is an open access article distributed under the terms of the Creative Commons
Attribution License 4.0 (http://creativecommons.org/licenses/by/4.0/).
MATEC Web of Conferences 336, 01017 (2021) https://doi.org/10.1051/matecconf/202133601017
CSCNS2020

 blasting vibration mechanism; However, the diversity of wavelet bases leads to problems in
 the choice of wavelet bases.
 Hilbert-Huang signal processing method [5] was proposed by Chinese American N.E.
 Huang et al. in 1988. HHT is an adaptive transformation method that does not need to choose
 a wavelet basis, and is suitable for analysing non-stationary signals [6]. This method breaks
 the limit of the uncertainty principle and shows better resolution in time-rate analysis. It has
 been applied to many fields. Therefore, this paper uses the HHT method to analyse the shock
 wave signal of deep water explosion, observe the change of the shock wave signal’s
 frequency with time and learn the time frequency energy distribution the characteristics of
 the shock wave signal in the deep water environment.

 2 Introduction to HHT principle

 2.1 EMD decomposition
 In the stepwise decomposition of the EMD method, the intrinsic modal function must meet
 two conditions: (1) In the entire data sequence, the number of signal extreme points and zero-
 crossing points are the same or differ by one; (2) The local signal at any point in time The
 maximum and minimum points are fitted to obtain a set of upper and lower envelopes, the
 local mean of which is zero, which means that the upper and lower envelopes are locally
 symmetric about the time axis. Any complex signal can be decomposed into the sum of n
 IMF components. Specific steps are as follows:
 First, find all the maximum and minimum values of the original signal x(t), and use cubic
 spline interpolation to fit the local maximum and minimum to draw the upper and lower
 envelopes. And calculate the mean envelope m1(t) of the upper and lower envelopes. Subtract
 m1(t) from the original sequence x(t) to get the new sequence h1(t):

 x(t) = m1(t)− h1(t) (1)

 Then, judge whether this h1(t) satisfies the two conditions of the intrinsic modal function.
 If the conditions are met, the first IMF component is decomposed; if not, based on the signal
 h1(t), repeat the above process n times, until the condition is met. The acquisition of IMF
 components usually requires several iterations.
 Through the above process, the first IMF component is obtained as c1(t), and then c1(t)
 is separated to obtain the difference signal r1(t):

 r1(t) = x(t)− c1(t) (2)

 Finally, take r1(t) as a new data sequence, repeat the above process to get the second
 component c2(t), repeat n times until the end of the loop.
 When the residual becomes a monotonic function and no IMF component can be
 decomposed, the decomposition process of EMD is terminated. The original signal x(t) is
 equivalent to the combination of many IMF components and a residual term (t),

 ∑ =1 ( ) + ( ) (3)

 2.2 Hilbert transform
 The Hilbert transform transforms the IMF components to obtain the instantaneous frequency.
 The sum of the instantaneous frequencies of all IMF components is the Hilbert spectrum.

 2
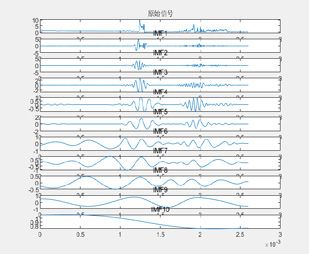
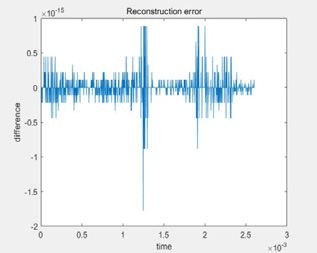
MATEC Web of Conferences 336, 01017 (2021) https://doi.org/10.1051/matecconf/202133601017
CSCNS2020

 Defined ( )as the instantaneous amplitude, and ( ) is the instantaneous phase,

 ℎ( , ) = Re ∑ =1 ( ) ( ) (4)

 ( )
 The instantaneous frequency is ( ) .Integrate the Hilbert spectrum over time to

 obtain the marginal spectrum:
 ∞
 ℎ( ) = � ℎ( , ) (5)
 −∞

 Finally, the square of the amplitude is integrated with the frequency, and the instantaneous
 energy spectrum is defined by the above marginal spectrum:
 ∞
 ( ) = ∫ 2 ( , ) (6)

 3 Deep water explosion experiment
 10g TNT equivalent can simulate a cylindrical underwater explosion container with a water
 depth of 200m. The test conditions are as follows: the mass of the TNT charge is 1g, the
 distance between the measuring point and the explosive is 0.25m, and the explosive and the
 measuring point are at the same water depth, 0.5Mpa simulates a water depth of 50m.

 4 EMD decomposition and signal reconstruction
 The underwater explosion shock wave signal is decomposed by EMD, and the reconstructed
 signal and the error distribution diagram between the reconstructed signal and the measured
 signal are obtained.
 It can be seen from Figure 1 and Figure 2 that the relative error between the reconstructed
 signal obtained by EDM decomposition and the measured signal is only about 10−15 , and it
 has a high degree of consistency. The EMD method reflects the signal characteristics with
 high accuracy and is suitable for signal analysis of deep water explosion shock waves.

 Fig. 1. Original signal. Fig. 2. Reconstruction error. Fig. 3. IMF component of the
 original signal.
 The original signal is decomposed into 10 IMF components and 1 margin, and
 decomposed from high frequency to low frequency according to the time scale. Each IMF
 component displays the characteristics of the original signal with a different resolution.
 Among them, IMF1-IMF3 belong to the high-frequency part and occupy less energy; IMF4-
 IMF6 are the dominant frequency bands of the original signal, and the corresponding
 amplitude is larger, which is the concentrated frequency band of signal energy; IMF7-IMF10
 are the low frequency part of the shock wave signal; The last margin r represents the average
 trend of the signal, and the amplitude is small. It can be seen from this that EMD

 3
MATEC Web of Conferences 336, 01017 (2021) https://doi.org/10.1051/matecconf/202133601017
CSCNS2020

 decomposition does not need to set any restrictions, and the original signal can be
 decomposed into a limited number of IMF components according to the characteristics of the
 signal itself, there will be no omissions or losses, and the adaptability and reconstruction are
 strong.

 5 Quantitative analysis
 Through the HHT method, we have obtained the time domain diagram and instantaneous
 energy spectrum of different hydraulic shock wave loads under the same dosage as shown in
 Figure 6 and Figure 7. It can be seen from the comparison of the two figures that the three-
 dimensional Hilbert spectrum clearly reflects the transient characteristics of the shock wave
 signal. You can see the distribution of the energy of the signal over time and frequency, more
 comprehensively showing the corresponding relationship between the energy and the
 fluctuation time history, and it has good consistency with the original signal time domain
 diagram. The four peaks appearing under the four water pressures are roughly 0.8ms, 1.25ms,
 2ms, and 2ms. The appearance time of the maximum amplitude of the original signal just
 corresponds to the energy peak of the instantaneous energy spectrum. It shows that this
 method has advantages in studying the energy distribution of shock wave signal in time. The
 four pictures of the three groups of experiments indicate that the water pressure environment
 is at 0mpa, 0.5mpa, 1mpa, and 2mpa.

 Fig. 4. Time domain diagram of shock wave load pressure signal.

 Fig. 5. Instantaneous energy spectrum.

 Fig. 6. Marginal spectrum.
 The Hilbert energy spectrum more intuitively shows the accumulation of energy at different
 instantaneous frequencies over time. We processed the experimental data to obtain the
 instantaneous energy spectra of the shock wave load signals measured by four different
 hydraulic pressures. By observing the energy spectra, the relative energy of each frequency
 band can be obtained more accurately. It is found by comparison that under the same dose
 and distance, as the water pressure deepens, the shock wave reaches the sensor and quickly
 reaches its peak value. The water depth shown in the figure has little effect on the shock wave

 4
MATEC Web of Conferences 336, 01017 (2021) https://doi.org/10.1051/matecconf/202133601017
CSCNS2020

 peak value. Observation from the marginal spectrum in Figure 8 shows that as time goes by,
 the energy is gradually attenuating and tends to develop towards low frequencies. It shows
 that not only the pressure peak is caused by the shock wave damage, but the low frequency
 band will also affect the structure. The dominant frequency of shock wave signal is mainly
 concentrated within 50khz, especially the low frequency energy below 20khz is the largest.

 6 Conclusion
 Analyse the measured underwater explosion shock wave signal based on the HHT method.
 From the Hilbert energy spectrum and the marginal spectrum analysis, it is found that the
 dominant frequency of the shock wave signal is mainly concentrated within 50khz, especially
 the low frequency energy below 20khz is the largest, and they are all concentrated in the low
 frequency part, which is basically consistent with the empirical theoretical value. In terms of
 signal analysis, the HHT method shows strong resolution and recognition capabilities.
 Experiment comparison found that under the same dose and distance, as the water
 pressure deepened, the shock wave reached the sensor and reached the peak quickly,
 indicating that the water depth had no obvious influence on the shock wave peak.

 References
 1. Q. Yin. The Status and Trends of Underwater Explosion Research, ST, pp. 8–14 (2003)
 2. X. Li.Extraction of micro seismic wave forms characteristics prior to rock burst using
 Hilbert–Huang transform, M, 91 (2016)
 3. H. Jia.Research on Time-Frequency Characteristics of Underwater Explosion Signal of
 Metal Detonating Cord Based on HHT, EB, 21, pp. 5–8 (2015)
 4. T. Ling, X. Li, T.H. Ling , X.B.Li.The Energy Distribution Law of Blasting Vibration
 Signals in Different Frequency Bands, JCSU (Natural Science Edition), pp. 310–315
 (2004)
 5. L. Cheng, J. Wang,L. Cheng and J.Wang. HHT-based analysis of the characteristics of
 underwater explosion shock wave signals, SW, 16, pp. 25–27( 2010)
 6. S. Hui, Q.R.Si, C. Ning, Y. Shouqi.HHT-based feature extraction of pump operation
 instability under cavitation conditions through motor current signal analysis, M. Syst.
 S.P, 139, (2020)
 7. W.Wu, J.Wu. Non-stationary signal analysis based on HHT and machine learning,
 UESTC, (2019)

 5
You can also read