Crash Course: Data Analysis & Presentation Week 1 - Jordan Krell - Flint Science Fair
←
→
Page content transcription
If your browser does not render page correctly, please read the page content below
Crash Course:
Data Analysis & Presentation

Week 1

Jordan Krell
jkrell@flintsciencefair.org
Safety
• Your safety is paramount
   – Please read our virtual handbook
   – If at any point you feel unsafe, logout immediately and contact the FRSEF.

• Read the FRSEF Virtual Programming Handbook
   – In your email

• Contact us in an Emergency or for Routine Assistance
   – Jordan: 248-330-4269          jkrell@flintsciencefair.org
   – FRSEF: 810-797-5290           kdutton@flintsciencefair.org

2/16/2021                            FlintScienceFair.org                 2

Data Acquisition &
Measurement
Poor measurement and acquisition cannot be fixed by excellent analysis

2/16/2021                       FlintScienceFair.org               3
Measurement Setup If logging data yourself
• What is your logging setup?
   – Logger
       • If analog measurement, how many bit ADC?
            – Why is this important??
   – Sensor / s
       • What can be measured?
       • Are you using the proper sensor type for the measurement?
            – Range
            – % error
   – Calibration

2/16/2021                                   FlintScienceFair.org     4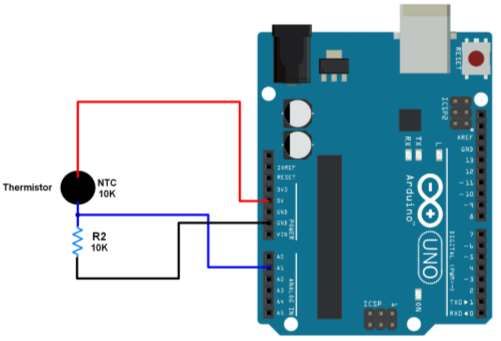
Sensor Selection - Accelerometer
• Exercise to select an accelerometer for helmet impact testing
   – What’s important for our measurement?

A) ST LIS3DH                    B) ST H3LIS331                              3) AD ADXL377            4) AD ADXL326
• 3-axis                        • 3-axis                                    • 3-axis                 • 3-axis
• ±2, 4, 8, 16g                 • ±100g, ± 200g, ± 400g                     • ± 200g                 • ± 16g
  – 10 bit (2^10 = 1024)          – 16 bit (2^16 = 65536)
                                                                            • 0.5 – 1 kHz output     • 0.5 – 1 kHz output
                                  – 800/65536 = 0.0122 g /
  – 16/1023 = 0.01564 g /            increment                              • Analog output          • Analog output
      increment
                                • 0.5 – 1 kHz output                        • Nonlinearity: ± 0.5%   • Nonlinearity: ± 0.3%
• 1-5 kHz output
                                • I2C / SPI output                          • Temp Sensitivity: ±    • Temp Sensitivity: ± 0.01%/C
• I2C / SPI output
                                • Nonlinearity: 2%                            0.02%/C
• Temp Sensitivity: ± 0.01%/C
                                • Temp Sensitivity: ± 0.01%/C

2/16/2021                                            FlintScienceFair.org                                        5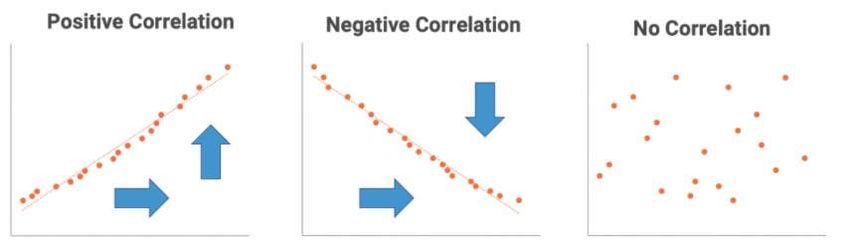
Sensor Selection - Temperature
• Select a temperature sensor
   – Best Insulation to Use
   – Lowering the Freezing Point of Water
   – Thermal Efficiency of Different Bio-Fuels
A) DS18B20 Probe                B) Type K Thermocouple          C) Temp Sticker               D) Thermistor
• Range: -55 to 125 °C Range    • Range: 0 to 400 °C Range      • Range: -30 to 70 °C Range   • Range: -40 to 125 °C Range
• Interface: 12bit ADC (4096)   • Interface: Analog amplifier • Interface: NTC Thermistor,    • Interface: NTC Thermistor,
                                                                use voltage divider             use voltage divider
• Resolution: 0.0625°C          • ±2°C accuracy
                                                                • ±2°C accuracy               • ±2% accuracy
• ±0.5°C accuracy from -10°C    • Time Constant: 20 s
  to +85°C                                                      • Time Constant: 10 s         • Time Constant: 2 s
• Time Constant: 180 s

2/17/2021                                           FlintScienceFair.org                                   6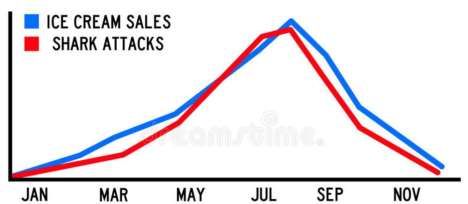
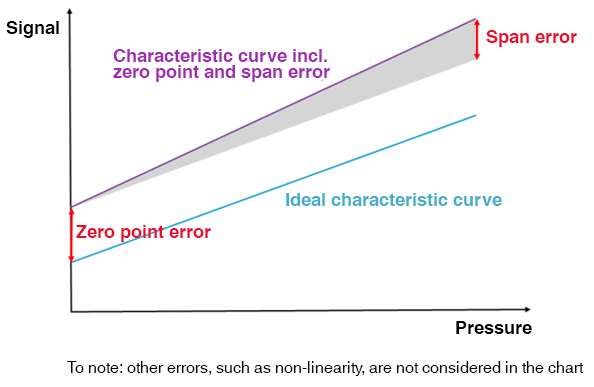
Sensor – Error & Calibration
• Zero-point error – The start of the measuring range is too high or too low (this is the zero
  offset), thus shifting the entire scale up or down by that zero offset value.

• Span error – The distances between the individual divisions (the span) from the zero point
  to the full-scale value are even but wrong, which has the effect of magnifying errors at the
  upper end of the scale.

• Non-linearity – The distances between the individual divisions from the zero point to the
  full-scale value are not even (non-linear), thus making the ideal straight line into a curve.

https://blog.wika.us/knowhow/pressure-sensor-accuracy-3-errors/

2/17/2021                                           FlintScienceFair.org               7
Sensor – Error & Calibration

2/17/2021            FlintScienceFair.org   8
Sensor – Thermistor Measurement
• Thermistor: changes resistance
  with temperature
• Use a voltage divider to
  measure the resistance of the
  thermistor

   – R1: Known resistor
   – R2: Thermistor

2/17/2021                     FlintScienceFair.org   9
Sensor – Error & Calibration
                                                                    Voltage Output Relative to Temperature
                                                                    same thermistor resistance, varied pull-down resistance
• Thermistor with a 10kΩ pull-up                           5

  resistor (20% error)
   – -30°C                                                 4

       • +10%: -28°C

                                      Voltage Output (V)
                                                           3
       • -10%: -32°C
   – 25°C                                                  2
       • +10%: 23°C
       • -10%: 27°C                                        1
   – 60°C
       • +10%: 57°C                                        0
       • -10%: 63°C                                         -50.0    -30.0   -10.0   10.0   30.0   50.0    70.0   90.0        110.0   130.0   150.0
                                                                                             Temperature (C)
   – 100°C
       • +10%: 97°C                                                           10KOhm         10KOhm -10%          10KOhm +10%

       • -10%: 103°C

2/17/2021                      FlintScienceFair.org                                                                      10
Know Your Sensor & How It Works • What does our measurement mean? – pH – Turbidity • Critical to know your sensor – What is changing on the sensor (resistance, capacitance, etc) – Limitations – Sources of error – Find the data sheet! • Judges will often ask about sources of error and how this can be reduced. 2/16/2021 FlintScienceFair.org 11
What can all be measured?
• Petri dish samples

2/16/2021              FlintScienceFair.org   12
Data Presentation
Share your work so it can be understood.

2/16/2021                       FlintScienceFair.org   13
Communications: What is our goal + how will it be seen / viewed?
Science and Engineering Fair
• What is our goal?
   – Share the results of our research.
       • Hypothesis is supported or not supported
       • Design solves a problem and fits our design criteria
       • How external factors have / do not have an effect

• How will it be viewed?
   – Preliminary Judging (5-6 judges)
       • 10-15 minutes for judges to learn about your project and score.
   – Finalist Judging (5-6 judges)
       • 12 minute Zoom interviews

2/17/2021                                     FlintScienceFair.org         14
Communications: What is our goal + how will it be seen / viewed?
Internal Design Reviews
• What is our goal?
– Approve a product for sale to customers
• Product is safe for all customer scenarios
• Product meets all design requirements
• How will it be viewed?
– In-depth design review meeting
• 2-3 hour meeting to review with 5-10 colleagues
– Report review
• Report emailed and on drive for many to view on their own time
2/17/2021 FlintScienceFair.org 15Communicating - Visuals
Process: Sorting Skittles Step 1: Open bag of
Skittles
by color
1) Open bag of Skittles
and pour onto a table Step 2: Group
Skittles by color.
2) Group Skittles by color
3) Count the number of
each color
Step 3: Count the number of each color.
2/17/2021 FlintScienceFair.org 16What is our goal? • Communicate our results: what tells us more? After conducting an analysis of the outcome with 3 trials, the Energizer Alkaline lasted an average of 9.5 hours, the Duracell Alkaline an average of 9.2 hours and the Panasonic Heavy Duty an average of 5.1 hours. https://www.sciencebuddies.org/science-fair-projects/science-fair/data- analysis-graphs 2/16/2021 FlintScienceFair.org 17
Graph Etiquette
• Title
• Axis Labels
   – Include units
• Legend / Key
• Readability
   – Background
   – Colors
   – Excess Precision

2/16/2021               FlintScienceFair.org   18
Graph Etiquette - Colors

                                        Battery Life Over Time                                                                                   Battery Life Over Time
                                  (average of 5 flash light tests @ 70°C)                                                                  (average of 5 flash light tests @ 70°C)
                       1.6                                                                                                      1.6
                       1.4                                                                                                      1.4
 Battery Voltage (V)

                                                                                                          Battery Voltage (V)
                       1.2                                                                                                      1.2
                         1                                                                                                        1
                       0.8                                                                                                      0.8
                       0.6                                                                                                      0.6
                       0.4                                                                                                      0.4
                       0.2                                                                                                      0.2
                         0                                                                                                        0
                             0   0.25     0.5     0.75       1     1.25       1.5   1.75     2                                        0   0.25     0.5     0.75       1     1.25       1.5   1.75   2
                                                   Run Time (hours)                                                                                         Run Time (hours)

                                        Brand A          Brand B          Brand C                                                                Brand A          Brand B          Brand C

2/16/2021                                                                                  FlintScienceFair.org                                                                         19
Graph Etiquette - Consistency
Battery Life Over Time Battery Life Over Time
(average of 5 flash light tests @ 70°C) (average of 5 flash light tests @ 0°C)
1.6 1.5
1.4
Battery Voltage (V)
Battery Voltage (V)
1.25
1.2
1 1
0.8 0.75
0.6 0.5
0.4
0.2 0.25
0 0
0 0.25 0.5 0.75 1 1.25 1.5 1.75 2 0 0.4 0.8 1.2 1.6 2
Run Time (hours) Run Time (hours)
Brand A Brand B Brand C Brand A Brand B Brand C
2/17/2021 FlintScienceFair.org 20Graph Etiquette - Consistency
Battery Life Over Time Battery Life Over Time
(average of 5 flash light tests @ 0°C) (average of 5 flash light tests @ 70°C)
1.6 1.6
1.4 1.4
Battery Voltage (V)
Battery Voltage (V)
1.2 1.2
1 1
0.8 0.8
0.6 0.6
0.4 0.4
0.2 0.2
0 0
0 0.25 0.5 0.75 1 1.25 1.5 1.75 2 0 0.25 0.5 0.75 1 1.25 1.5 1.75 2
Run Time (hours) Run Time (hours)
Brand A Brand B Brand C Brand A Brand B Brand C
2/16/2021 FlintScienceFair.org 21Graph Etiquette – “Cable News” Graphs
• For a bar chart our baseline always needs to be 0
Favorite Fruit Survey Favorite Fruit Survey
25 23
22
20
21
# of People
# of People
15 20
10 19
18
5
17
0 16
Apple Pear Strawberry Banana Apple Pear Strawberry Banana
Fruit Fruit
2/16/2021 FlintScienceFair.org 22Graph – Layout Rule of Thumb
Battery Life Over Time
• X-Axis: Independent Variable (average of 5 flash light tests @ 70°C)
– What we are changing 2
Battery Voltage (V)
1.5
1
• Y-Axis: Dependent Variable 0.5
– The outcome 0
0 0.25 0.5 0.75 1 1.25 1.5 1.75 2
Run Time (hours)
• Battery Experiment Brand A Brand B Brand C
– Independent Variable: Run time of flashlight
– Dependent Variable: Battery voltage
2/16/2021 FlintScienceFair.org 23What is our goal? • Communicating: How is our data changing over time – Line Chart – Scatter Plot (with connecting lines, aka line chart w/ dots) – Bar Chart (each time period is a bar) – Box Plot (advanced, will show at end) • Examples are data from a survey of 50 people – Survey sent each month – Ask participants to choose their favorite fruit – Goal: Does someone’s favorite fruit change throughout the year 2/18/2021 FlintScienceFair.org 24
Change Over Time – Bar Chart
• Bar Chart (each time period is a bar) https://chartio.com/learn/charts/bar-chart-complete-guide/
        – Good choice if your independent variable is not numerical
                    • Standard bar chart (left)
                    • Stacked bar chart (right)

                              Favorite Fruit by Month                                                                 Favorite Fruit by Month
               30                                                                                         60

               25                                                                                         50

               20                                                                                         40
 # of People

                                                                                            # of People
               15                                                                                         30

               10                                                                                         20

                5                                                                                         10

                0                                                                                         0
                       June       July        August     September    October                                  June       July        August     September    October

2/18/2021                Apple   Watermelon     Strawberry   Banana        FlintScienceFair.org                  Apple   Watermelon     Strawberry   Banana
                                                                                                                                                      25
Hints – Color is Your Friend
• If applicable: have your colors match the impression of the item
– Apple: red
– Banana: yellow
Favorite Fruit by Month Favorite Fruit by Month
30 30
25 25
20 20
# of People
# of People
15 15
10 10
5 5
0 0
June July August September October June July August September October
2/18/2021 Apple Watermelon Strawberry Banana FlintScienceFair.org Apple Watermelon Strawberry Banana
26Change Over Time
• Line Chart and Scatter Plot w/ lines
– Good choice if your independent variable is numerical
• Line chart (left)
• Scatter plot w/ lines (right)
Favorite Fruit by Month Favorite Fruit by Month
30 30
25 25
20 20
# of People
# of People
15 15
10 10
5 5
0 0
June July August September October June July August September October
2/18/2021 Apple Watermelon Strawberry Banana FlintScienceFair.org Apple Watermelon Strawberry 27 BananaHints – More is Not Always Better • Think about what you want to communicate – Good: clearly able to see logins are greater than other activities – Bad: Difficult to determine differences between Entry, Message, xxxx 2/18/2021 FlintScienceFair.org 28
Hints – Baseline Value
• Think about what you want to communicate
   – For Line Chart: Emphasize changes in value

2/18/2021                          FlintScienceFair.org   29
Hints – Dual Axis
• We can compare different dependent variable variables on a 1 graph
   – Be consistent with your axis scaling (don’t place a large offset on the scaling)

2/18/2021                             FlintScienceFair.org                  30
What is our goal?
• Communicating: Observe relationships between groups
   – Scatter Plot
   – Bubble Chart
   – Grouped Bar Chart

• Examples are data from a survey of 50 people
   – Survey sent each month
   – Ask participants to choose their favorite fruit
   – Goal: Does someone’s favorite fruit change throughout the year

2/18/2021                           FlintScienceFair.org              31
Relationship Between Groups
• Scatter Plot                                                             https://chartio.com/learn/charts/what-is-a-scatter-plot/
   – Good choice for determining correlation between groups, finding outliers, versatile
                                  • Scatter Plot (left)
                                  • Scatter plot w/ color for favorite fruit

                                                                                                                                                        Fruit Eaten / month (lbs)
                                                 Fruit Eaten / month (lbs)                                                                                 color signifies favorite fruit
                                  30                                                                                                     30

                                                                                                          Fruit Consumed / Month (lbs)
   Fruit Consumed / Month (lbs)

                                  25                                                                                                     25

                                  20                                                                                                     20

                                  15                                                                                                     15
                                                                                                                                         10
                                  10
                                                                                                                                         5
                                  5
                                                                                                                                         0
                                  0
                                                                                                                                              11   12        13     14      15      16       17      18   19
                                       11   12     13    14     15    16      17    18      19
                                                                                                                                                                     Respondent Age
                                                          Respondent Age

2/18/2021                                                                                FlintScienceFair.org                                      Apple      Watermelon     Strawberry     Banana
                                                                                                                                                                                            32
Relationship Between Groups
• Bubble Chart
– Good choice for determining correlation between groups, finding outliers, versatile
Fruit Eaten / month (lbs)
color signifies favorite fruit
bubble size based on workouts / month (0-30)
30
Fruit Consumed / Month (lbs)
25
20
15
10
5
0
11 12 13 14 15 16 17 18 19
Age of Respondent
Apple Watermelon Strawberry Banana
2/18/2021 FlintScienceFair.org 33Correlation • Correlation: the relationship between the two variables – How much does one variable affect the other? – Positive correlation: Both variables move in the same direction – Negative correlation: Variables move in opposite directions – No correlation: No link between the two variables https://mylearningsinaiml.wordpress.com/2018/11/21/scatter-plots/ https://astutesolutions.com/blog/articles/causation-vs-correlation 2/18/2021 FlintScienceFair.org 34
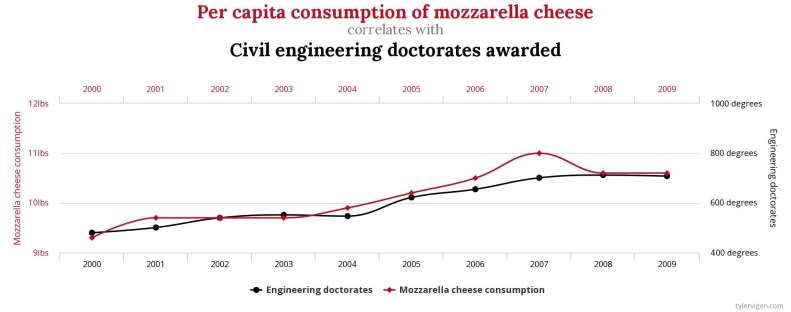
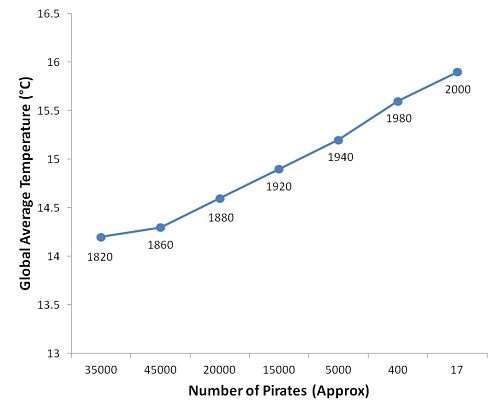
Correlation =/ Causation
• Correlation: A change in one variable mirrored by a positive or
  negative change in the other.
   – Spurious Correlation: strong relationships between variables that are not
     caused by one another.
• Causation: One variable is changing as a result of the other variable.

2/18/2021                            FlintScienceFair.org                 35
Correlation =/ Causation 2/18/2021 FlintScienceFair.org 36
Correlation =/ Causation

2/18/2021            FlintScienceFair.org   37
What is our goal?
• Communicating: How our data is distributed
   –   Bar Chart
   –   Histogram
   –   Density Curve
   –   Box Plot (advanced, will show at end)

• Examples are data from a survey of 50 people
   – Survey sent each month
   – Ask participants to choose their favorite fruit
   – Goal: Does someone’s favorite fruit change throughout the year

2/18/2021                             FlintScienceFair.org            38
Data Distribution
• Histogram
   – Plots the distribution of a numeric variable’s values as a series of bars
   – The x-axis values are “binned” together (ex. each hour is binned together)

   https://chartio.com/learn/charts/histogram-complete-guide/

2/18/2021                                             FlintScienceFair.org   39
Data Distribution
• Histogram
   – Very good at showing the distribution of our data

2/18/2021                            FlintScienceFair.org   40
What is our goal?
• Communicating: Part to Whole Comparison (understanding the
  components that make up the total)
   –   Pie Chart
   –   Doughnut Chart (pie chart w/ the center missing)
   –   Stacked Bar Chart
   –   Stacked Area Chart

• Examples are data from a survey of 50 people
   – Survey sent each month
   – Ask participants to choose their favorite fruit
   – Goal: Does someone’s favorite fruit change throughout the year

2/18/2021                              FlintScienceFair.org           41
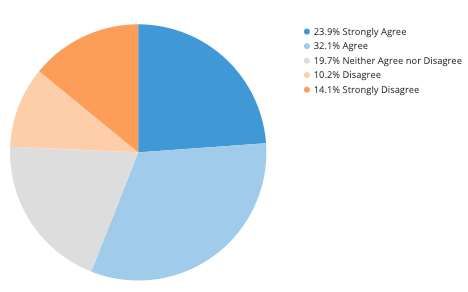
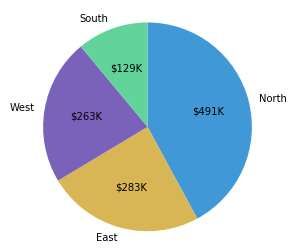
Part to Whole Comparison
• Pie Chart
– Comparing each variable relative to the whole data set
– Only use for the above use case
Revenue by Region
https://chartio.com/learn/charts/pie-chart-complete-guide/
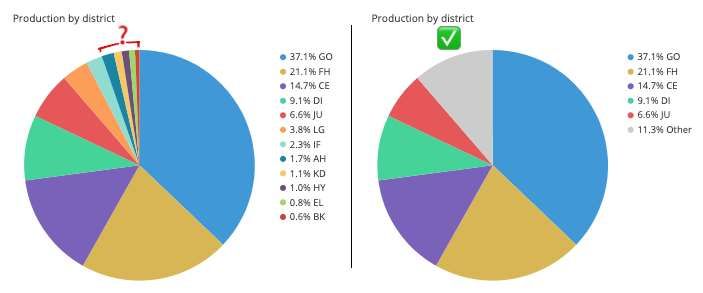
2/18/2021 FlintScienceFair.org 42Hints – Pie Chart • Include annotations (%, value) • Order slices by size • Limit the number of slices – Group many “small” slices into “other” 2/18/2021 FlintScienceFair.org 43
Part to Whole Comparison
• Area Chart                                                                 https://chartio.com/learn/charts/area-chart-complete-guide/
        – Line Chart + Bar Chart
        – Very powerful if the whole is also changing (left: same # / month; right: different # / month)

                            Favorite Fruit by Month                                                                Favorite Fruit by Month
               60                                                                                      70

               50                                                                                      60

                                                                                                       50
               40
 # of People

                                                                                         # of People
                                                                                                       40
               30
                                                                                                       30
               20
                                                                                                       20
               10                                                                                      10

                0                                                                                      0
                 June           July            August      September    October                        June       July                August          September   October

                        Apple      Watermelon      Strawberry   Banana                                         Apple      Watermelon      Strawberry     Banana
2/18/2021                                                                   FlintScienceFair.org                                                          44
Uncertainty • What is uncertainty? – The variability of our measurement. • How do we communicate our uncertainty? – Uncertainty / Error bars – Uncertainty shading – Box plots 2/18/2021 FlintScienceFair.org 45
Error Bars

2/18/2021    FlintScienceFair.org   46
Shading for uncertainty
• An alternative to error bars is to add shading for uncertainty.

2/18/2021                        FlintScienceFair.org               47
Box Plot
• Combines many concepts               https://chartio.com/resources/tutorials/what-is-a-box-plot/
   – Provides a 5 number summary in 1 graph
       •    Minimum
       •    Maximum
       •    Median (Average)
       •    First Quartile (25%)
       •    Third Quartile (75%)

2/18/2021                          FlintScienceFair.org                             48
Box Plot 2/18/2021 FlintScienceFair.org 49
Thank You!
            Reach out anytime:

            Jordan Krell
            jkrell@flintsciencefair.org

2/16/2021    FlintScienceFair.org         50
You can also read