STATEWIDE CLIMATE SUMMARY JULY 2021 - IN THIS ISSUE Monthly Highlights pg. 2 Statewide Temperatures ..pg. 3 Statewide ...
←
→
Page content transcription
If your browser does not render page correctly, please read the page content below
STATEWIDE CLIMATE
    SUMMARY JULY 2021

            IN THIS ISSUE

    Monthly Highlights…………………pg. 2
    Statewide Temperatures………..pg. 3
    Statewide Precipitation………….pg. 6
    Wild ire Activity……………………..pg. 8
    State of the Sea Ice………………..pg. 10
    Newsworthy Information………..pg. 12
f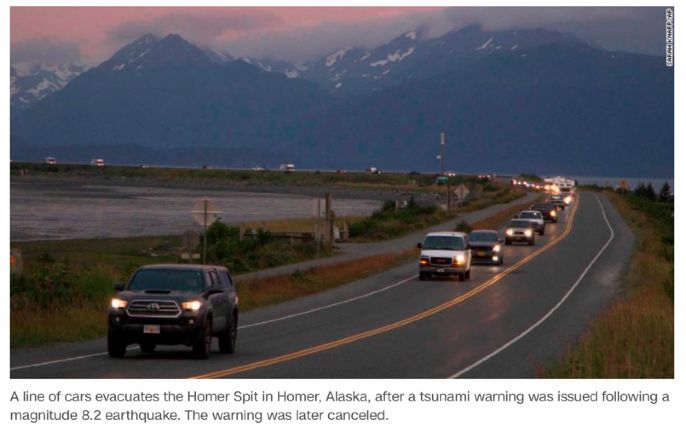
ALASKA CLIMATE RESEARCH CENTER

        A
                laska’s Statewide Climate Summary for July 2021 provides an overview of weather
                for the month based on data from selected weather stations throughout the
                state. “Departure from normal” refers to the climatological average over the
        1991-2020 normal period. Here, we report on temperature, precipitation and drought
        conditions in the state, as well as the condition of the Arctic sea ice.

                                         HIGHLIGHTS

              Signi icant weather and temperature contrasts persisted between
                             the West Coast and the Eastern Interior.
                Warmer than usual temperatures were observed for parts of the
               Interior, the North Slope and the Panhandle with cooler than usual
                               temperatures along the West Coast.

             New precipitation records were observed along the West Coast
               of the state. Kotzebue’s precipitation total is the highest
                 monthly precipitation on record for the month of July.

                 While a relatively moderate ire season so far, a few large
               wild ires and smoke have threatened Alaska’s Interior. Widely
             dispersed smoke from devastating wild ires in Siberia mixed with
                                       local smoke.

        2
f
    f
                               f
                                           f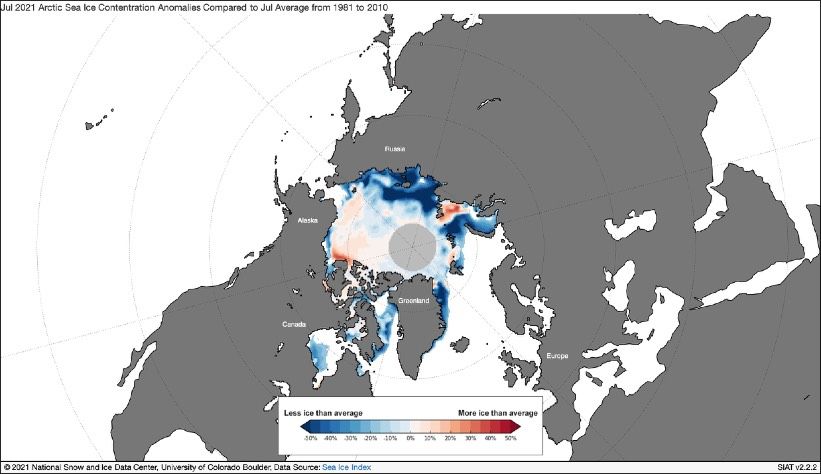
ALASKA CLIMATE RESEARCH CENTER

    Temperature

    Signi icant temperature di erences persisted during the month of July. While the
    West Coast and Northern Gulf were notably colder than the climatological mean,
    warmer temperatures were observed across regions of the Eastern Interior, parts of
    the North Slope and the Southern Panhandle. Warm temperature departures were
    recorded in Fairbanks (+1.8 ºF), Delta Junction (+1.2 ºF) and Juneau (+1.6 ºF). Along
    the west coast, cool temperature departures up to almost -2 ºF were measured in
    Kotzebue (-1.9 ºF); Figure 1 and Table 1 also show negative departures for Bethel
    (-1.7 ºF), King Salmon (-1.6 ºF) and Nome (-1.4 ºF), while Climate Reanalyzer imagery
    (Figure 2) reveals the western/eastern contrast in warmer and cooler than average
    temperatures in the state for the month. Figure 3 shows daily time series of
    temperature deviations for each of the irst-order stations. With the exception of
    the Southern Panhandle and the Aleutians, the statewide temperature series shows
    a period of colder temperatures during the irst 2 weeks of July, followed by
    warmer temperatures in the middle of the month. Overall, near-normal
    temperatures persisted at St. Paul Island and Cold Bay.

        Figure 1. Monthly mean temperature departure from normal, July 2021, for selected stations around the state of Alaska.

    3
f
                           ff
                                                f
                                                          f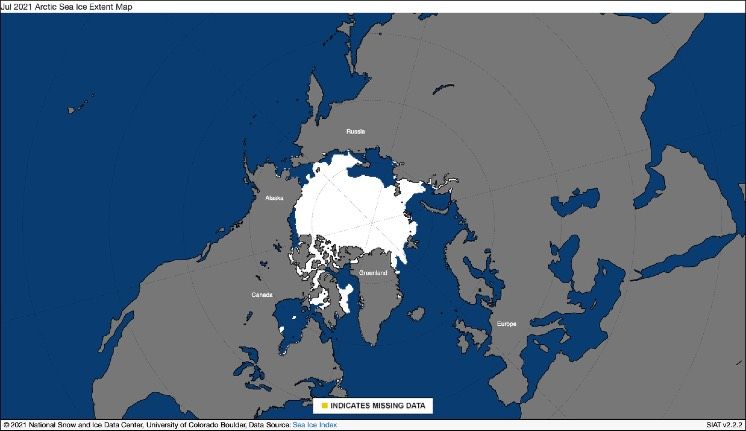
ALASKA CLIMATE RESEARCH CENTER

       Figure 2. ERA-5 gridded temperature anomalies for the month of July 2021 compared to the long-term climatological mean
                                          (source: Climate Reanalyzer, University of Maine).

                 Figure 3. Daily mean temperature departures for each day in July 2021 at the selected stations.

4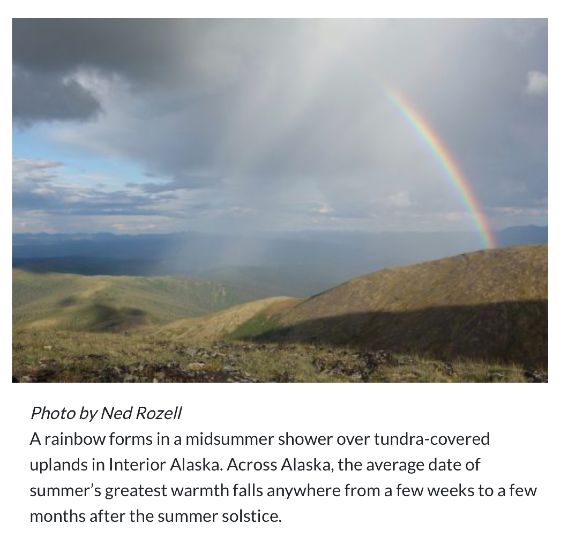
ALASKA CLIMATE RESEARCH CENTER

                         Station              Observed (ºF)              Normal (ºF)            Departure (ºF)

                  Anchorage                          59.1                     59.6                      -0.5

                  Bethel                            54.6                      56.3                      -1.7

                  Bettles                           59.4                      59.8                      -0.4

                  Cold Bay                          52.0                      51.6                      0.4

                  Delta Junction                     61.9                     60.7                      1.2

                  Fairbanks                         64.8                      62.9                      1.9

                  Gulkana                            58.7                     57.9                      0.8

                  Homer                              55.5                     56.1                      -0.7

                  Juneau                            58.6                      57.0                      1.6

                  Ketchikan                         60.0                      58.8                      1.2

                  King Salmon                        55.1                     56.8                      -1.6

                  Kodiak                            55.8                      56.2                      -0.3

                  Kotzebue                          53.4                      55.3                      -1.9

                  McGrath                           60.5                      60.8                      -0.6

                  Nome                              50.6                      52.0                      -1.4

                  St. Paul Island                   48.3                      47.9                      0.4

                  Talkeetna                         59.5                      60.1                      -0.5

                  Utqiaġvik                          41.6                     41.7                      -0.1

                  Yakutat                           54.5                      55.4                      -0.9

         Table 1. Mean monthly air temperature, normal (1991-2020) and departure for selected stations throughout
         the state, July 2021. Color-coded to Figure 1 (yellow-orange-red = warmer than usual; shades of blue = cooler
                                                         than usual).

The overall lower temperatures for the month along the west coast of Alaska are
tied to multiple rainfall events, with a sometimes stagnant low-pressure cyclone
bringing multiple storms through the area and, with that, increases in precipitation.
As the Arctic gets warmer, sea ice melts earlier, and ocean temperatures get
warmer, it is likely that more extreme weather patterns may occur in the future
(NSIDC).

5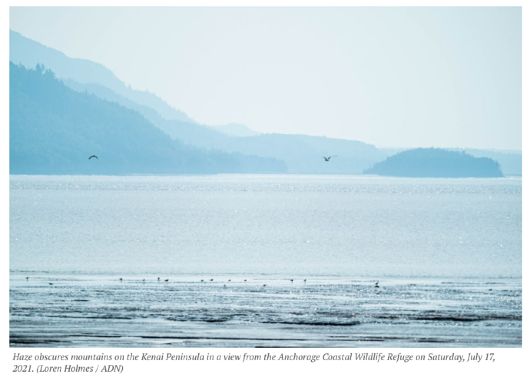
ALASKA CLIMATE RESEARCH CENTER

     Precipitation

     It has been a wet July for western Alaska, with Kotzebue seeing record rainfall for the
     month and Nome seeing some of the wettest days in its climate history near the end of
     the month. Looking particularly at Kotzebue, its July was “bookended” with two heavy
     rain events: the irst on July 5-7, when it saw a total of 2.2” of precipitation during this
     timeframe, and the other at the end of the month (July 30), with the middle of the month,
     July 11 - 23, seeing some but not a lot of precipitation. As of July 31st, July 2021 became
     the wettest month on record for Kotzebue, with 5.31” of total precipitation, with the
     previous wettest month being August 1998. On July 13th, rare Arctic thunderstorms
     occurred east of Point Barrow. A weather front moving east across the Chukchi Sea
     kicked o these storms, leading to the 3rd event since July 10th, where several weather
     fronts have created rare thunderstorms over the cold waters of the Chukchi and Beaufort
     Seas. An area of high pressure across the Gulf of Alaska kept most rain at bay for the
     Southwest Coast, with the ridge acting like a wall, preventing rain from making it further
     east. Reporting stations in the Eastern Interior of the state and along the Panhandle had
     lower than usual precipitation for the month, with signi icant below-normal precipitation

                Figure 4. Monthly mean precipitation departure from normal (in percent), July 2021, for selected stations around
                                                             the state of Alaska.

     6
ff
            f
                                                                          f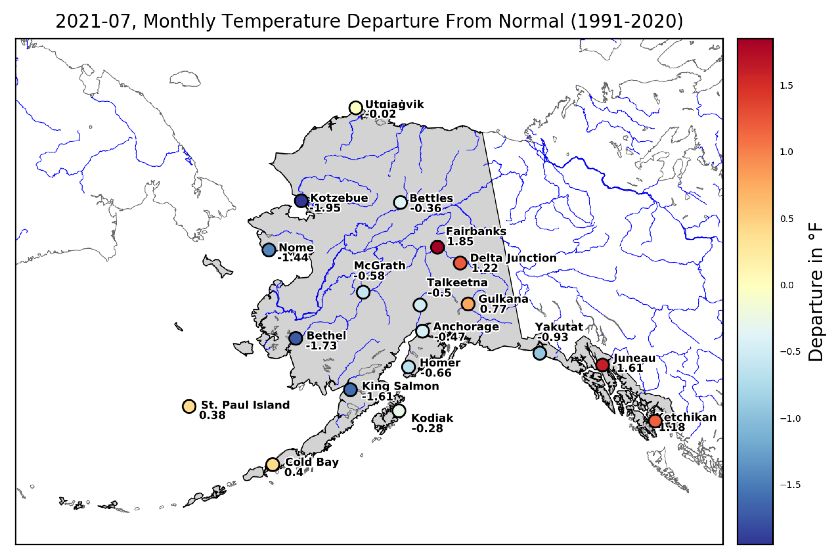
ALASKA CLIMATE RESEARCH CENTER

          Figure 5. Monthly precipitation sums for June 2021 at the selected stations compared to the normal
                                                (1991-2020), in inches.

recorded in Delta Junction (50% of normal), Gulkana (52% of normal) and Juneau (50% of
normal). Above-normal precipitation was observed along the North Slope (Utqiaġvik, with
181% of normal) and along the West Coast with most notable departures at Kotzebue
(332% of normal) and Nome (273% of normal) (Figure 4; Table 2). Figure 5 shows the
monthly precipitation sums for July 2021 at the selected stations compared to the normal
(1991-2020), in inches.

Drought

The U.S. drought monitor shows abnormally dry and moderate drought conditions
for the Interior and eastern part of the state, and even dropping down into the
upper part of Cook Inlet. This is consistent with the low amounts of precipitation
seen in these parts of the state for the month of July (e.g., Anchorage received only
68% of normal precipitation for the month). Figure 6 has been produced through a
collaboration of the USDA, NOAA and the National Drought Mitigation Center.

7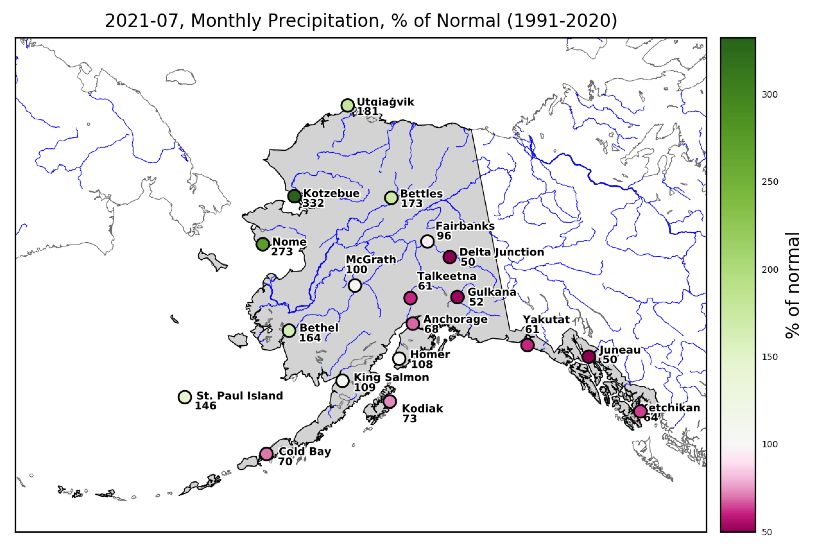
ALASKA CLIMATE RESEARCH CENTER

                             Station              Precipitation (in)            Normal (in)                 % of Normal

                    Anchorage                             1.2                         1.8                        67.6

                    Bethel                                4.2                         2.6                       164.2

                    Bettles                               4.0                         2.3                        172.8

                    Cold Bay                              1.8                         2.5                        70.1

                    Delta Junction                        1.2                         2.4                        50.2

                    Fairbanks                             2.2                         2.3                        96.5

                    Gulkana                               0.9                         1.7                        52.3

                    Homer                                 1.6                         1.5                        107.6

                    Juneau                                2.6                         5.1                        49.6

                    Ketchikan                             4.7                         7.3                         64

                    King Salmon                           2.7                         2.5                       109.3

                    Kodiak                                3.3                         4.5                        73.2

                    Kotzebue                              5.3                         1.6                       332.5

                    McGrath                               2.5                         2.5                       100.0

                    Nome                                  6.4                         2.4                       272.8

                    St. Paul Island                       2.9                         2.0                       146.0

                    Talkeetna                             1.7                         2.9                        60.6

                    Utqiaġvik                             1.8                         1.0                       180.6

                    Yakutat                               4.7                         7.6                        61.2

        Table 2. Monthly precipitation sum, normal (1991-2020) and departure expressed as a percentage of the normal (1991-2020) for
                    selected stations throughout the state, July 2021. Shades of purple and green correlate with Figure 4.

    Wild ire Activity

    As of August 1, 2021, the year-to-date ires total 353, with 208,935 acres burned.
    The majority (225) are human-caused, with 118 caused by lightning and 10 with an
    undetermined cause. It is a relatively slow ire season so far in Alaska but several

    8
f
                                              f
                                                     f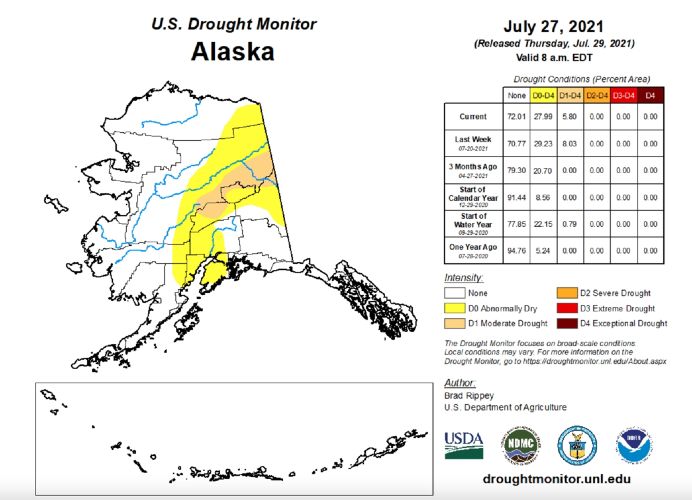
ALASKA CLIMATE RESEARCH CENTER
Figure 6: U.S. Drought Monitor map for Alaska, updated on July 27, 2021. The table on the right shows the percent area
a ected by di erent categories of drought intensity. Figures and data produced and released by the U.S. Drought Monitor,
a partnership between the National Drought Mitigation Center at the University of Nebraska-Lincoln, the United States
Department of Agriculture, and the National Oceanic and Atmospheric Administration (https://droughtmonitor.unl.edu).
large/persistent ires, of which the Munson Creek is the largest, have been
responsible for several periods of poor air quality in the Fairbanks region. Notably,
during the July 19 - 22 timeframe, smoke from the Sischu and Munson Creek ires
dropped visibility in Fairbanks on July 22 to 2-3 miles. Please check our UAFSmoke
website at http://smoke.alaska.edu for current and updated ire information.
UAFSmoke shows current wild ire status information and up to 72 hours forecast of
concentration of black carbon and particulate matter included in wild ire smoke.
Unprecedented wild ire activity has been occurring in Russia this summer. To date,
during this wild ire season, over 11,000 forest ires have burned an area of more
than 6 million hectares (14.8 million acres). Regions across Siberia and Eastern
Russia are predominantly devastated by the ires. Tons of smoke from the Russian
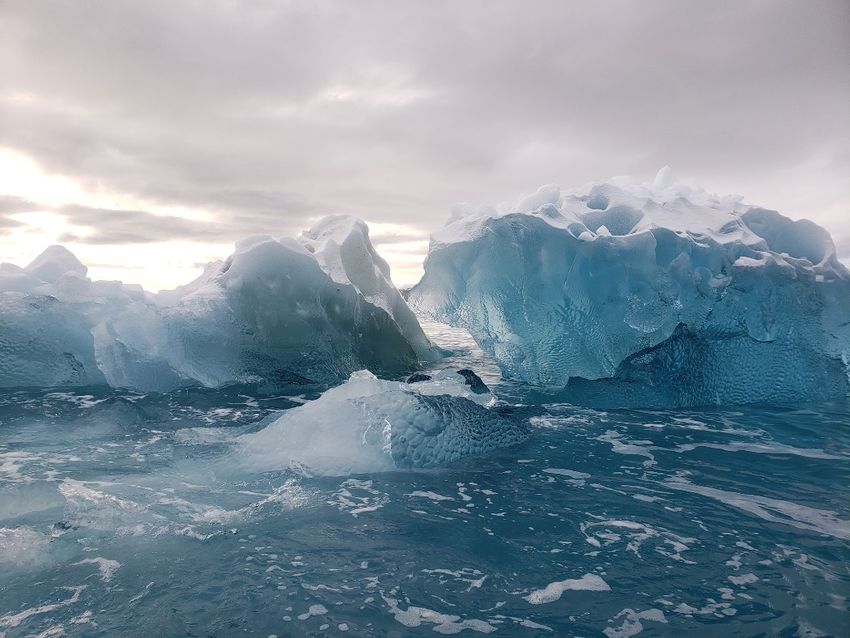
ires have dispersed across the Northern Hemisphere. Figure 7 shows layers of
smoke and degraded visibility due to smoke from Siberia overhead the Alaska
Range near Cantwell and over Kachemak Bay near Homer, Alaska, from July 17,
2021.
9
f
ff
ff
f
f
f
f
f
f
f
f
f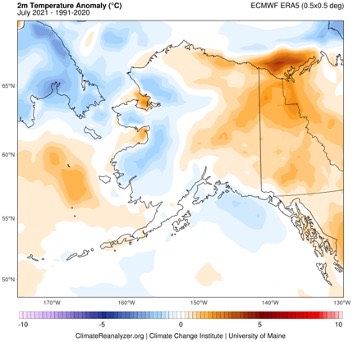
ALASKA CLIMATE RESEARCH CENTER

                 Figure 7. Airplane cockpit images overhead the Alaska Range (left) and Kachemak Bay (right) taken July 17, 2021
                                                        (photos taken by Martin Stuefer).

    Arctic Sea Ice

    The rate of Arctic sea ice loss was somewhat slow through much of July, with the
    month as a whole being marked by widespread low pressure over most of the
    Arctic Ocean. While the seasonal decline of sea ice extent was fairly rapid during
    the irst two weeks of July (with sea ice extent losses from 8 - 11% through July 15th)
    and the time period from July 4 - 9 being the lowest in the satellite record for that
    time of year, the decrease slowed later in the month with losses in the 5 - 6% range.
    The monthly extent for July 2021 was 7.69 million square kilometers, above the

            Figure 8. Time series of daily Arctic sea ice extent. This year’s data (lime green) are updated until July 29, 2021. The
           median sea ice extent for the 1981-2010 reference period is depicted in blue. Speci ic years are highlighted in colors.
         Plot Compiled by: Howard J. Diamond, PhD; Climate Science Program Manager at NOAA's Air Resources Laboratory Data
                                       Source: National Snow & Ice Data Center (https://nsidc.org/).

    10
f
                                                                          f
ALASKA CLIMATE RESEARCH CENTER
Figure 9. Arctic sea ice extent for the month of July 2021.
Image: National Snow and Ice Data Center (nsidc.org).
record low for the month set in 2020, with average extent for the month ranking
fourth lowest in the satellite record. Ice extent in the Beaufort and Chukchi Seas
continues to be near the long-term average.
Figure 8 shows the time series for 2021 of daily Arctic sea ice extent, up to July 29,
2021, while Figures 9 and 10 show the sea ice extent for the month of July 2021,
and sea ice concentration anomalies compared with the July average from 1981 –
2010.
Figure 10. Arctic sea ice concentration anomalies compared to the July average from
1981 - 2010.
Image: National Snow and Ice Data Center (nsidc.org).
11ALASKA CLIMATE RESEARCH CENTER
Newsworthy Information
Scientists stunned by rare Arctic
lightning storms north of Alaska
Meteorologists were stunned when three
successive thunderstorms swept across
the icy Arctic from Siberia to north of
Alaska, unleashing lightning bolts in an
unusual phenomenon that scientists say
will become less rare with global warming.
https://www.reuters.com/world/scientists-
stunned-by-rare-arctic-lightning-storms-
north-alaska-2021-07-16/
Siberian wild ire smoke causes hazy
skies in Southcentral Alaska
Wild ire smoke from Siberia iltered into
Southcentral Alaska and created a haze across
Anchorage skies. Hundreds of intense ires
burned in taiga forests in Siberia and eastern
Russia. The haze isn’t too unusual for Anchorage:
Wild ire smoke from Siberia and eastern Russia
spilled into Southcentral Alaska skies last
summer, too.
https://www.adn.com/alaska-news/
weather/2021/07/17/siberian-wild ire-
smoke-causes-hazy-skies-in-southcentral-
alaska/
12
f
f
f
f
f
fALASKA CLIMATE RESEARCH CENTER
The peak of summer warmth is near
Much of the state will soon reach the
average yearly date when the air won’t get
any warmer. Temperatures peak several
weeks after we get the most sunlight
because the ground absorbs energy from the
sun and releases it to the air. The day the
heat emitted by the surface starts
decreasing is usually the day we start feeling
cooler temperatures.
https://news.uaf.edu/the-peak-of-
summer-warmth-is-near/
Alaskan coast 8.2 magnitude
earthquake was the strongest one in
decades, o icial says
The 8.2 magnitude earthquake that
struck o Alaska's coast on July 28 was
the strongest one since 1964, felt
throughout the Alaska Peninsula and
Kodiak. A tsunami was generated by this
event but did not pose a threat to
communities.
https://www.cnn.com/
2021/07/29/us/alaska-
earthquake-8-2/index.html
13
ff
ffALASKA CLIMATE RESEARCH CENTER
Appendix
Table A1: July 2021 daily records of mean daily temperature, i.e. highest/lowest
values of mean daily temperature ever recorded on speci ic days. Records are
computed since the beginning of the respective time series. Eight new records
were set for highest mean daily temperatures was set and one for lowest mean
daily temperature record.
Highest Mean Daily Temperature on Record
Year of Old
Station Date New Record (ºF) Old Record (ºF)
Record
Anchorage 2021-07-16 66.0 2019 65.0
Anchorage 2021-07-17 68.5 1989 65.5
Anchorage 2021-07-18 70.0 2016 68.5
Bethel 2021-07-18 66.0 1985 64.5
Fairbanks 2021-07-20 71.5 1990 71.0
Homer 2021-07-19 63.0 1936 62.0
Kodiak 2021-07-16 69.0 1989 62.0
Talkeetna 2021-07-18 71.0 1996 69.0
Lowest Mean Daily Temperature on Record
Year of Old
Station Date New Record (ºF) Old Record (ºF)
Record
King Salmon 2021-07-09 47.0 1966 47.5
Table A2: July 2021 daily records of maximum daily temperature, i.e. highest/
lowest values of maximum daily temperature ever recorded on speci ic days.
Records are computed since the beginning of the respective time series. Six new
highest maximum daily temperature records were set and one was set for lowest
maximum daily temperature records.
14
f
fALASKA CLIMATE RESEARCH CENTER
Highest Maximum Daily Temperature Record
Year of Old Old Record
Station Date New Record (ºF)
Record (ºF)
Anchorage 2021-07-17 79.0 2002 76.0
Anchorage 2021-07-18 81.0 1989 79.0
Cold Bay 2021-07-18 68.0 1979 67.0
Kodiak 2021-07-15 79.0 2020 77.0
Kodiak 2021-07-16 79.0 1989 71.0
Yakutat 2021-07-17 77.0 1948 76.0
Lowest Maximum Daily Temperature Record
Year of Old Old Record
Station Date New Record (ºF)
Record (ºF)
King Salmon 2021-07-09 49.0 1970 51.0
Table A3: July 2021 daily records of minimum daily temperature, i.e. highest/lowest
values of minimum daily temperature ever recorded on speci ic days. Records are
computed since the beginning of the respective time series. Four new records for
highest minimum daily temperatures were set and one new record for lowest
minimum daily temperature.
Highest Minimum Daily Temperature on Record
Year of Old
Station Date New Record (ºF) Old Record (ºF)
Record
Anchorage 2021-07-18 59.0 1993 58.0
Juneau 2021-07-30 55.0 1977 54.0
Ketchikan 2021-07-04 59.0 2015 57.0
Kodiak 2021-07-16 59.0 1951 55.0
15
fALASKA CLIMATE RESEARCH CENTER
Lowest Minimum Daily Temperature on Record
Year of Old
Station Date New Record (ºF) Old Record (ºF)
Record
King Salmon 2021-07-11 36.0 2016 38.0
This information consists of climatological data compiled by the Alaska Climate Research
Center, Geophysical Institute, University of Alaska Fairbanks. For more information on weather
and climatology, visit the center website at http://akclimate.org. Please report any comments,
ideas or errors to webmaster@akclimate.org.
16You can also read