Impact of external wall insulation thickness on internal surface temperature behaviour
←
→
Page content transcription
If your browser does not render page correctly, please read the page content below
MATEC Web of Conferences 117, 00140 (2017)                                        DOI: 10.1051/ matecconf/20171170014 0
XXVI R-S-P Seminar 2017, Theoretical Foundation of Civil Engineering

         Impact of external wall insulation thickness on
         internal surface temperature behaviour
         Radoslav Ponechal1,*, Daniela Staffenova1
         1
          University of Zilina, Faculty of Civil Engineering, Department of Building Engineering and Urban
         Planning, Univerzitna 1, 01026 Zilina, Slovakia

                        Abstract. During the last years, the concept of low-energy buildings
                        based on high insulation levels becomes the reality. The aim of this paper
                        is to assess some alternatives of insulated and uninsulated external walls
                        with respect of thermal inertia. The thermal damping factor, phase shift,
                        together with the daily courses of indoor surface temperature of the
                        external wall have been analysed. Analysed surface temperatures show the
                        ability of constructions to accumulate heat gains, which can arise during
                        the day.

         1 Introduction
             By design of the material for the perimeter wall structures, the static and thermo-
         insulating aspect is the most important. If the values of thermal resistance are
         approximately at the same level, the builders would come to a number of other criteria such
         as the construction technology or internal environment, created by these construction
         materials. The role of thermal inertia in creating a high-quality indoor environment is
         indisputable. Its effects on structures and buildings are manifold and they are expressed by
         a number of indicators. Many indicators of the thermal inertia impact assessment have been
         developed and published till today. Most of them are described in the standard EN ISO
         13786:2007 [1]. In addition, a dynamic simulation methods are increasingly used for the
         evaluation. The paper from Italy is to assess the deviation arising by the use of different
         approaches for the calculation of the dynamic thermal characteristics of an opaque envelope
         element. The EN ISO 13786 procedure has been firstly applied by decomposing the
         external forcing temperature by means of the Fourier Transform analysis and the
         comparison with different approaches, such as Finite Difference Methods and Transfer
         Function Methods, has been carried out [2]. It concludes that there is a good accord among
         the Transfer Functions Methods and the Finite Difference Methods as regard periodic
         thermal transmittance. The time shift calculations show deviations of the order of
         magnitude of one hour, mainly due to the time discretization of the results.
             The college from Eindhoven University of Technology considered the 700 mm depth
         ultra-lightweight concrete wall in terms of energy efficiency and thermal comfort [3]. At
         first, they use the periodic thermal transmittance, which combines the properties of thermal
         transmittance, time shift and decrement factor in one metric. Analytical validation study

         *
             Corresponding author: radoslav.ponechal@fstav.uniza.sk

    © The Authors, published by EDP Sciences. This is an open access article distributed under the terms of the Creative
    Commons Attribution License 4.0 (http://creativecommons.org/licenses/by/4.0/).
MATEC Web of Conferences 117, 00140 (2017) DOI: 10.1051/ matecconf/20171170014 0
XXVI R-S-P Seminar 2017, Theoretical Foundation of Civil Engineering
showed that the conduction finite difference scheme in EnergyPlus is able to predict the
transient heat transfer phenomena in ultra-lightweight concrete structures with sufficient
accuracy, but users of simulation should carefully select an appropriate simulation tool,
because this study has also demonstrated that not all transient heat conduction methods that
are used in the widely-used software tools are able to predict the heat transfer in ultra-
lightweight slabs without errors. The results of the dynamic simulation of the house
operation were shown on discomfort hours.
Nemecek solved similar problems in the passive house [4]. In his contribution based on
simulation calculations of summer overheating, according to the importance he ranks an
energy storage capacity of construction in a 4th place, behind heat gains from solar
radiation, internal heat gains and ventilation regime. The difference between air
temperatures by light-weight or heavy-weight construction is about 1-1.5 K.
2 Dynamic thermal properties
Because of the fact that the overheated room temperature is influenced by many factors,
it is advisable to look at the comparison of basic dynamic characteristics of building
materials separately. The International Standard ISO 13786 describes dynamic thermal
parameters of multi-homogeneous-layered walls/roofs based on sinusoidal variations of
temperature or heat flow rate on the one hand and constant air temperature on the other
hand. The parameters relate cyclic heat flow rate to cyclic temperature variations. These
parameters are expressed as complex numbers.
Three groups of parameters for the thermal evaluation of building envelope variants in not
air-conditioned buildings are analysed in this work: thermal damping factor (DFs), phase
shift (LTs) and behaviour of indoor surface temperature. The thermal damping factor is
calculated by
DFs
si,max si,min
se,max se,min
(-) (1)
where θsi,max and θsi,min are the maximum and minimum values of the indoor surface
temperature during a day, respectively, and θse,max and θse,min are the maximum and
minimum values of the outdoor surface temperature.
The phase shift is defined as:
LTs t si,max t se,max (h), (2)
where t(θsi,max) and t(θse,max) are the time, when the indoor surface and outdoor surface
temperatures reach their maximums.
3 Structural variants
Three wall configurations with four different insulation thicknesses are studied and
presented: perforated brick wall (BR), heavy weight concrete wall (HC), porous concrete
wall (PC) with thermal insulation made of expanded polystyrene (EPS) or mineral wool
(MW). These three wall variants have very similar U-values, but differ from each other in
the dimension, material density and thermal conductivity. Each of the wall structures
(according to Fig. 1) has some selected different insulation thicknesses. The first variant
fulfils the requirement for maximal U-values Umax, the second variant fulfils desired value
UN, the third one fulfils recommended value Ur1 (considered for the year 2016) and the last
2MATEC Web of Conferences 117, 00140 (2017) DOI: 10.1051/ matecconf/20171170014 0
XXVI R-S-P Seminar 2017, Theoretical Foundation of Civil Engineering
variant fulfils the final thermal resistance Ur2 (considered for the year 2021) by the STN 73
0540:2012 standard [5]. The wall layers compositions are described in Fig. 1.
4 Thermal conductivity coefficient and DFs
The experiment analyses several of the above mentioned external wall compositions
with the calculation of thermal damping factor and phase shift of the temperature
oscillation, which was conducted on the basis of EN ISO 13786. The results from all
calculations are shown in Table 1 and Fig. 4.
Constructions designed for new buildings (with the thermal resistances Ur1 and Ur2)
reach significantly higher values of the thermal damping factor than the constructions with
minimum requirements for thermal resistance. There are strongly significant differences
among the porous concrete wall and the other two alternatives. While by the other insulated
walls, the thermal damping factor is as high as it is meaningless, this does not go for the
porous concrete wall. Comparing the differences by phase shift, it is necessary to take into
account the values of temperature setback, too.
Fig. 1. Evaluated variants of external wall, perforated brick (BR), Porous concrete (PC), heavy-
weight concrete (HC), expanded polystyrene (EPS) or mineral wool (MW).
Table 1. Results of thermal performance variables reached for evaluated wall structure variants
Structure A U (W/(m 2 .K)) DFs LTs Structure C U (W/(m 2 .K)) DFs LTs
1 HC 300 + MW 70 0.454 160.8 11.7 18 PC 200 0.444 28.2 8.1
2 HC 300 + EPS 70 0.454 156.1 10.5 19 PC 300 0.303 87.0 12.2
5 HC 300 + MW 110 0.307 294.8 13.4 20 PC 300 + MW 50 0.217 119.3 14.4
6 HC 300 + EPS 110 0.307 255.0 11.5 21 PC 300 + EPS 50 0.217 95.0 13.5
7 HC 300 + MW 160 0.219 575.1 15.6 22 PC 300 + MW 130 0.149 413.1 17.9
8 HC 300 + EPS 160 0.219 417.8 12.9 23 PC 300 + EPS 130 0.149 262.6 15.7
9 HC 300 + MW 240 0.150 1555.0 19.1
10 HC 300 + EPS 240 0.150 827.6 15.0
Structure B U (W/(m 2 .K)) DFs LTs
11 BR 380 0.438 261.4 18.4
12 BR 300 + MW 60 0.318 333.3 17.2
13 BR 300 + EPS 60 0.318 314.9 16.1
14 BR 300 + MW 110 0.211 726.3 19.3
15 BR 300 + EPS 110 0.211 597.3 17.5
16 BR 300 + MW 190 0.146 2071.6 22.8
17 BR 300 + EPS 190 0.146 1277.4 19.6
3MATEC Web of Conferences 117, 00140 (2017) DOI: 10.1051/ matecconf/20171170014 0
XXVI R-S-P Seminar 2017, Theoretical Foundation of Civil Engineering
2 400,0
Ur2
2 100,0
16
1 800,0
1 500,0 9
1 200,0 17
DFs
900,0
10
600,0
22
300,0 23
0,0
0,10
0,11
0,12
0,13
0,14
0,15
0,16
0,17
0,18
0,19
0,20
Thermal conductivity coefficient (W/(m2.K))
Fig. 2. Thermal damping factor (DFs) for the first group of walls.
2 400,0
Ur2
2 100,0
16
1 800,0
1 500,0 9
1 200,0 17
DFs
900,0
10
600,0
22
300,0 23
0,0
0,10
0,11
0,12
0,13
0,14
0,15
0,16
0,17
0,18
0,19
0,20
Thermal conductivity coefficient (W/(m2.K))
Fig. 3. Thermal damping factor (DFs) for the second group of walls.
2 400,0
UN Umax
2 100,0
1 800,0
1 500,0
1 200,0
DFs
900,0
600,0
19 12
300,0 1
5 6 13
18
0,0 11
0,29
0,30
0,31
0,32
0,33
0,34
0,35
0,36
0,37
0,38
0,39
0,40
0,41
0,42
0,43
0,44
0,45
0,46
Thermal conductivity coefficient (W/(m2.K))
Fig. 4. Thermal damping factor (DFs) for the third group of walls.
4MATEC Web of Conferences 117, 00140 (2017) DOI: 10.1051/ matecconf/20171170014 0
XXVI R-S-P Seminar 2017, Theoretical Foundation of Civil Engineering
If the value of temperature damping is high (e.g. 200 and more), the phase shift does not
play such a role and the inner surface temperature will increase up to 0.5 degree only. It is
not so crucial according to the fact at what time this occurs.
Calculations of DF and LT are meaningful only in terms of heat transfer fragment of
building envelope constructions (walls, roofs, etc.). The complete image of the building or a
room in the building, in terms of summer overheating, will give us only complex
calculations of thermal stability or computer simulations.
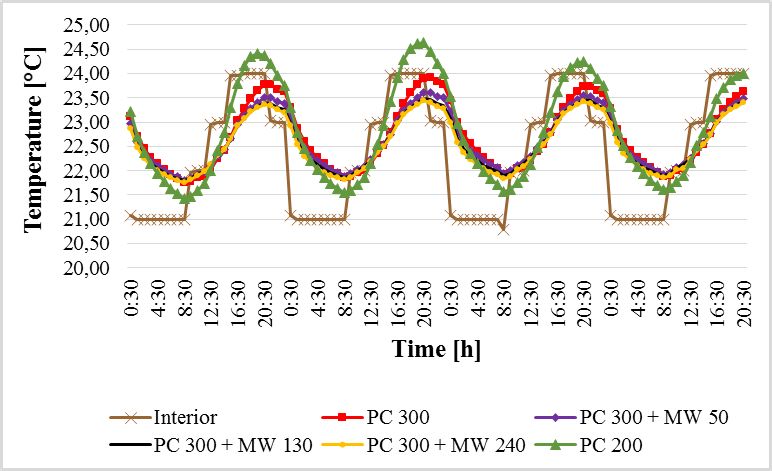
5 Simulations of internal surface temperature
Insulated wall can resist temperatures from the inside and from the outside with a
difference. Graphs on Fig. 5 and Fig. 6 show a behaviour of internal surface temperature
with 24 hour period change of internal air temperature. The internal air temperature has
risen since the morning and it was falling late in the evening. It is a heat conduction behind
a non-stationary state. The temperature varies both inside and outside. Lower internal
surface temperature means better thermal comfort. The lower internal surface temperature
at times of high heat gains means the possibility of accumulating a portion of the heat from
the air into the walls.
Fig. 5. Internal surface temperature for a heavy weight concrete wall with thermal insulation
Fig. 6. Internal surface temperature for a porous concrete wall with thermal insulation
5MATEC Web of Conferences 117, 00140 (2017) DOI: 10.1051/ matecconf/20171170014 0
XXVI R-S-P Seminar 2017, Theoretical Foundation of Civil Engineering
6 Conclusion
The impact of external wall on overheating could be defined in two ways: as the
structure, through which the heat is transferred from the exterior and it warms the interior
or (less usual) as the structure, which contributes to the thermal stability of interior by its
accumulative ability.
In the first case, the thermal damping factor, which is very high for the walls in new
buildings, is a crucial criterion. Thermal insulation protects the wall from rapid temperature
changes. High values of thermal damping factor in insulated walls indicate that its
assessment in terms of the daily cycle of temperature rise and fall is an insignificant
phenomenon.
A much more substantial contribution can the external wall have on heat loss in the
summer season. Heat loss in the summer helps cool the interior at night. However, there is
still a conclusion from the contributions [3, 4] that the effect on overheating is affected by
the control of building ventilation and heat gains.
Another case, when the external walls could affect the interior overheating is its
accumulative ability. Integrating of simulation approach could eliminate this imperfection.
It appears that the walls insulated in compliance with the new requirements for thermal
conductivity coefficient can contribute to thermal stability of the room, because their
internal surface temperature remains low even in the evening. The external wall, which
holds more heat, has a higher potential to stabilize the interior temperature. However, the
thickness of the insulation does not play here a significant role.
Presented results were obtained with the support of the grant project VEGA no. 1/0945/16.
References
1. STN EN ISO 13786 (2007)
2. A. Gasparella, G. Pernigotto, M. Baratieri, P. Baggio, Energy and Buildings, 43, 2509-
2571 (2011)
3. F. Roberz, R.C.G.M. Loonen, P. Hoes, J.L.M. Hensen, Energy and Buildings, 138,
432-442 (2017)
4. M. Nemecek, M. Kalousek, www.tzb-info.cz
5. STN 73 0540:2012 (2012)
6You can also read