WHAT DOES MCDONALD'S SAY ABOUT YOUR CITY?
←
→
Page content transcription
If your browser does not render page correctly, please read the page content below
What Does McDonald’s
 Say About Your City?
Looking for trends in McDonald’s Yelp Reviews, diabetic rates, and Census statistics

                         The University of Texas at Austin
                  Dr. Pradeep Ravikumar – CS 378 Data Mining
                          Matthew Ebeweber | Jay Shah
                                  May 2, 2013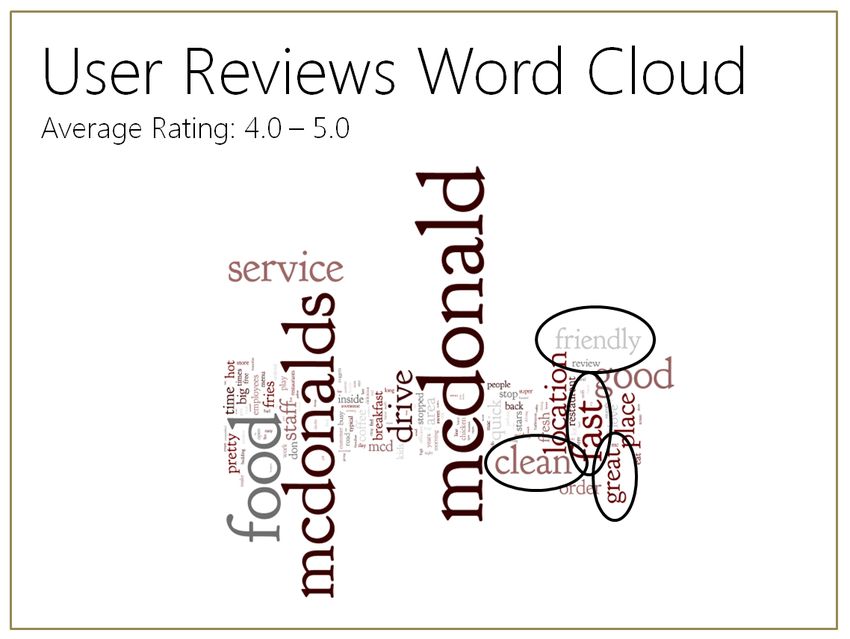
Abstract
Yelp offers a plethora of data about consumer expectations. Each year, users leave tens of
millions of reviews to let others know about their experience. We mine reviews on over 13,000
McDonald’s restaurants and cross reference this information with geographic diabetic rates and
Census statistics. We look for relationships between McDonald’s reviews and sociological
factors such as poverty rates, income per capita, and population density. We also explore
relationships between McDonald’s and areas with diabetes. We employ single and multivariable
regressions to identfy these relationships.

Our results show McDonald’s presence is significantly correlated with the wealth of a city (and
its citizens) as well as diabetic rates. Despite this strong correlation (all p values < 0.01),
McDonald’s data does not hold predictive power for diabetic rates or the wealth of an area.
Interestingly, we discover that the wealth of an area can reasonably predict (R squared = 40%)
the rate of diabetes in an area.

Background & Motivation
There have been dozens of studies on the direct effects of fast food (and particularly
McDonald’s) on an individual’s body. As data has become available, statisticians have taken a
more macro perspective and tried to map the effects of McDonald’s on a population as whole
(Morgenstern, 2009).

Today services such as Yelp offer not only business locations and details, but also reviews of
performance, all completely free to view and download. Previous research fails to discuss
satisfaction of a restaurant and its relationship with an individual’s health. In other words, the
question remains unanswered: Do people’s satisfaction rates with McDonald’s provide any
indication of their health level? Answering this question would mean measuring the impact of
McDonald’s on a population, instead of just individuals.

Data Mining Yelp
Prior to any data collection, we were determined to organize our information geographically in
order to find trends by location. Our other two datasets (diabetes statistics from the CDC and
socioeconomic details from the 2010 US Census) are already organized by county. Because
there are over 3,000 US counties, we felt US counties were sufficiently granular and should
aggregate Yelp reviews on McDonald’s by county as well.

Using a list of latitude/longitude coordinates of all US counties; we search for McDonald’s in all
3,000 counties and store up to 20 locations per search (limited by Yelp). While there were
dozens of fields of data for each McDonald’s, we were only interested in customer reviews and
locality. Hence, we only store information pertaining to user reviews or the physical location of a
store. We then combine McDonald’s data with CDC and Census dataset and organize all
information by county.

Dataset
Yelp’s v1 API, though deprecated, allowed us to make thousands of calls to its business API to
access a wealth of information. We parsed the JSON and store the following attributes per store

                                                -2-
(per McDonald’s). Note: We also use datasets available by the US Census Bureau and Center
for Disease and Control. Attached code for mining Yelp is in the appendix.
Data Stored Per McDonald’s Location (Yelp):
Average Rating
Number of Reviews
Latitude Coordinate
Longitude Coordinate
City
County ID (Also known as FIPS Number)
Data Stored for Each US County (Census and CDC):
Population
Percent of Population Female
Median Home Value
Income Per Capita
Percent of Population in Poverty
Population Density
People Diagnosed with Diabetes out of every 1000 People
Methodology
Once our data was compiled and stored in a single location, our primary method to identify
relationships was using single and multivariable regressions. While we implemented the
regression functions ourselves in Matlab, we display the results from our work in Excel for ease
of presentation.
Single Regression
We first look for correlation between two variables. Interestingly, almost all of the census
statistics were significantly correlated with diabetes rates as well as McDonald’s locations. In
general, we find that the percentage of females in a city does not correlate with any of our
variables, and we remove it from future analysis.
In determining which variables had meaningful (statistically significant) relationships, we mainly
observe R2 values and p-values. While we accept that R2 values will not be high for most
regressions, we only consider a relationship noteworthy if the p=value was less than 0.05.
The code implementation for the single variable regression can be seen in the following section,
“Multiple Regression”, and in the file named singleregression.m.
Multiple Regression
Our approach to multiple regressions was more sophisticated than that of single regressions
due to the sheer number of combinations we could possibly run. Our main algorithm for
selecting multiple regression variables began by running a regression on the entire dataset. We
then individually eliminate variables that were not statistically significant (p-value < 0.05) and
observe R2 values. Ultimately, we sought to maximize R2 values while keep all components of
the regression statistically significant.
-3-The implementation can be found in multivarregression.m. Implementing both regressions is
essentially the same mathematically. The only difference is the number of columns in X which
increases for each additional X variable. The program outputs the w values corresponding to the
equation yi ≈ w0 + w1 xi.., where the given x corresponds to the given variable.
Identifying Underlying Relationships
It is easy to regress variables and assume they are uniquely correlated due to low p-values, and
so we look for relationships between all 3 of our datasets before assuming that 2 of them are
uniquely related. We discuss this component of our analysis further in our Results.
Results
Overall, we discovered several interesting trends related to McDonald’s as a company as well
as diabetic rates across the US. We focus our efforts on new information that hasn’t been found.
For example, there has been extensive research on poverty effects on health, and thus it is no
surprise that lower income areas have higher rates of diabetes (and probably other medical
conditions). We identify five major relationships as outlined below.
Exhibit 1: Number of McDonald’s in a County is Correlated With Income Per Capita
-4-Exhibit 2: Number of McDonald’s Correlated with New Cases of Diabetes in a County
-5-Exhibit 3: Number of McDonald’s Correlated with Median Home Value
-6-Exhibit 4: McDonald’s Rating is Inversely Correlated with Diabetes Rate
-7-Exhibit 5: Census Statistics Can Partially Explain Diabetes Rate
Regression Statistics
Multiple R 0.592264778
R Square 0.350777568
Adjusted R Square 0.34937657
Standard Error 1.721587508
Observations 2323
Coefficients Standard Error t Stat P-value
Intercept 9.436505555 0.155936564 60.51502816 0
# of Ratings 0.000722972 0.000195653 3.69517247 0.00022483
Population -5.98087E-07 1.54602E-07 -3.868545289 0.000112507
HomeValue -8.36944E-06 5.76455E-07 -14.51880598 8.85253E-46
PercentInPoverty 0.131158169 0.006615492 19.82591221 6.26723E-81
PopulationDensity 0.000133601 5.81527E-05 2.297412905 0.021683976
Exhibit 6: McDonald’s Data is Correlated with Diabetes, Though it Holds Little Predictive Power
Regression Statistics
Multiple R 0.20651325
R Square 0.042647723
Adjusted R Square 0.041409233
Standard Error 2.089685235
Observations 2323
Coefficients Standard Error t Stat P-value
Intercept 11.04612004 0.151249773 73.03230832 0
Avg Rating -0.148639457 0.052612834 -2.82515587 0.004766192
# of Ratings -0.000849338 0.000240258 -3.535108036 0.000415593
Locations -0.007875864 0.001436525 -5.482581989 4.64604E-08
-8-Discussion
Many of our results were in tune with intuition and some even countered our original hypothesis.
Overall, we find that Census statistics have strong predictive power for many elements in our
dataset, ranging from the number of Diabetes cases in an area to how well McDonald’s was
rated on Yelp. For this reason, we had to be careful not to attribute variable to McDonald’s when
they were actually correlated with Census statistics.
Revising Our Original Assumption
As mentioned previously, our motivation for this project was to see if we could prove citizens in
different areas have different expectations for the same service. The initial assumption was that
McDonald’s offers a homogenous experience across all of its locations, and the variance in
reviews would be a function of different levels of expectations amongst customers. If this were
the case, we would expect lower areas to rate McDonald’s higher than more wealthy areas. We
quickly realized, however, that this was not the case. Wealth of a region affects the quality of
McDonald’s service. To illustrate this, we generate word clouds using the reviews users left for
McDonald’s of different levels.
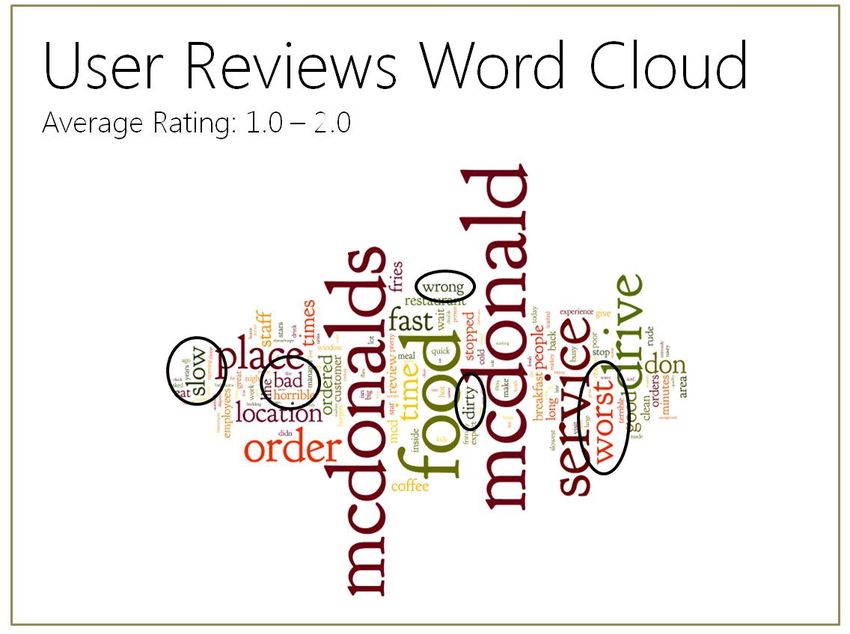
Exhibit 7: Word Cloud of McDonald’s Reviews Rated 1.0 – 2.0
-9-Exhibit 8: Word Cloud of McDonald’s Reviews Rated 4.0 – 5.0
As you can see, there is a stark difference in the vocabulary of both reviews, identifying that
there was a stark difference in customer experience at both locations.
McDonald’s Locations Positioned to Most Profit
We found that McDonald’s locations can be most explained by factors that are could boost its
sales. This makes plenty of sense, as that is McDonald’s goal as a business. We find that
McDonald’s locations are most correlated with measures of wealth seach as income per capita
and median home value. While this relationship was not surprising, we believe there is still value
in quantifying it
McDonald’s and Diabetes
We found that the number of McDonalds in an area and the number of new cases of diabetes in
an area are highly correlated. In hindsight, this correlation seems to be obvious, as McDonalds
has a reputation of being unhealthy and is commonly associated with diseases such as this.
This does not mean specifically that McDonalds can be blamed for causing these new cases of
diabetes, only that there is a correlation here.
- 10 -McDonald’s Rating and Diabetes
Our most interesting finding was the inverse relationship between diabetes rates and
McDonald’s ratings. We found that poor McDonald’s reviews indicate higher levels of diabetes
in an area. While this observation is counter-intuitive, we closely examined the data in order to
understand this relationship. We found that in low income areas, diabetes rates are higher than
usual and McDonald’s reviews are lower than usual. For this reason, our analysis also identified
a relationship between diabetic rates and ratings. We found this lesson to be valuable from our
project, as it illustrates the importance of human insight vs blind statistical analysis.
Future Studies
While our analysis revealed interesting information, we believe this study could be further
expanded to provide even more information. Specifically, we feel that only observing
McDonald’s in counties is a one-dimensional approach to analysis. It would be more interesting
to incorporate other unhealthy food chains. We also see merit in looking for trends in more than
just diabetics, after all diabetes is only one of the diseases McDonald’s exacerbates.
We look forward to future literature about the subject matter. As data collection and analysis
becomes even more ubiquitous, we believe there will be more answers explaining obesity and
its socioeconomic causes.
- 11 -You can also read