Melbourne Institute Nowcast of Australian GDP & Dating the Business Cycle - February 2021
←
→
Page content transcription
If your browser does not render page correctly, please read the page content below
MELBOURNE INSTITUTE
Applied Economic & Social Research

Melbourne Institute Nowcast of
Australian GDP & Dating the
Business Cycle

February 2021
Melbourne Institute Nowcast of Australian GDP
& Dating the Business Cycle                                              Released February 25, 2021

GDP grew by 3.3 per cent in the September quarter of 2020
On December 2, the ABS reported that GDP grew by 3.3 per cent in the September quarter of 2020,
giving an annual growth rate of –3.8 per cent and showing signs of recovery. According to the ABS,
household consumption rebounded in the third quarter as restrictions eased, contributing 4
percentage points to GDP. Public expenditure continued to support growth, while net exports
subtracted 1.9 percentage points from GDP. The next release of the National Accounts, covering the
December quarter, will be on March 3, 2021.
 Figure 1: GDP Growth (chain volume, per cent)      Figure 2: Contributions to GDP Growth (ppt)

 Source: ABS, up to Sep quarter 2020.               Source: ABS, up to Sep quarter 2020.

Third and final nowcast for December Quarter GDP (released in February 2021)
GDP growth is projected to be 1.6 per cent in the December quarter, giving a year-ended growth rate
of negative 2.7 per cent. The nowcast for Q4 reflects the easing of restrictions on households and
business activities, although we note the on-going uncertainty of COVID-19 on economic activity. In
March 2021, the first nowcast for Q1-2021 will be released.
Strong housing market conditions, relatively strong data for hours worked and improvement in
consumer sentiment up to December contributed positively to the third GDP growth nowcast for Q4.
We note, however, that uncertainty about international economic conditions and the domestic labour
market (including the removal of JobKeeper), in addition to extremely weak business credit conditions,
pose risks for growth during 2021.
Uncertainty exists about the momentum in the economy
The Monthly Activity Index suggests that the economy, after growing strongly in November as the
lockdown was relaxed in Victoria, may have lost some momentum. Activity is estimated to have
declined slightly in early 2021, although this is only based on limited data (mainly the Westpac-
Melbourne Institute Consumer Sentiment Index) and will be revised as more data become available.
Looking further forward, growth in the Westpac-Melbourne Institute Leading Index alternatively has
remained very strong recently and is considerably above its trend. This suggests that above-trend
growth is likely to occur in the next 3 to 9 months, which is necessary to reduce the spare capacity
that exists and to lower the unemployment rate, which despite recent falls remains elevated.
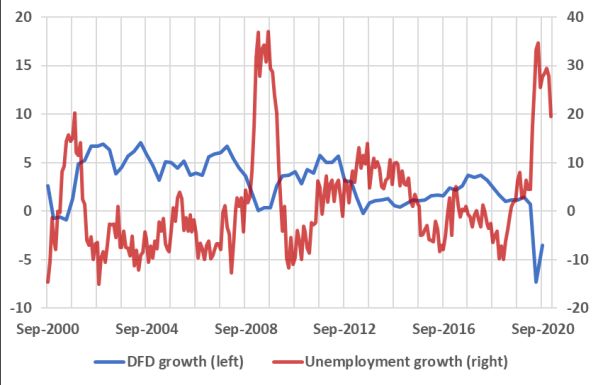
The unemployment rate fell slightly in January, although hours worked also fell1
The annual growth rate of the number of unemployed fell from 28 per cent in December to 20 per
cent in January, with the unemployment rate sliding further from 6.6 per cent in December to 6.4 per
cent in January. Nevertheless, unemployment conditions were still a drag on the growth of domestic
final demand, which fell by 3.5 per cent over the year to the September quarter. The number of
unemployed up to December remains a primary negative contributor to the Q4 nowcast.
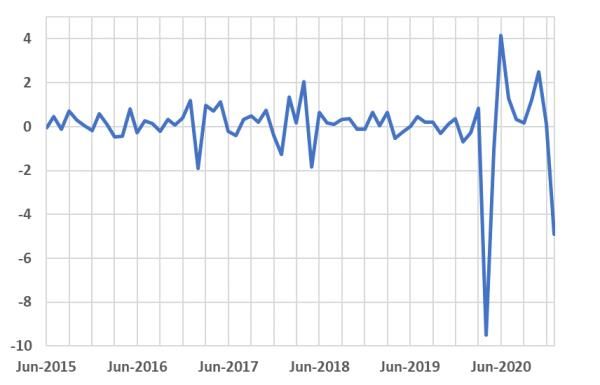
The monthly growth of hours worked fell by 4.9 per cent from December to January, widening the gap
between its current value and the value observed in the same month last year (down by 5.7 per cent
compared to January 2020). Overall, however, hours worked up to December was a primary positive
contributor to the Q4 nowcast.
Figure 3: Unemployment and DFD Figure 4: Growth of hours worked
(year-ended growth, per cent) (monthly, per cent)
Source: ABS, up to Jan 2021. Source: ABS, up to Jan 2021.
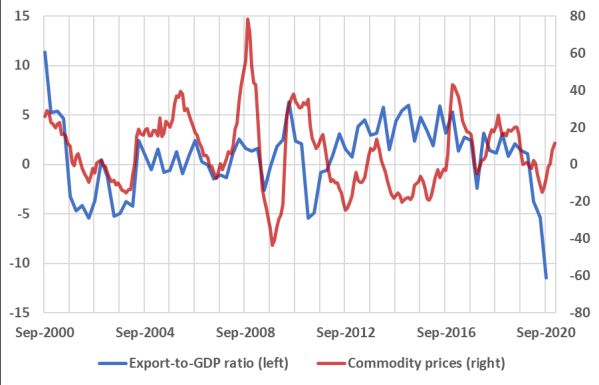
Commodity prices improved further in January, while trade remains weak
The index of commodity prices rose further by 11.4 per cent over the year to January, due primarily
to the large increase in bulk commodity prices (especially iron ore prices, which peaked again in
January after reaching a nine-year high in December). The index of commodity prices up to December
has finally made a positive, albeit small, contribution to the nowcast for Q4 and may push exports up
further in the next quarter.
Net exports increased in December, resulting from both an increase in total exports and a decrease in
total imports. Overall, the trade sector remains weak and the trade balance up to December
contributed negatively to the final nowcast for Q4.
Figure 5: Commodity Prices and Exports-to-GDP Figure 6: Trade balance
Ratio (year-ended growth, per cent) ($ billion)
Source: ABS, up to Jan 2021. Source: ABS, up to Dec 2020.
1
Our nowcast model uses monthly information regarding labour market conditions, housing and business
lending, retail sales, housing approvals, consumer expectations, trade conditions and commodity prices to gauge
current economic conditions. We note that the nowcast is currently in the experimental stage.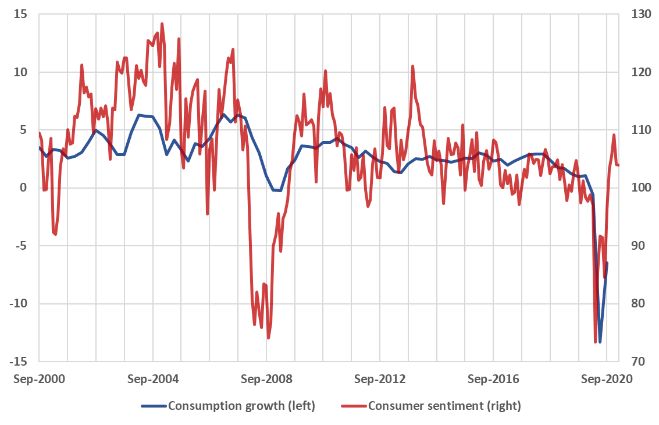
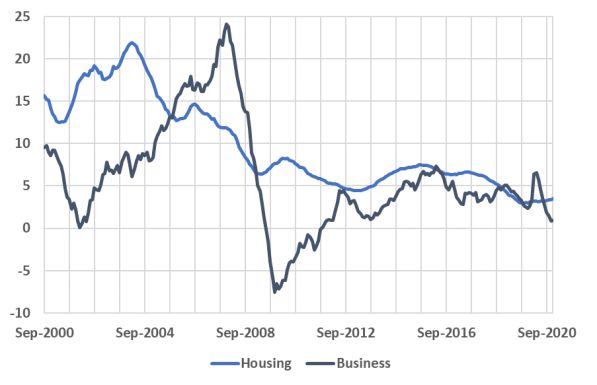
Consumer sentiment has weakened in the first two months of 2021
The seasonally adjusted current conditions component of consumer sentiment fell by 0.1 points in
February, after falling by another 5.1 points in January. This is the second consecutive decline after a
period of successive improvement from September to December. The number of optimists is now only
slightly greater than the number of pessimists, suggesting that consumer spending looking forward to
Q1 2021 may be weaker than expected.
Annual growth in food-related retail trade data for December continued to moderate, with the rate
of growth declining for a fifth consecutive month. This is, however, largely expected. Moreover, the
annual growth rate of non-food related retail trade fell by nearly 10 per cent in December, after spiking
to an annual growth rate of 28 per cent in the previous month, highlighting the significant uncertainty
about non-food related retail spending in the short term.
 Figure 7: Consumer Sentiment and Consumption           Figure 8: Retail trade
 (index and year-ended growth, per cent)                (year-ended growth, per cent)

 Source: ABS and Melbourne Institute, up to Feb 2021.   Source: ABS, up to Dec 2020.

Dwelling approvals reach record levels as business lending continues to wane
The housing market ‘boom’ continued in December with dwelling approvals rising for a sixth
consecutive month. In December, approvals were 55 per cent greater than those observed December
2020. Moreover, the absolute number of approvals was at its highest on record. Clearly, housing
activity has been a major positive factor in this month’s nowcast.
Housing credit data also improved in December, reaching an annual growth rate of over 3.5 per cent.
This is the strongest annual improvement in housing credit since 2019. The sharp contrast between
housing and business credit growth seen in recent months was also observed in December, with
annual growth in business lending below 1 per cent for the second consecutive month. Growth
prospects for investment in 2021 therefore continue to be poor.
 Figure 9: Dwelling Approvals and Residential            Figure 10: Housing Credit and Business Credit
 Investment                                              (year-ended growth, per cent)
 (year-ended, per cent)

 Source: ABS, up to Dec 2020.                            Source: ABS, up to Dec 2020.
Dating the Australian Business Cycle
The Melbourne Institute uses a Monthly Activity Index, together with the nowcast and a rule to
identify turning points, to date whether the Australian economy may be in a recession.2
The Monthly Activity Index is constructed so that at the quarterly frequency, it coincides with the log
of real quarterly GDP to ensure that both data set exhibits similar turning points. Essentially our
approach interpolates the quarterly values in history, guided by monthly partial indicators of the state
of the economy.3
Table 1 identifies the turning points (as in peaks and troughs) and the periods of contractions and
expansions in business cycle analysis using monthly data. Similar to the official ABS data (shown in
Table 2), the Monthly Activity Index indicates that the Australian economy entered a recession in 2020.
The dates presented are very similar to last month.
The business cycle dates continue to suggest that the COVID-19 recession only lasted 2 months, which
is shorter than average. Confirmation that the recession has ended will occur when the December
quarter GDP data is released early next month.
The COVID-19 recession, while short, was deep, even with the aggressive fiscal and monetary policy
responses. The Reserve Bank has indicated that the cash rate will remain at essentially zero for several
years. This is a reflection of the amount of slack that currently exists in the economy. It may also
partially reflect the problem of inflation persistently undershooting the RBA’s target that existed
before COVID.

                                    Table 1: Monthly Business Cycle Dates
                                    Contraction             Expansion                           Cycle
       Peak         Trough
                                   peak to trough         trough to peak         peak to peak       trough to trough
                                     (months)                (months)             (months)              (months)
                   Jan-1975
    Sep-1981       Jan-1983               16                     80                                        96
    Mar-1990       Jun-1991               15                     86                   102                  101
    Mar-2020      May-2020                 2                    345                   360                  347
                                                             Ongoing
    Averages                              10                    130                   231                  181
    Standard deviations                    7                    147                   182                  143
Note: The average durations are rounded to full months. Includes the ongoing phase. Sample is 1974:09- 2021:02.

2
  The rule is known as Bry-Boschan Quarterly (BBQ). See A. R. Pagan and D. Harding (2002) “Dissecting the cycle:
a methodological investigation’, Journal of Monetary Economics, 49(2), p. 365-381. Also see
http://www.ncer.edu.au/data/data.jsp. The commonly quoted “two-quarters of negative growth” rule to define
a recession is an approximate way of identifying turning points in the level of economic activity.
3
  The data used are: the Westpac-Melbourne Institute Consumer Sentiment Index (time to buy a major
household item and family finances versus a year ago); retail trade; the trimmed-mean CPI; the Melbourne
Institute Inflation Gauge; monthly imports; the real and nominal trade-weighted exchange rate and aggregate
hours worked. We construct the Monthly Activity Index from 1974:09 onwards due to availability of the monthly
data. The MI Monthly Activity Index is currently still in development (particularly its open economy aspects).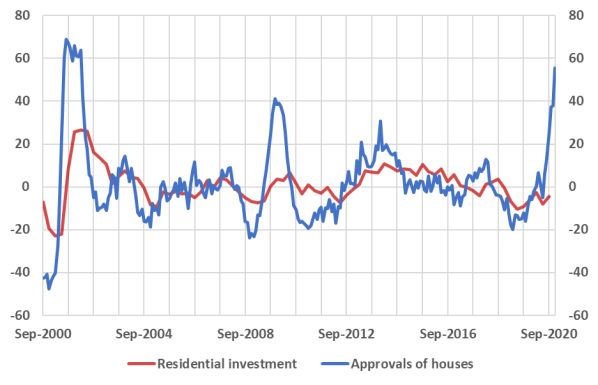
Table 2: Real GDP Business Cycle Dates

                                        Contraction       Expansion                        Cycle

        Peak              Trough
                                           Peak to        Trough to           Peak to              Trough to
                                            trough          peak               peak                  trough
                                          (quarters)      (quarters)         (quarters)            (quarters)
     Mar-1961      Sep-1961                   2
     Jun-1965      Mar-1966                   3               15                 17                    18
     Sep-1971      Mar-1972                   2               22                 25                    24
     Jun-1975      Dec-1975                   2               13                 15                    15
     Jun-1977      Dec-1977                   2                6                  8                    8
     Sep-1981      Jun-1983                   7               15                 17                    22
     Jun-1990      Jun-1991                   4               28                 35                    32
     Dec-2019                              ongoing            114                118
        Average durations                     3               15                 34                    34
       Standard deviations                    2                8                 38                    38
Note: The average durations and standard deviations are rounded to full quarter. Includes the ongoing phase. Sample is
1959:Q3 – 2020:Q3.

                                    Table 3: Cycles in Real GDP per Capita

                                       Contraction        Expansion                        Cycle

         Peak            Trough
                                          Peak to         Trough to            Peak to             Trough to
                                           trough           peak                peak                 trough
                                         (quarters)       (quarters)          (quarters)           (quarters)
                        Jun-1974             2                  4                                      6
      Jun-1975          Dec-1975             2                  6                  8                   8
      Jun-1977          Dec-1977             7                 15                 17                   22
      Sep-1981          Jun-1983             4                  9                 16                   13
      Sep-1985          Sep-1986             2                  5                  9                   7
      Sep-1989          Dec-1991             9                  5                  7                   14
      Jun-2000          Dec-2000             2                 34                 43                   36
      Dec-2005          Jun-2006             2                 20                 22                   22
      Mar-2008          Dec-2008             3                  7                  9                   10
      Jun-2018          Dec-2018             2                 38                 41                   40
      Dec-2019                            ongoing               4                  6
         Average durations                   4                 13                 18                   21
        Standard deviations                  2                 13                 14                   15
Note: The average durations and standard deviations are rounded to full quarter. Includes the ongoing phase. Sample is
1973:Q3 – 2020:Q3.
Melbourne Institute Nowcast of Australian GDP & Dating the Business Cycle
The Melbourne Institute Nowcast of Australian GDP and the Monthly Index used to date the business
cycle use monthly information regarding labour market conditions, housing and business lending,
retail sales, housing approvals, consumer expectations, trade conditions and commodity prices in
order to gauge current economic conditions.
We note that the nowcast and the dating methodology are currently in the experimental stage.
Disclaimer: The University of Melbourne and the Melbourne Institute give no representation, make
no warranty, nor take any responsibility as to the accuracy or completeness of any information
contained herein and will not be liable in contract tort, for negligence or for any loss or damage
arising from reliance on any such information. The Melbourne Institute Nowcast of Australian GDP
presents the professional analysis and views of the Melbourne Institute.
For information on the data contained in the report contact the Melbourne Institute, The University
of Melbourne, on (03) 8344 2196.
© The University of Melbourne, Melbourne Institute: Applied Economic and Social Research.
This report is copyright. Apart from any fair dealing for the purposes of study, research, criticism or
review, as permitted under the Copyright Act, no part may be reproduced without written
permission.
For more information about the Melbourne Institute, see:
http://melbourneinstitute.unimelb.edu.au/
For more information about Macro@MI and other reports see:
http://melbourneinstitute.unimelb.edu.au/research-programs/macroeconomicsYou can also read