ASSESSMENT OF SKELETAL MATURATION - A CORRELATIVE STUDY
←
→
Page content transcription
If your browser does not render page correctly, please read the page content below
The Orthodontic CYBERjournal, Oct. 2009

RELIABILITY OF MP3 (middle phalanx of 3rd finger) STAGES IN
ASSESSMENT OF SKELETAL MATURATION – A CORRELATIVE
STUDY
Dr. K. S. Negi

Astt. Professor
Department of Orthodontics & Dentofacial Orthopedics
H.P. Govt. Dental College & Hospital Shimla. (H.P.) - 171001
docksnortho@gmail.com

  ABSTRACT
 This study was contemplated to find the reliability of MP3 (middle phalanx of third
 finger) stages for assessing skeletal maturity by correlating it with the CVMI stages. The
 radiographs of 160 healthy North Indian children (80 males and 80 females) between the
 age group of 8-16 years were collected to assess the MP3 stage using dental (IOPA) X-
 ray film and the CVMI stage using lateral cephalogram. A highly significant correlation
 was observed between MP3 stages and CVMI stages. It was observed in the study that
 the development stages of middle phalanx of third finger (MP3) can be used as a reliable
 skeletal maturity indicator for assessment of skeletal maturation.

 Key words : Skeletal maturity, MP3 stages, CVMI stages.
2

 INTRODUCTION
       Prediction of both the time and amount of active growth, especially in the
craniofacial complex, would be useful to the orthodontists and Pedodontist. The
maturational status can have considerable influence on the diagnosis, treatment planning
and eventual outcome of orthodontic treatment. Clinical decisions regarding the use of
extra-oral traction force, functional appliances, extraction versus non-extraction treatment
or orthognathic surgery are mainly based on growth considerations.1
      A number of growth indicators described in the literature are currently available to
the orthodontist. Despite the limitations, skeletal age has advantage over chronological
and dental age, particularly more so for those children whose growth is markedly
                      2
advanced or retarded.
       Fishman 3 used skeletal maturity indicators (SMI) in hand-wrist radiographs using
four stages of bone maturation at six anatomic sites, which has been amongst the most
commonly used methods to assess skeletal maturation. Hassel & Farman 4 utilized the
cervical vertebrae and found them as reliable and valid as the hand-wrist area for
                                         5
assessing skeletal age. Hagg and Taranger introduced a method using the hand-wrist
radiograph to correlate certain maturity indicators to the pubertal spurt and noted that the
stages of ossification of middle phalanx of third finger of a hand (MP3) follow the
pubertal growth spurt from the onset to the end. Leite et.al.2 later on stressed the use of
first three fingers of the hand as a reliable marker.

                The purpose of this study is neither to discuss the validity of the use of
skeletal age or chronological age nor to assess one method over other. Its intent is merely
to find a reliability of MP3 (middle phalanx of third finger) stages for assessing skeletal
maturity after correlating with CVMI stages and its use to assess growth impetus.
3
MATERIAL AND METHOD
The present study was conducted on 160 north Indian children (80 males and 80 females)
in the age span of 8 to 16 years. The subjects selected for this study was randomly from
patients visited to Department of Orthodontics & Pediatric Dentistry. All the subjects
selected were moderately built and in growing age with no history of bone deformities,
bone diseases and major illness in the past.
Table 1: Subject Grouping
S.No. Group I (Male subjects) Group II (Female subjects)
Subgroup Age (years) No. of Subgroup Age No. of
subjects (years) subjects
1 A 8-10 20 A 8-10 20
2 B 10-12 20 B 10-12 20
3 C 12-14 20 C 12-14 20
4 D 14-16 20 D 14-16 20
Total 80 Total 80
Method
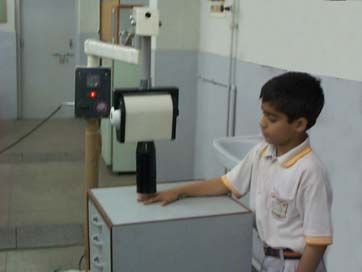
• The radiograph of middle phalanx of third finger (MP3) was taken with a standard
size (31 × 41 mm Kodak) periapical dental X-ray film by placing the hand with the
palm downward on a flat table in such a way that the middle phalanx was located in
the center of the film. The cone of the standard dental X-ray machine (60 kV and
7mA) was positioned in light contact with the middle phalanx perpendicular to the
dental X-ray film, with exposure time of 0.25 seconds.
FIGURE 1. Method of Recording MP3 Radiograph using dental Intraoral Periapical X-ray Film.4
• Standardized lateral cephalometric radiographs of each individual was taken with a
Universal counter balancing type of cephalostat.
All radiographs were processed with standardized processing technique and numbered for
identification. Radiographs of high clarity and good contrast were used, and
interpretation of all radiographs was undertaken without referring to clinical data or age
of patient.
• For radiographic interpretation of MP3 stages, (E3/4) stage was added in Hagg and
Taranger’s (1982)6 method of MP3 stages, and numbers were given for each stage
for convenience.
• To interpret CVMI, Hassel & Farman (1995)4 method was used in this study.5
Fig. 2: Stages of MP3, Hagg and Taranger (1982) 6
: Stage I (E3/4)
The epiphysis reaches 3/4 of the width of the diaphysis (Leite et
al.).
: Stage-2 (MP3-F)
The epiphysis is as wide as the metaphysis.
Stage-3 (MP3-FG)
The epiphysis is as wide as the metaphysis and there is a distinct
medial and/or lateral border of the epiphysis forming a line of
demarcation at right angle to the distal border.
Stage-4 (MP3-G
The sides of epiphysis have thickened and also cap its
metaphysis forming a sharp edge distally at one or both sides.
Stage-5 (MP3-H)
Fusion of epiphysis and metaphysis has begun.
Stage-6 (MP3-I)
Fusion of epiphysis and metaphysis is completed.6
Fig. 3: CVMI Stages Hassel & Farman (1995) 4
1. Initiation
Very significant amount of adolescent growth expected.
C2, C3 and C4 inferior vertebral body borders are flat.
CVMI – 1 Superior vertebral borders are tapered posterior to anterior.
2. Acceleration
Significant amount of adolescent growth expected.
Concavities developing in lower borders of C2 and C3.
CVMI – 2 Lower border of C4 vertebral body is flat.
C3 and C4 are more rectangular in shape.
3. Transition
Moderate amount of adolescent growth expected.
Distinct concavities in lower borders of C2 and C3.
CVMI – 3 C4 developing concavity in lower border of body.
C3 and C4 are rectangular in shape.
4. Deceleration
Small amount of adolescent growth expected.
Distinct concavities in lower borders of C2, C3 and C4.
C3 and C4 are nearly square in shape.
CVMI – 4
5. Maturation
Insignificant amount of adolescent growth expected.
Accentuated concavities of inferior vertebral body borders of
C2, C3 and C4.
C3 and C4 are square in shape.
CVMI – 5
6. Completion
Adolescent growth is completed.
Deep concavities are present for inferior vertebral body borders
of C2, C3 and C4.
C3 and C4 heights are greater than widths.
CVMI – 67
OBSERVATION:
Table 2: Showing Mean Age, Standard Deviation and Standard Error for male
and female subjects in different age groups.
Subgroup Group I (Male) Group II (Female) t p
Mean Sd Se Mean Sd Se
A (8-10 yrs) 8.92 0.72 0.16 8.97 0.75 0.17 0.03 NS
B (10-12 yrs) 10.90 0.59 0.13 10.57 0.60 0.14 1.97 NS
C (12-14 yrs) 12.96 0.63 0.14 12.89 0.62 0.14 0.34 NS
D (14-16 yrs) 14.75 0.55 0.12 14.61 0.46 0.10 0.87 NS
p>0.05 NS; p8
Group I (Male) Group II (Females)
7
5.8
6
4.6 4.8
Mean CVMI stage 5
4 3.3 3.4
3 1.9 2.1
2 1.3
1
0
A B C D
Subgroups
Fig. 4: Mean CVMI Stage for all subgroups in
male and female subjects
Group I (Male) Group II (Females)
7
5.8
6
4.6 4.8
5
Mean MP3 stage
4 3.3 3.35
3 2.15
1.85
2 1.35
1
0
A B C D
Subgroups
Fig. 5: Mean MP3 Stage for all subgroups in
male and female subjects
MP3 (Male) MP3 (Female)
7 5.9 5.99
6 4.94 4.99
5 3.97 3.99
4 3.01 2.99
3 2.02 1.99
2 1.01 0.99
1
0
1 2 3 4 5 6
Fig. 6: CVMI Maturity stage Vs. MP3 stages for
male and female subjects9
DISCUSSION
In orthodontics and dentofacial orthopedics, it is important to identify the
individual maturational levels of a child to evaluate expected developmental events.
During the circumpubertal period, children exhibit marked changes in the body
dimension and ossification processes. Every bone undergoes a series of change during
growth that can be seen radiographically. The sequence of changes is relatively consistent
for a given bone and its timing varies for every individual. It is not necessary for an
orthodontist to know the exact skeletal age of patient, but what is important to know is
the leftover growth potential during the period of treatment and the percentage of growth
expected at the time of treatment.
It has long been recognized that chronological age does not necessarily correlate
well with maturational age. One may be skeletally accelerated or delayed in terms of
1,2,3,6,7,8.9.10
maturational development
MP3 (middle phalanx of third finger) stages have been used as a part of the hand
and wrist radiographs to assess skeletal maturation or as an indicator of pubertal growth
spurt. 2,3,5,11,12,13
The purpose of this study was to investigate whether the MP3 (middle phalanx of
third finger) stages could be used to assess growth impetus and to provide the
orthodontist with a reliable tool to determine growth potential in adolescent patients.
The age group (8-16 years) selected in this study was on the basis of other
1,14,15,
maturation studies and as orthodontic treatment is frequently performed at this age
group, skeletal assessment becomes most critical.
On comparing the mean age of the male and female subjects in different
subgroups (A-D) as shown in Table 2, it is observed that they are insignificantly (p> .05)
different from each other. Insignificant differences in mean variation indicate that the
sample used in this study is homogenous.
The results of the study reveal that the maturation of the middle phalanx of third
finger and cervical vertebrae progress with advancing age. It can be seen from the Table
3 and 4 that there are gradually increasing stages of CVMI and MP3 stages with age. It10 was found that at the same chronological age, there was highly significant difference (p
11

CORRELATED STAGES OF MP3 (middle phalanx of third finger) AND CVMI

     CVMI-1          MP3 stage-1        CVMI-4             MP3 stage-4
                          (E3/4)                            (MP3-G)

     CVMI-2           MP3 stage-2           CVMI-5       MP3 stage-5
                        (MP3-F)                           (MP3-H)

     CVMI-3          MP3 stage-3            CVMI-6       MP3 stage-6
                       (MP3-FG)                           (MP3-I)
12
REFERENCES:
1. Robert N. Moore, Barbara A. Moyer and Linda A. D. Skeletal maturation and craniofacial
growth. Am J Orthod Dentofacial Orthop. 98; 33-40. 1990.
2. Leite R.H., Maria T.O’Reilly, and Close J.M. Skeletal age assessment using the first, second
and third fingers of the hand. Am. J. Orthod. 92; 492-508. 1987.
3. Fishman L.S. Radiographic evaluation of skeletal maturation-A Clinical oriented method based
on hand wrist film. Angle Orthod. 52(2); 88-112. 1982.
4. Hassel B. and Farman A. G. Skeletal Maturation evaluation using cervical vertebrae. Am. J.
Orthodontics and Dentofac Orthop. 107; 58-66. 1995.
5. Hagg U. & Taranger J. Skeletal stages of hand and wrist as indicators of the pubertal growth
spurt. Acta Odontol.Scand. 38; 187-200. 1980.
6. Hagg U. & Taranger J. Maturation indicator and the pubertal growth spurt. Am. J. Orthod.
82(4); 299-309,1982.
7. Nanda R. S.The rate of growth of several facial components measured from serial
cephalometric roentgenogram. Am. J. Orthodont. 41; 658-673. 1955.
8. Hunter C.J. The Correlation of Facial Growth and Skeletal Maturation At Adolescence. Angle
Orthod. 36: 44-54. 1966.
9. Fishman L.S. Chronological Versus Skeletal Age, an evaluation of Craniofacial growth. Angle
Orthod. 49; 181-189. 1979
10. Demirjian A., Buschang P.H., Tanguay & Patterson K. Interrelationships among measures of
somatic, skeletal, dental, and sexual maturity. Am. J. Orthod. 88(5); 433-438. 1985.
11. Gruelich W. W. and Pyle S. I. A Radiographic Atlas of Skeletal Development of Hand and
Wrist. 1959.
12. Hagg U. & Taranger J. Dental emergence stages and the pubertal growth spurt. Acta Odontol.
Scand. 39; 295-306. 1981
13. Grave K. C. and Brown T. Skeletal ossification and the adolescent growth spurt. Am J Orthod.
69; 611-619. 1976
14. Maria T. O’Railly & Yanniello G.J. Mandibular growth changes and maturation of cervical
vertebrae. Angle Orthod.179-184.1988;
15. Hellsing E. : Cervical vertebrae dimension in 8, 11, and 15 year old children. Acta Odontol.
Scand. 49; 207-213. 1991
16. Joseph J. The sesamoid bone of the hand and the time of fusion of the epiphysis of the thumb. J
Anat. 85; 230-241. 1951.
17. Fernandez P.G., Torre H., FJesus Rea.The cervical vertebrae as maturational indicators. JCO.
32(4); 221-225.1998.
18. Nazan Kucukkles, Ahu Acar, Sibel Biren, Tulin Arun: Comparisons between cervical vertebrae
and hand-wrist maturation for the assessment of skeletal maturity. J Clin Pediatr Dent. 24(1);
47-52, 1999.You can also read