Building a Legacy List. Grow. Lead - Mpho Ledwaba - JSE
←
→
Page content transcription
If your browser does not render page correctly, please read the page content below
Building a Legacy

List. Grow. Lead

Mpho Ledwaba

Disclaimer

•    This presentation is intended to provide general information regarding the [the basics of Shares and
     Investing], and is not intended to, nor does it, constitute investment or other professional or financial
     product advice and is not intended to be used as the basis for making an investment decision. It is prudent
     to consult professional advisers before making any investment decision or taking any action which might
     affect your personal finances or business.
•    This presentation has been prepared without taking into account the investment objectives, financial
     situation or particular needs of any particular person. Past performance is no guarantee of future
     performance.
•    The JSE Limited (“JSE”) and its respective directors, employees or agents do not, whether expressly, tacitly or
     implicitly, represent, warrant or in any way guarantee the fairness, accuracy or reliability of any advice,
     opinion, statement, completeness or correctness of the information or other data and information and
     conclusions contained in, displayed on, linked to or distributed through this presentation. To the maximum
     extent permitted by law neither the JSE and its respective directors, employees or agents, nor any other
     person accepts any liability, including, without limitation, any liability arising out of fault or negligence, for
     any loss arising from the use of the information contained in this presentation.
•    Your interaction, correspondence or business dealings with third parties which are referred to in this
     presentation are entirely at your own risk and are solely between you and such third party. You are solely
     responsible for identifying and familiarising yourself with any terms and conditions which will govern your
     relationship with such third party.
•    The JSE does not endorse and/or authorise any person and/or company selling software and/or training
     courses for and on behalf of the JSE.

                                                                                                                     2
About the JSE
Role of the JSE

•   Growth happens when connections are made

•   The role of the JSE is to be the link that fosters a fruitful connection

     • A connection between a buyer and a seller

     • A connection between an Issuer/listed companies and an Investor

     • A connection between African markets and global investors
What the JSE does

 •   The JSE as a very important gear in the larger machine
     that is the South African economy. We provide
     companies with a platform to raise the capital they need
     to expand and grow

 •   At the same time, the JSE also provides South Africans
     with the opportunity buy a stake in companies when
     they buy shares on the exchange.

 •   If you own a share, you own part of a company.
     Someone who owns one or more shares is called a
     shareholder

 •   Shares are sometimes referred to as stocks, equity or
     securities
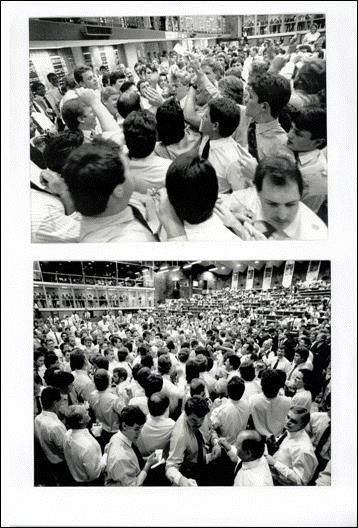
Brief History
• The Johannesburg Stock Exchange (the JSE) was founded by Benjamin Wollan on 8
November 1887. In November this year, the JSE will be 130 years old.
• After 108 years, the open outcry system of trading was changed to an electronic
system on 7 June 1996.
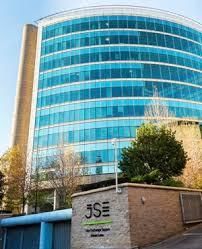
• In September 2000, the Johannesburg Securities Exchange moved to its present
location in Sandton.
• In 2003 the AltX, a board for small to medium sized companies.
• On 14 April 2014, the JSE re-branded, demonstrating an identity of a modern African
marketplace that connects investors to growth opportunities not only in South Africa
but globally.JSE-listed companies a diversified offering
Top 20 represents a global mix
Many leading South African companies have become significant regional and/or global players
Top 20 Companies
Oil & Gas Technology Utilities Additional
Anheuser-Busch InBev SA NV Industrials Telecomm.
0% 0% 0% 1%
British American Tob plc 3% 4%
Naspers Ltd -N- Health Care
Glencore plc 2%
Compagnie Fin Richemont
BHP Billiton plc Basic Mat.
Anglo American plc 19%
Firstrand Ltd
Steinhoff Int Hldgs N.V.
Vodacom Group Ltd Financials
19%
Standard Bank Group Ltd
Sasol Limited
MTN Group Ltd
Old Mutual Plc
South32 Limited
Sanlam Limited
Mondi plc
Aspen Pharmacare Hldgs Ltd
Cons Serv
Barclays Africa Grp Ltd
13%
Shoprite Holdings Ltd
Cons Goods
Remgro Ltd 39%
Nedbank Group Ltd
0 500 1 000 1 500 2 000 2 500
ZAR Billions
As at end July 2017IPO History
•Equity market cap at stands at R14.63 trillion
•384 Companies listed:
Dual listed companies: 94 (Primary Listings 44, Secondary 51)
Domestic: 311
Foreign: 73
Number of new listings (2003 - 2017)
70
60
50
40
2017
11companies
30
6 Main
5 AltX
20
10
0
2003 2004 2005 2006 2007 2008 2009 2010 2011 2012 2013 2014 2015 2016 2017
8Globally competitive
In top 20 global exchanges by market cap
330%
June 2017
280%
Shenzhen SE
230%
180%
Liquidity
NASDAQ (US)
Shanghai SE
130% Korea Ex
Japan Exchange Group
BME-Spanish Ex
BM&BOVESPA
NYSE
JSE
80%
Taiwan ASX
TMX
Deutche Boerse LSE
SIX Swiss
NSE India HKEX
30% SGX
SGX Bombay SE
Moscow
0 1000 2000 3000 4000 5000 6000 7000
-20%
# of Listed Companies
Source: WFE & Strate (JSE Local share register)Exposure to Africa’s consumers and assets
Continent’s exchanges in market cap and liquidity terms
80%
May 2017
70%
JSE
60%
50%
40% EGX
Liquidity
30%
20%
10% Nigeria
ZSE Morocco
BVMT
BSE BRVM
DSE
SEM
0% GSE
Kenya
LuSE NSX
# of listed companies
-10%
0 50 100 150 200 250 300 350 400 450
Note: Malawi & Uganda omitted due to small MCaps Source: African Alliance, ASEA, WFE & StrateCapital raised on the JSE
OVERVIEW 1 600.00
ZAR Billions
1 400.00
250.19
1 200.00
The JSE ranked 3rd in the World
for “Regulation of securities
exchanges” (WFE 2016/2017) 1 000.00
800.00
600.00 154 1 176.68 116.27
93
400.00 78
The JSE is ranked 1st in the World 549.88
88 464.99 505.99
for “financing through the local 200.00 365.3
equity market” (WEF 2016/2017)
107 81 187.8
77 64.16
0.00 14.49 39.04
2008 2009 2010 2011 2012 2013 2014 2015 2016
Bonds Equity capital
The totals may vary yearlySize and Liquidity around the globe
Top 20 Exchanges Market Cap as at July July 2017 Liquidity of the Top 20 Exchanges
2017 (USD Million
Shenzhen Stock Exchange
Nasdaq - US Shanghai Stock Exchange
Japan Exchange Group Inc. Nasdaq - US
Shanghai Stock Exchange Korea Exchange
Euronext Japan Exchange Group Inc.
LSE Group BME Spanish Exchanges
Hong Kong Exchanges and Clearing Deutsche Boerse AG
Shenzhen Stock Exchange Taiwan Stock Exchange
TMX Group BM&FBOVESPA S.A.
BSE India Limited Australian Securities Exchange
Deutsche Boerse AG SIX Swiss Exchange
National Stock Exchange of India… Johannesburg Stock Exchange
SIX Swiss Exchange LSE Group
Korea Exchange Nasdaq Nordic Exchanges
Nasdaq Nordic Exchanges National Stock Exchange of India…
Australian Securities Exchange Hong Kong Exchanges and Clearing
Johannesburg Stock Exchange Euronext
Taiwan Stock Exchange TMX Group
BME Spanish Exchanges Singapore Exchange
BM&FBOVESPA S.A. BSE India Limited
0.0 4 000 000.0 8 000 000.0 0% 50% 100% 150% 200% 250% 300%
Source: WFE 12How companies have grown by being
listed on the exchangeHow companies have grown from being listed on the JSE
• Listing date: 18 February 2012
• Share price upon listing: R1.80
• Share price today: R891.00
• Market cap when listing: R119 million
• Market cap today: R103 billion
Number 23 on the top 100
www.jse.co.zaHow companies have grown from being listed on the JSE
• Listing date: 12 September 2014
• Share price upon listing: R21.00
• Share price today: R2 917.41
• Market cap when listing: R2 billion
• Market cap today: R1.2 trillion
Number 3 on the top 100
www.jse.co.zaHow companies have grown from being listed on the JSE
• Listing date: 7 April 1936
• Share price in 1993: R17.00
• Share price today: R220.55
• Market cap in 1993: R784 million
• Market cap today: R132 billion
Number 18 on the top 100
*We only have data fromwww.jse.co.za
1993Success stories – being listed on the JSE
• Listing date: 2 June 2011
• Initially listed on AltX board (our board for
small to medium sized companies) and
within a year they moved to the main
board of the JSE
• Curro was founded in 1998 and started a
school with 28 learners in a church and
constructed first school in 1999
• Reason for listing: Needed capital to
support their vision of 40 schools by 2020
• Capital raised: R 800 000Success story – being listed on the JSE
• Listing date: 2 November 2012
• Reason for listing: assisted in giving
Delta Property Fund a better ability to
identify and close deals
• Delta Property Fund listed with 20
properties – this grew to over 80
properties in just over two years
• Capital raised: R 979 millionInvesting on the JSE
Assumptions

•   If you invested R 10 000
      • Simulation on just a few shares
      • Buy the shares and hold the shares
      • Share prices as at the 31 August 2017

•   The calculation does not include
     • Broker and related fees for trading
     • Dividends earned on the shares held
Dis-chem
15000
14000
13000 R13 734
12000
11000
10000
9000
8000
7000
6000
21Famous Brands
120000
100000
80000 R72 826
60000
40000
20000
0
22Delta Property Fund
14000
12000
10000
8000
6000
R 9014
4000
2000
0
2012/11/02 2013/11/02 2014/11/02 2015/11/02 2016/11/02
23Curro Holdings
160000
140000
120000
R96 089
100000
80000
60000
40000
20000
0
24Growthpoint Property
25000
20000
R16 268
15000
10000
5000
0
25Value for Listing & Value for investing
Some examplesDelta Property Fund
For the company For the Investor
Delta Prop. Fund historical market Delta Prop. Fund share price
cap since listing performance since listing
1200
7
Billions
6 1000
5 800
4
600
3
400
2
1 200
- 0
2012/11/02 2013/11/02 2014/11/02 2015/11/02 2016/11/02 2012/11/02 2013/11/02 2014/11/02 2015/11/02 2016/11/02
Capital raised on listing R 979 millionCurro
For the company For the Investor
Curro historical market cap since Curro share price performance since
listing listing
25 7000
Billions
20 6000
5000
15 4000
10 3000
2000
5
1000
0 0
Capital raised on listing R 51 millionDis-Chem Property Fund
For the company For the Investor
Dis-Chem historical market cap Dis-Chem share price performance
since listing since listing
30 3500
Billions
25 3000
2500
20
2000
15
1500
10 1000
5 500
0 0
Capital raised on listing R 4,3 BillionYou can also read