Melbourne Institute Nowcast of Australian GDP & Dating the Business Cycle - September 2021
←
→
Page content transcription
If your browser does not render page correctly, please read the page content below
MELBOURNE INSTITUTE
Applied Economic & Social Research

Melbourne Institute Nowcast of
Australian GDP & Dating the
Business Cycle

September 2021
Melbourne Institute Nowcast of Australian GDP
& Dating the Business Cycle                                                Released September 30, 2021

GDP grew by 0.7 per cent in the June quarter of 2021
On September 1, the ABS reported that GDP grew by 0.7 per cent in the June quarter of 2021, giving
an annual growth rate of 9.6 per cent and showing signs of continued recovery. According to the ABS,
household consumption grew by 1.1 per cent in the June quarter, contributing 0.6 percentage points
to GDP. Public expenditure, dwellings and business investment all contributed positively to growth,
while net exports subtracted approximately 1.0 percentage points from GDP. The next release of the
National Accounts, covering the September quarter of 2021, will be on December 1.
 Figure 1: GDP Growth (chain volume, per cent)        Figure 2: Contributions to GDP Growth (ppt)

 Source: ABS, up to June quarter 2021.                Source: ABS, up to June quarter 2021.

First nowcast for September quarter GDP
The first nowcast for the September-2021 quarter projects quarterly GDP growth of -3.6 per cent,
giving a year-ended growth rate of 2.0 per cent. Housing market activity is the primary positive
contributor to the GDP growth nowcast for Q3-2021. In contrast, retail trade has contributed
negatively to the first nowcast for Q3. Uncertainty regarding international economic conditions and
COVID-related lockdowns constitute key risk factors for growth in 2021/22. In October, the second
nowcast for Q3 will be released.
Economy estimated to have peaked in April
Despite the 0.7 per cent growth achieved in the June quarter overall, the Monthly Activity Index
suggests that Australian economy peaked in April. Using our nowcast, activity in September is
estimated to be approximately 1.5 per cent lower than at the peak. Several of the series utilised in the
construction of the Index have moved sharply lower; aggregate hours worked in August is a
noteworthy example.
Currently most economic indicators are only available up until August or earlier, so our estimates will
be revised once more data become available. One timely indicator that is available is the Westpac-
Melbourne Institute of Consumer Sentiment Index. This has fallen by 10.6 per cent since April, with
the largest fall in expectations about economic conditions in the next year (16.4 per cent). Interestingly,
respondents were more optimistic about their own family finances in the coming year, although it still
has declined by more than 7 per cent.
Hours worked declined in August1
The number of unemployed declined by nearly 40 per cent over the year to August. This is the fifth
successive decline since an increase of 8.5 per cent in March. However, underemployment also rose
to 9.3 per cent in August (from 8.3 per cent in July) suggesting that labour market conditions may be
weaker than suggested by unemployment numbers alone. Domestic final demand grew by 1.7 per
cent for the June quarter, down from 1.9 per cent growth during the March quarter.
Hours worked fell by 3.7 per cent in August, after 0.2 and 1.8 per cent declines in the preceding two
months. The sharp fall in August is likely a reflection of COVID-related lockdowns, with the NSW and
Victorian hours worked indices falling by 6.1 and 3.5 points respectively in August.
Figure 3: Unemployment and DFD Figure 4: Growth of hours worked
(year-ended growth, per cent) (monthly, per cent)
Source: ABS, up to August 2021 (unemployment). Source: ABS, up to August 2021.
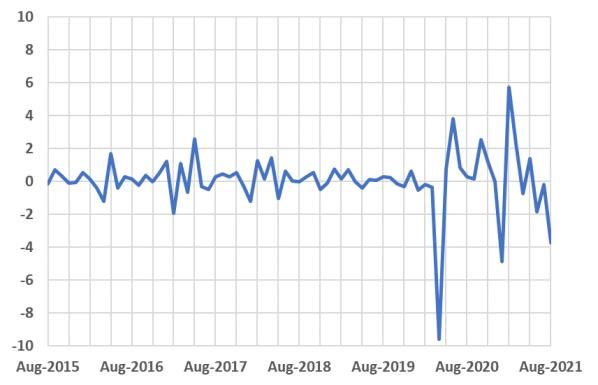
Net exports continue to grow, commodity prices moderate
The index of commodity prices fell by 4.6 per cent in August, after exhibiting significant growth in the
last few months. Notwithstanding August’s decline, growth in the commodity price index is still
approximately 50 per cent over the year to August. August’s index value reflects a sharp correction in
iron ore prices partially associated with uncertainty about demand from China.
Net exports rose by 9 per cent in July, after rising by 14 per cent in June. Both exports and imports
have risen substantially since the sharp declines observed in 2020, with annual growth in exports
reaching 35 per cent in July. Nevertheless, international conditions pose significant downside risks for
Australian trade in 2021/22.
Figure 5: Commodity Prices and Exports-to-GDP Figure 6: Trade balance
Ratio (year-ended growth, per cent) ($ billion)
Sources: ABS and RBA, up to August 2021 (commodity Source: ABS, up to July 2021.
prices).
1
Our nowcast model uses monthly information regarding labour market conditions, housing and business
lending, retail sales, housing approvals, consumer expectations, trade conditions and commodity prices to gauge
current economic conditions. We note that the nowcast is currently in the experimental stage.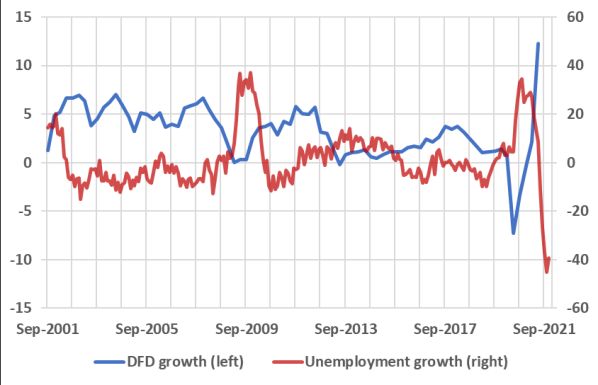
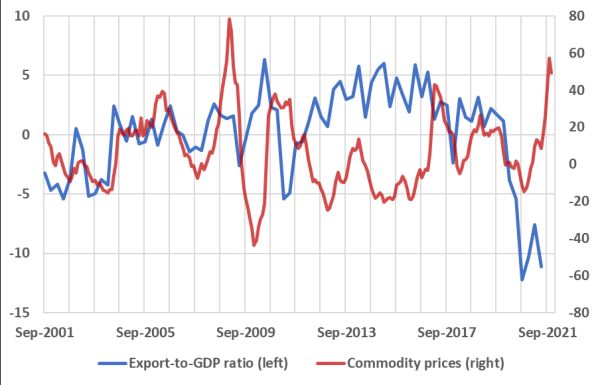
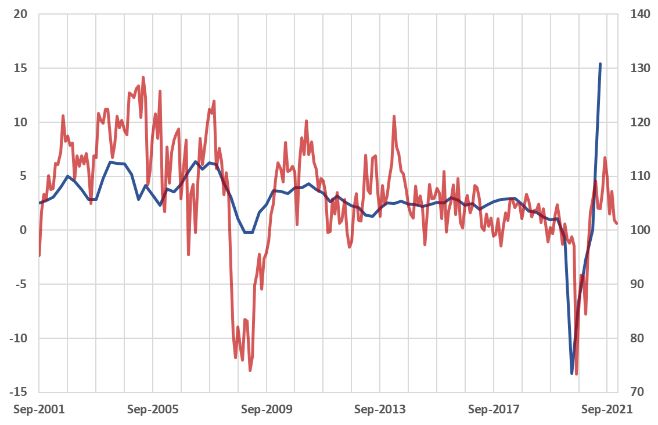
Consumer sentiment declined slightly in September, with non-food retail trade growth
also slowing.
The seasonally adjusted current conditions component of consumer sentiment fell slightly in
September (-0.7 points), after a sharper 5.2-point fall in August. The recent declines are likely to reflect
uncertainty about economic conditions associated with COVID lockdowns. Overall, the index is close
to 100, with the number of optimists only marginally exceeding the number of pessimists.
Retail trade data shows that annual growth in non-food related retail trade was nearly negative 10 per
cent in July. In the past few months, there appears to be a reversal of the inordinate growth observed
in non-food retail trade during 2020. In contrast, food-related retail trade has been relatively stable in
the past few months, with annual growth rising from negative 0.5 per cent in June to 0.3 per in July.
 Figure 7: Consumer Sentiment and Consumption           Figure 8: Retail trade
 (index and year-ended growth, per cent)                (year-ended growth, per cent)

 Source: ABS and Melbourne Institute, up to September   Source: ABS, up to August 2021.
 2021 (consumer sentiment).

The housing market continues its strong run, business credit growth turns positive
Housing approval data in July shows that nearly 12 thousand dwellings were approved. As such,
monthly dwelling approvals have exceeded 10 thousand for eleven consecutive months. Annual
growth in dwelling approvals, however, fell from 43 per cent in June to 27 per cent in July. This
supports the argument that dwelling approvals peaked over the February to April period (with annual
growth in dwelling approvals peaking at 73 per cent in April).
Annual growth in housing-related bank lending rose to 5.8 per cent in July, after growing by 5.3 per
cent in June. This is consistent with a combination of higher prices and significant dwelling approval
numbers. Moreover, annual growth in business lending was 2.4 per cent in July. Although the latter
rate of growth may appear small, it follows a sustained period of declining (and even negative) annual
growth in business lending.
 Figure 9: Dwelling Approvals and Residential            Figure 10: Housing Credit and Business Credit
 Investment                                              (year-ended growth, per cent)
 (year-ended, per cent)

 Source: ABS, up to July 2021 (approvals).               Source: RBA, up to July 2021.
Dating the Australian Business Cycle
The Melbourne Institute uses a Monthly Activity Index, together with the nowcast and a rule to
identify turning points, to date whether the Australian economy may be in a recession.2
The Monthly Activity Index is constructed so that, at the quarterly frequency, it coincides with the log
of real quarterly GDP to ensure that both data set exhibits similar turning points. Essentially our
approach interpolates the quarterly values in history, guided by monthly partial indicators of the state
of the economy.3 Table 1 identifies the turning points (as in peaks and troughs) and the periods of
contractions and expansions in business cycle analysis using monthly data.
Business cycles based on quarterly ABS GDP data are shown in Table 2. A better measure of the living
standards of Australians is GDP per capita. Expansions and contractions in GDP per capita are shown
in Table 3.
The Monthly Activity Index, combined with our nowcast for the September quarter, suggests that the
Australian economy peaked in April, and currently is in a recession. Whether this will be borne out by
the official GDP and GDP per capita data is uncertain as two quarters of negative growth would also
require a fall in the December quarter. Last year the Australian economy rebounded strongly once
lockdowns were relaxed. While the timing of some aspects of the reopenings are contingent on
vaccination targets being reached, given the current rates of vaccinations it appears likely that the
reopenings will occur sufficiently early in the December quarter that a further fall in output may not
occur.

                                    Table 1: Monthly Business Cycle Dates
                                    Contraction             Expansion                           Cycle
       Peak         Trough
                                   peak to trough         trough to peak         peak to peak       trough to trough
                                     (months)                (months)             (months)              (months)
    May-1975      Nov-1975                 6
    Sep-1981      May-1983                20                     70                   76                   90
    Mar-1990       Jun-1991               15                     82                   102                  97
    Mar-2020      May-2020                 2                    345                   360                  347
     Apr-2021                         Ongoing
    Averages
                                          10                    127                   179                  178
    Standard deviations                    7                    149                   157                  146
Note: The average durations are rounded to full months. Includes the ongoing phase. Sample is 1974:09- 2021:09.

2
  The rule is known as Bry-Boschan Quarterly (BBQ). See A. R. Pagan and D. Harding (2002) “Dissecting the cycle:
a methodological investigation’, Journal of Monetary Economics, 49(2), p. 365-381. Also see
http://www.ncer.edu.au/data/data.jsp. The commonly quoted “two-quarters of negative growth” rule to define
a recession is an approximate way of identifying turning points in the level of economic activity.
3
  The data used are: the Westpac-Melbourne Institute Consumer Sentiment Index (time to buy a major
household item and family finances versus a year ago); retail trade; the trimmed-mean CPI; the Melbourne
Institute Inflation Gauge; monthly imports; the real and nominal trade-weighted exchange rate and aggregate
hours worked. We construct the Monthly Activity Index from 1974:09 onwards due to availability of the monthly
data. The MI Monthly Activity Index is currently still in development (particularly its open economy aspects).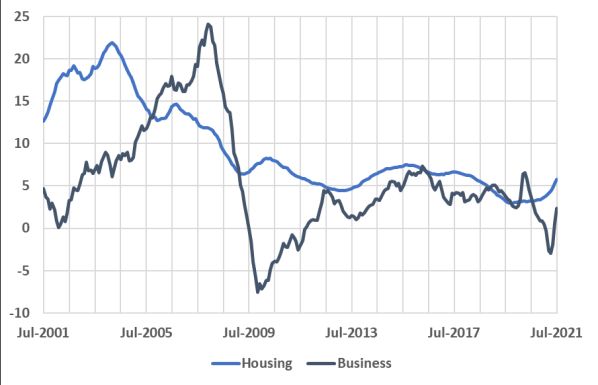
Table 2: Real GDP Business Cycle Dates

                                        Contraction       Expansion                        Cycle

        Peak              Trough
                                           Peak to        Trough to           Peak to              Trough to
                                            trough          peak               peak                  trough
                                          (quarters)      (quarters)         (quarters)            (quarters)
     Mar-1961           Sep-1961               2
     Jun-1965           Mar-1966               3             15                  17                   18
     Sep-1971           Mar-1972               2             22                  25                   24
     Jun-1975           Dec-1975               2             13                  15                   15
     Jun-1977           Dec-1977               2              6                   8                    8
     Sep-1981           Jun-1983               7             15                  17                   22
     Jun-1990           Jun-1991               4             28                  35                   32
     Dec-2019           Jun-2020               2             114                 118                  116
                                                           ongoing
          Average durations                    3             25                   30                   34
         Standard deviations                   2             34                   37                   37
Note: The average durations and standard deviations are rounded to full quarter. Includes the ongoing phase. Sample is
1959:Q3 – 2021:Q2.

                                    Table 3: Cycles in Real GDP per Capita

                                       Contraction        Expansion                        Cycle

         Peak            Trough
                                          Peak to         Trough to            Peak to             Trough to
                                           trough           peak                peak                 trough
                                         (quarters)       (quarters)          (quarters)           (quarters)
                        Jun-1974
      Jun-1975          Dec-1975              2               4                                        6
      Jun-1977          Dec-1977              2               6                    8                   8
      Sep-1981          Jun-1983              7              15                   17                   22
      Sep-1985          Sep-1986              4               9                   16                   13
      Dec-1987          Jun-1988              2               5                    9                   7
      Sep-1989          Dec-1991              9               5                    7                   14
      Jun-2000          Dec-2000              2              34                   43                   36
      Dec-2005          Jun-2006              2              20                   22                   22
      Mar-2008          Dec-2008              3               7                    9                   10
      Sep-2019          Jun-2020              3              43                   46                   46
                                                           ongoing
          Average durations                   4              14                   19                   17
         Standard deviations                  2              13                   15                   13
Note: The average durations and standard deviations are rounded to full quarter. Includes the ongoing phase. Sample is
1973:Q3 – 2021:Q2.
Melbourne Institute Nowcast of Australian GDP & Dating the Business Cycle
The Melbourne Institute Nowcast of Australian GDP and the Monthly Index used to date the business
cycle use monthly information regarding labour market conditions, housing and business lending,
retail sales, housing approvals, consumer expectations, trade conditions and commodity prices in
order to gauge current economic conditions.
We note that the nowcast and the dating methodology are currently in the experimental stage.
Disclaimer: The University of Melbourne and the Melbourne Institute give no representation, make
no warranty, nor take any responsibility as to the accuracy or completeness of any information
contained herein and will not be liable in contract tort, for negligence or for any loss or damage
arising from reliance on any such information. The Melbourne Institute Nowcast of Australian GDP
presents the professional analysis and views of the Melbourne Institute.
For information on the data contained in the report contact the Melbourne Institute, The University
of Melbourne, on (03) 8344 2196.
© The University of Melbourne, Melbourne Institute: Applied Economic and Social Research.
This report is copyright. Apart from any fair dealing for the purposes of study, research, criticism or
review, as permitted under the Copyright Act, no part may be reproduced without written
permission.
For more information about the Melbourne Institute, see:
http://melbourneinstitute.unimelb.edu.au/
For more information about Macro@MI and other reports see:
http://melbourneinstitute.unimelb.edu.au/research-programs/macroeconomicsYou can also read