ASPEKT Method: Supplemental Material - Analysis of Swallowing Physiology: Events, Kinematics & Timing (ASPEKT) - Swallowing Rehabilitation ...
←
→
Page content transcription
If your browser does not render page correctly, please read the page content below
ASPEKT Method:
                                 Supplemental Material

                                Analysis of Swallowing Physiology:
                               Events, Kinematics & Timing (ASPEKT)

Steele Swallowing Lab © 2021                                                Page 1 of 9
                                                                      V2.0 (Apr 5 2021)
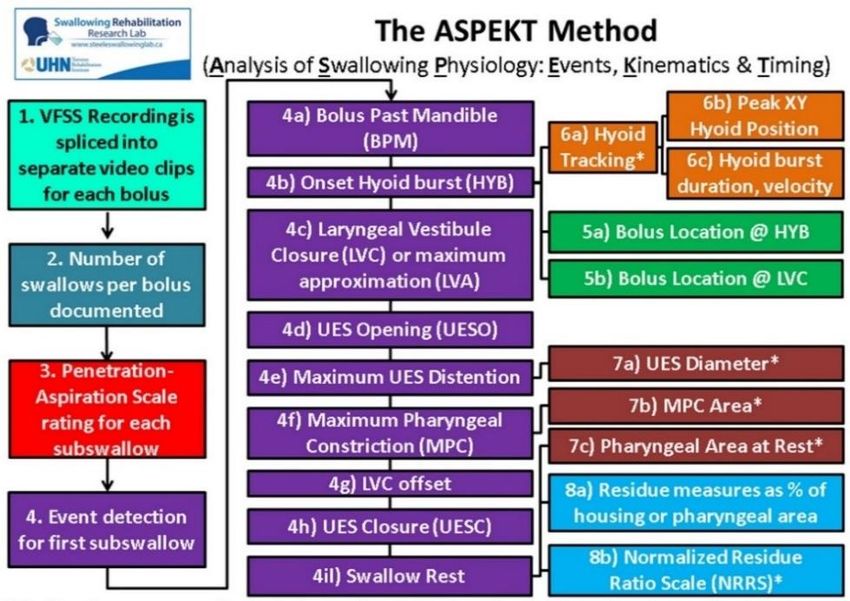
ASPEKT Method Background
Beginning in April, 2019, the Steele Swallowing Lab of the KITE Research Institute at the Toronto Rehabilitation
Institute – University Health Network published a pair of open articles exploring swallowing physiology across the
range from thin to extremely thick liquids,
in healthy adults (Steele et al., 2019;
Smaoui et al., 2021). Both of the articles
describe swallowing in healthy adults,
collected using a standardized
videofluoroscopy protocol and analyzed
using a standard operating procedure. The
analysis method was entitled the ASPEKT
Method (Analysis of Swallowing Physiology:
Events, Kinematics and Timing) (see Figure
1) and is described in a detailed in Steele
and colleagues (2019). In addition to that
appendix, this supplementary document
contains healthy reference values for the
measures that are collected in the ASPEKT
Method, and explains how clinicians can
use these reference values to determine Figure 1: The ASPEKT Method (Steele et al., 2019)
whether or not values in their patients are
impaired.
How were the ASPEKT Method healthy reference values collected?
In order to use reference values from healthy volunteers, it is important to understand how those healthy reference
values were collected to determine if they can be compared to your individual clinical setting and patients. The
healthy reference values for the ASPEKT Method were collected under the conditions described below:
Healthy adult participants aged under 60 years old.
Videofluoroscopy acquired at 30 unique images (i.e. a videofluoroscopy pulse rate of 30 pulses per second,
captured on a synchronized recording system at 30 frames per second).
Low concentration (20%w/v) barium (Bracco E-Z-Paque) mixed with water (Barbon and Steele, 2019).
Thickened stimuli prepared with a xanthan-gum based thickening agent (Nestlé ThickenUp Clear).
Stimuli developed to meet the 5 drink levels of the International Dysphagia Diet Standardisation Initiative
framework (www.IDDSI.org): Level 0 thin, Level 1 slightly thick, Level 2 mildly thick, Level 3 moderately
thick, and Level 4 extremely thick.
Participants self-administered comfortable sips of IDDSI level 0 thin, level 1 slightly thick and level 2 mildly
thick liquids and self-administered teaspoons of IDDSI level 3 moderately and level 4 extremely thick
liquids.
A non-cued spontaneous swallow paradigm was used. Participants swallowed when they felt ready,
without waiting for a cue from the research team.
For clinical data collected under conditions that are different from those listed above, the strict ASPEKT Method
reference values may not apply. Assessing how modifications of those conditions influence the ability to compare
clinical values to the ASPEKT Method reference values is difficult. While there is some information in the literature
that can guide how to interpret these differences, in many cases it is simply unknown.
Steele Swallowing Lab © 2021 Page 2 of 9
V2.0 (Apr 5 2021)
Why is it important to compare patient values to healthy reference values?
There are many situations in clinical medicine where patient values are compared to healthy reference values. Two
common examples are described below:

a) Height and weight charts for children
        It is routine to assess growth and nutritional status in infancy, childhood and adolescence (up to 19 years of
        age) by comparing individual growth measurements against growth data or growth charts from a reference
        (‘normal’) population (a “growth reference” or “growth standard”). Figure 2, below, is a reference chart
        published by the World Health Organization for weight and height in girls up to age 5 years. By comparing the
        height and weight of a girl to this chart, a clinician or parent can understand whether the child is relatively
        tall or of typical weight for their age.

              Figure 2. WHO Child Growth Standards Weight-for-age: Birth to 5 years percentiles chart for girls.
                         Source: http://www.who.int/childgrowth/standards/chts_wfa_girls_p/en/

b) Interpreting blood test results
        When a blood sample is sent to a lab, the goal is to compare the values of various components of the blood
        sample to healthy reference values, to understand whether or not there is a problem. For example, a test
        might determine whether a person has sufficient iron or is anemic, whether they have high or low sodium or
        potassium, whether they have an adequate number of red blood cells, hemoglobin or platelets, or whether
        they have higher-than-usual numbers of white blood cells suggesting infection. Reference tables that are
        used for interpreting blood tests and other laboratory tests in Canada can be found at:
        https://mcc.ca/objectives/normal-values/?cn-reloaded=1.

The goal of the ASPEKT Method is to provide clinicians with reference values for healthy swallowing,
which will enable them to determine which components of swallowing (if any) are impaired.

Steele Swallowing Lab © 2021                                                                                 Page 3 of 9
                                                                                                       V2.0 (Apr 5 2021)
The Statistical Definition of Normal Reference Ranges
If you think back to the grades you received on examinations in university, you will be familiar with the concept of a
“bell curve”. A bell curve (Figure 3) is the usual (or expected) shape of the distribution of grades on an exam,
organized by their frequency of occurrence. The measure of central tendency on a bell curve is the average score, or
mean, and it is common to describe how far a value is from the mean using standard deviations.
Figure 3: Example of normally distributed data. The blue shaded range shows values falling within one standard
deviation on either side of the mean, with those 1 standard deviation boundaries shown by the red dashed lines.
For data that are normally distributed, there are a few rules:
the shape of the curve is symmetrical;
the mean and the median have the same value;
68% of the data will fall within 1 standard deviation of the mean;
an additional 27% of the data will fall in the ranges between the 1st and 2nd standard deviations on either side
of the mean, accounting, in total for 95% of the data;
an additional 4.7% of the data will fall in the ranges between the 2nd and 3rd standard deviations on either
side of the mean.
It is conventional to describe the 5% of data in the tails of the distribution, more than 2 standard deviations from the
mean, as “abnormal”.
The original ASPEKT Method manuscript and its supplement contain reference value tables reporting
means and standard deviations (SD) for measures of swallowing physiology.
Steele Swallowing Lab © 2021 Page 4 of 9
V2.0 (Apr 5 2021)Why it might not be appropriate to use means and standard deviations to
define normal versus abnormal values for measures of swallowing
Over the course of developing the ASPEKT Method and ASPEKT Reference Values, we have come to believe that
means and standard deviations may not, in fact, be the most appropriate values to use to define “normal” values for
measures of swallowing. There are two reasons for this opinion:
1) Most of the swallowing data that we have collected from healthy adults does not, in fact, display a symmetrical
bell-curved normal distribution. Instead, many of the parameters that we are interested in measuring in patients
display what is called a “positive skew”, where the most common values are either a value of zero or a value close to
zero. A good example of this would be measures of residue. In healthy people, we expect to see either no
pharyngeal residue or very little pharyngeal residue.
2) When we think about measures of swallowing in a clinical context, most of the parameters that we are interested
in are uni-directional (rather than bi-directional). Residue is a good example here, as well. As clinicians, we are
interested in whether our patients display MORE residue than normal and it is of little clinical interest to know if a
patient displays LESS residue than normal.
Figure 4, below, illustrates a positively skewed data distribution
75th %ile
Figure 4: Example of positively skewed data distribution.
Blue shaded range showing values falling within the the75th percentile boundary.
In statistical terms, it is common to use percentile boundaries across the frequency distribution of a skewed
parameter to define values that are “normal” versus “abnormal”. The median (or 50th percentile) is the measure of
central tendency; half of the observed values fall below this value, while the other half fall above this value.
The 75th percentile (p75) is analogous to 1 standard deviation above the mean on a normal distribution; in the
opposite direction, the 25th percentile (p25) is analogous to 1 standard deviation below the mean on a normal
distribution. The range between p25 and p75 is known as the interquartile range. Half of the observed values fall
within the interquartile range, while 25% of the observed values fall below this range (below p25) and the remaining
25% fall above this range (above p75).
The 5th percentile (p5) and the 95th percentile (p95) can be used to define the 5% tails of the distribution.
Steele Swallowing Lab © 2021 Page 5 of 9
V2.0 (Apr 5 2021)Using the Reference Tables with Your Patient’s Values
Given that many swallowing parameters have skewed distributions, we propose that clinicians should use percentile
ranges from the healthy reference data as the guide for interpreting values seen in their patients. We suggest that
patient values can be classified as follows:
Typical = Values that fall in the interquartile range, between p25 and p75 of the healthy reference distribution
Atypical low = Values that fall below p25 of the healthy reference distribution
Atypical high = Values that fall above p75 of the healthy reference distribution
Extremely low = Values that fall below p5 of the healthy reference distribution
Extremely high = Values that fall above p95 of the healthy reference distribution
To use these reference tables, follow these steps:
1. Look at the reference values in the p25 and p75 columns.
2. If your patient’s value falls between these reference values, it is within normal limits (i.e. “typical”).
3. If your patient’s value is outside these reference values it is atypical (either low or high).
4. If your patient’s value is atypical, look at the reference values in the p5 and p95 columns.
5. If your patient’s value falls outside these reference values, it is an extreme value.
On the following pages, you will find reference data including means, standard deviations and percentiles for
measures of sip volume, timing measures and pixel-based measures of healthy swallowing, by consistency.
What about ASPEKT Method parameters that are categorical?
Some parameters in the ASPEKT Method are not continuous but behave in a categorical fashion. These include the
number of swallows per bolus (most commonly one), Penetration-Aspiration Scale Scores, and Laryngeal Vestibule
Closure (LVC) integrity. The reference values for typical, atypical or extreme values of these categorical parameters
are summarized below and are based on the observed frequencies of occurrence in the ASPEKT Method healthy
reference value dataset.
Parameter Name Consistency Typical Atypical Extreme
Thin
Slightly thick
Number of 3 or more
Mildly thick 1 2
Swallows per Bolus
Moderately thick
Extremely thick
Thin
Slightly thick
Penetration-Aspiration
Mildly thick 1 2 3 or worse
Scale Scores
Moderately thick
Extremely thick
Thin
Laryngeal Vestibule Slightly thick
Closure (LVC) Mildly thick Complete Partial Incomplete
Integrity Moderately thick
Extremely thick
Steele Swallowing Lab © 2021 Page 6 of 9
V2.0 (Apr 5 2021)ASPEKT Method: IDDSI Level 0 Thin Reference Values
Standard 5th %ile 25th %ile 50th %ile 75th %ile 95th %ile
Parameter Name (Unit) Mean
Deviation (p5) (p25) (p50) (p75) (p95)
Sip Volume (ml) (natural sip from cup) 11 5 4 8 11 15 20
Swallow Reaction Time (i.e., bolus passing mandible to hyoid burst) (ms) 130 183 - 67 0 67 167 577
Hyoid-Burst-to-UES-Opening Interval (ms) 109 57 33 67 100 133 234
Upper Esophageal Sphincter (UES) Opening Duration (ms) 456 62 367 400 467 500 567
Time-to-LVC (i.e., time from hyoid burst to LVC) (ms) 185 103 33 100 167 259 399
Laryngeal Vestibule Closure (LVC) Duration (ms) 460 162 300 367 434 500 691
Vallecular Residue %(C2-4)2 0 1 0 0 0 0 2
Pyriform Sinus Residue %(C2-4)2 0 1 0 0 0 0 1
Other Pharyngeal Residue %(C2-4)2 0 0 0 0 0 0 1
Total Pharyngeal Residue %(C2-4)2 1 2 0 0 0 1 3
Pharyngeal Area at Maximum Constriction (PhAMPC) %(C2-4)2 1 1 0 0 0 2 4
UES Diameter %(C2-4)2 21 7 10 16 20 25 32
ASPEKT Method: IDDSI Level 1 Slightly Thick Reference Values
Standard 5th %ile 25th %ile 50th %ile 75th %ile 95th %ile
Parameter Name (Unit) Mean
Deviation (p5) (p25) (p50) (p75) (p95)
Sip Volume (ml) (natural sip from cup) 9 4 3 6 9 12 16
Swallow Reaction Time (i.e., bolus passing mandible to hyoid burst) (ms) 179 260 - 33 0 67 267 797
Hyoid-Burst-to-UES-Opening Interval (ms) 120 60 23 100 133 167 234
Upper Esophageal Sphincter (UES) Opening Duration (ms) 441 65 334 400 434 467 567
Time-to-LVC (i.e., time from hyoid burst to LVC) (ms) 178 89 67 100 167 234 367
Laryngeal Vestibule Closure (LVC) Duration (ms) 446 172 267 367 417 500 701
Vallecular Residue %(C2-4)2 1 1 0 0 0 1 2
Pyriform Sinus Residue %(C2-4)2 0 1 0 0 0 0 2
Other Pharyngeal Residue %(C2-4)2 0 0 0 0 0 0 1
Total Pharyngeal Residue %(C2-4)2 1 2 0 0 0 1 6
Pharyngeal Area at Maximum Constriction (PhAMPC) %(C2-4)2 1 1 0 0 0 2 4
UES Diameter %(C2-4)2 19 6 10 15 18 22 29
Page 7 of 9
Steele Swallowing Lab © 2021 V2.0 (Apr 5 2021)ASPEKT Method: IDDSI Level 2 Mildly Thick Reference Values
Standard 5th %ile 25th %ile 50th %ile 75th %ile 95th %ile
Parameter Name (Unit) Mean
Deviation (p5) (p25) (p50) (p75) (p95)
Sip Volume (ml) (natural sip from cup) 9 4 3 6 8 11 18
Swallow Reaction Time (i.e., bolus passing mandible to hyoid burst) (ms) 205 286 - 33 0 100 300 914
Hyoid-Burst-to-UES-Opening Interval (ms) 124 59 33 92 133 167 209
Upper Esophageal Sphincter (UES) Opening Duration (ms) 446 80 334 400 434 500 601
Time-to-LVC (i.e., time from hyoid burst to LVC) (ms) 159 77 33 100 133 200 314
Laryngeal Vestibule Closure (LVC) Duration (ms) 453 134 300 367 434 509 667
Vallecular Residue %(C2-4)2 1 1 0 0 0 1 3
Pyriform Sinus Residue %(C2-4)2 0 1 0 0 0 0 2
Other Pharyngeal Residue %(C2-4)2 0 0 0 0 0 0 1
Total Pharyngeal Residue %(C2-4)2 1 2 0 0 1 2 5
Pharyngeal Area at Maximum Constriction (PhAMPC) %(C2-4)2 2 2 0 0 1 3 6
UES Diameter %(C2-4)2 18 5 11 14 18 22 27
ASPEKT Method: IDDSI Level 3 Moderately Thick Reference Values
Standard 5th %ile 25th %ile 50th %ile 75th %ile 95th %ile
Parameter Name (Unit) Mean
Deviation (p5) (p25) (p50) (p75) (p95)
Sip Volume (ml) (via teaspoon) 5 3 2 3 4 6 11
Swallow Reaction Time (i.e., bolus passing mandible to hyoid burst) (ms) 315 420 - 67 0 100 567 1208
Hyoid-Burst-to-UES-Opening Interval (ms) 150 56 67 100 133 200 234
Upper Esophageal Sphincter (UES) Opening Duration (ms) 415 74 300 367 400 467 544
Time-to-LVC (i.e., time from hyoid burst to LVC) (ms) 154 63 67 100 133 200 267
Laryngeal Vestibule Closure (LVC) Duration (ms) 448 148 300 367 434 500 676
Vallecular Residue %(C2-4)2 0 1 0 0 0 0 2
Pyriform Sinus Residue %(C2-4)2 0 0 0 0 0 0 1
Other Pharyngeal Residue %(C2-4)2 0 0 0 0 0 0 1
Total Pharyngeal Residue %(C2-4)2 1 1 0 0 0 1 2
Pharyngeal Area at Maximum Constriction (PhAMPC) %(C2-4)2 1 1 0 0 0 1 3
UES Diameter %(C2-4)2 16 5 9 12 14 19 26
Page 8 of 9
Steele Swallowing Lab © 2021 V2.0 (Apr 5 2021)ASPEKT Method: IDDSI Level 4 Extremely Thick Reference Values
Standard 5th %ile 25th %ile 50th %ile 75th %ile 95th %ile
Parameter Name (Unit) Mean
Deviation (p5) (p25) (p50) (p75) (p95)
Sip Volume (ml) (via teaspoon) 5 3 2 3 5 6 10
Swallow Reaction Time (i.e., bolus passing mandible to hyoid burst) (ms) 364 509 -67 0 67 617 1741
Hyoid-Burst-to-UES-Opening Interval (ms) 154 52 67 133 133 200 249
Upper Esophageal Sphincter (UES) Opening Duration (ms) 404 69 300 367 400 434 547
Time-to-LVC (i.e., time from hyoid burst to LVC) (ms) 147 57 67 100 133 167 267
Laryngeal Vestibule Closure (LVC) Duration (ms) 434 87 322 367 434 500 601
Vallecular Residue %(C2-4)2 0 1 0 0 0 0 2
Pyriform Sinus Residue %(C2-4)2 0 0 0 0 0 0 1
Other Pharyngeal Residue %(C2-4)2 0 0 0 0 0 0 1
Total Pharyngeal Residue %(C2-4)2 1 1 0 0 0 1 3
Pharyngeal Area at Maximum Constriction (PhAMPC) %(C2-4)2 1 1 0 0 0 1 3
UES Diameter %(C2-4)2 17 5 9 13 17 20 25
What do I do, if I have questions?
Questions regarding the ASPEKT Method can be sent by email to tri-swallowinglab@uhn.ca.
References
Barbon, C. E. A. & Steele, C. M. (2019). Characterizing the flow of thickened barium and non-barium liquid recipes using the IDDSI Flow Test. Dysphagia,
34(1), 73-79. https://link.springer.com/article/10.1007/s00455-018-9915-6
Steele, C. M., Peladeau-Pigeon, M., Barbon, C. E. A., Guida, B. T., Namasivayam-MacDonald, A. M., Nascimento, W. V., Smaoui, S., Tapson, M. S.,
Valenzano, T. J., Waito, A. A., Wolkin, T. S. (2019). Reference values for healthy swallowing across the range from thin to extremely thick liquids. Journal
of Speech, Language, and Hearing Research, 62(5), 1338-1363. https://doi.org/10.1044/2019_JSLHR-S-18-0448
Smaoui, S., Peladeau-Pigeon, M. & Steele, C. M. (2021). Variations in Hyoid Kinematics across Liquid Consistencies in Healthy Swallowing. Journal of
Speech, Language and Hearing Research, 64(1), 51-58. https://doi.org/10.1044/2020_JSLHR-20-00508
Page 9 of 9
Steele Swallowing Lab © 2021 V2.0 (Apr 5 2021)You can also read