Cloud Classification Based on Images Texture Features
←
→
Page content transcription
If your browser does not render page correctly, please read the page content below

IOP Conference Series: Materials Science and Engineering

PAPER • OPEN ACCESS

Cloud Classification Based on Images Texture Features
To cite this article: I Nurtanio et al 2019 IOP Conf. Ser.: Mater. Sci. Eng. 676 012015

View the article online for updates and enhancements.

                                This content was downloaded from IP address 46.4.80.155 on 10/07/2021 at 14:38
The 2nd EPI International Conference on Science and Engineering                            IOP Publishing
IOP Conf. Series: Materials Science and Engineering 676 (2019) 012015 doi:10.1088/1757-899X/676/1/012015

Cloud Classification Based on Images Texture Features

                     I Nurtanio1*, Z Zainuddin1 and B H Setiadi2
                     1
                      Department of Informatics, Engineering Faculty, Hasanuddin University, Indonesia
                     2
                      Department of Electrical Engineering, Engineering Faculty, Hasanuddin University, Indonesia

                     *Email: ingrid@unhas.ac.id

                     Abstract. An identification of cloud imagery is part of the cloud observation process which is
                     very important to know the potential for weather changes, especially in the Sultan Hasanuddin
                     airport area. The purpose of this research is to build an artificial intelligence model to identify
                     and classify texture patterns of cloud images. The research used 80 clouds images data
                     contained in the Sultan Hasanuddin Airport area. The data consist of four types of clouds,
                     Altocumulus, Cirrus, Cumulonimbus and Cumulus. In this research, a feature extraction
                     process using Gray Level Co-occurrence Matrix (GLCM) algorithm and Support Vector
                     Machine (SVM) is used for the classification process. We used a set of 4 GLCM features. The
                     4 selected features are contrast, correlation, energy and homogeneity. Training and testing data
                     using cross validation method with three stages validation. The highest level of accuracy is
                     found in the third stage validation with an accuracy value of 85%.

1. Introduction
In aviation, the cloud is one of the things that determines flight fluency and safety, especially the type
of Cumulonimbus (CB) cloud. This cloud is much feared in flight because it can cause updraft,
downdraft and wind shear (unexpected wind speed changes). If the plane is in or under this cloud at
the time after takeoff, before landing, or during flight will cause dangerous aircraft position instability
[1].
    Cloud identification model is one of the things needed in the field of Meteorology and in the field
of Air Traffic Regulators. This research creates a model to determine the shape and type of clouds
using artificial intelligence which is expected to help Observer in the field of Meteorology or Air
Traffic Regulator.
    Previous research has discussed identifying cloud patterns and textures. and the effect of cloud
cover on solar cell voltage (photovoltaic) [2]. The study calculated the effect of cloud cover on
sunlight which is the input of solar cell voltage which is divided into four parts of the cloud
conditions, clear skies, thin clouds, thick clouds and dark clouds. Zhao Zhen used the Gray Level Co-
occurrence Matrix (GLCM) for extracting cloud features and SVM for the classification process. The
success rate of accuracy using this method is 96.44%. Other research discussed using the GLCM and
SVM methods for classification of acne based on texture [3]. In this research, texture analysis uses
values from feature extraction in the GLCM method. Feature extraction is obtained by calculating the
neighboring relationship between two pixels at an orientation of 0º, 45º, 90º and 135º. The five
statistical characteristics used in the GLCM method are contrast, correlations, dissimilarity, energy,
entropy. Accuracy generated in the study reached 72%.
    Based on previous research, the GLCM and SVM method can analyze texture patterns well. In this
research, identification of cloud images has some fundamental problems. That is the extraction of

              Content from this work may be used under the terms of the Creative Commons Attribution 3.0 licence. Any further distribution
              of this work must maintain attribution to the author(s) and the title of the work, journal citation and DOI.
Published under licence by IOP Publishing Ltd                          1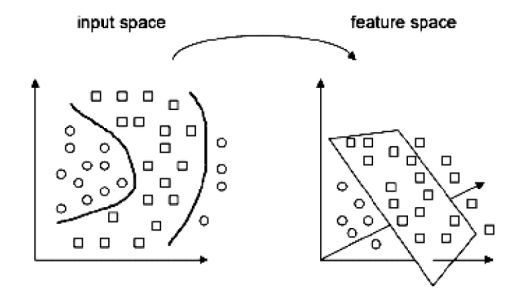
The 2nd EPI International Conference on Science and Engineering                            IOP Publishing
IOP Conf. Series: Materials Science and Engineering 676 (2019) 012015 doi:10.1088/1757-899X/676/1/012015

cloud image features and building cloud image classification models. There are 4 types of clouds in
the area of Sultan Hasanuddin Airport which are the basis of this research, i.e. Altocumulus, Cirrus,
Cumulus and Cumulonimbus. The extraction process of cloud image features uses the GLCM method
and the cloud classification process uses the SVM method.

2. Materials and Method
2.1. Materials
This research uses primary image data taken using a Canon EOS 750D DSLR camera with 24 MP
sharpness and Canon Power Shoot SX600 HS with 16 MP sharpness and a resolution of 6000 x 4000
pixels. In this research only took four types of cloud images found around the area of Sultan
Hasanuddin Airport in Makassar. The types of cloud are Altocumulus, Cirrus, Cumulonimbus and
Cumulus. Each type of cloud has 20 images, consisting of 15 training images and 5 test images. The
total data is 80 cloud images. We used Matlab as software for processing the data.

2.2. Method
In this research, the steps of the identification method of the cloud images are as follows:
1. Preprocessing: Preprocessing stages are data preparation before entering the feature extraction
    process. At this stage the original cloud image is 6000 x 4000 pixels (Figure 1) has gone through
    the process of setting parameters so that the original size changes to 200 x 200 pixels (Figure 2).
    Furthermore, the cloud image is changed to grayscale (Figure 3).

     Figure 1. Real 6000 x 4000      Figure 2. Cloud image 200 x        Figure 3. Grayscale cloud
         pixel cloud image                     200 pixel                          image

2. Feature Extraction: this step is to find a feature set of cloud images using GLCM and that can
   accurately to be identified.
3. Classification: this section discusses about training and testing data using the SVM method for
   cloud images identification.
4. Validation: using cross validation method to look for accuracy values.

2.3. Gray level co-occurrence matrix (GLCM)
The feature extraction based on gray level co-occurrence matrix (GLCM) is the second order statistics
that can be used to analyze images as a texture [4]. In addition to the horizontal direction (0º), GLCM
can also be formed for the direction of 45º, 90º and 135º as shown in Figure 4 below.

                                                    2
The 2nd EPI International Conference on Science and Engineering IOP Publishing
IOP Conf. Series: Materials Science and Engineering 676 (2019) 012015 doi:10.1088/1757-899X/676/1/012015
Figure 4: Direction of GLCM generation. From the
center ( ) to the pixel 1 representing direction = 0°
with distance d =1, to the pixel 2 direction = 45° with
distance d = 1, to the pixel 3 direction = 90° with
distance d = 1, and to the pixel 4 direction = 135° with
distance d = 1.
Haralick and his colleagues [5] extracted 14 features from the co-occurrence matrix, but in this
research we used only 4 features, i.e. contrast, correlation, energy, and homogeneity with 4 direction
and distanced d =1. The following below is the equation of the GLCM feature used in this research.
N −1
( i − j ) p ( i, j )
2
Contrast = (1)
i , j =0
This statistic measures the spatial frequency of an image and is difference moment of GLCM. It is
the difference between the highest and the lowest values of a contiguous set of pixels. It measures the
number of local variations present in the image. A low contrast image presents GLCM concentration
term around the principal diagonal and features low spatial frequencies [6].
N −1 ( i − i ) ( j − j ) p ( i , j )
Correlation =
i, j =0 i j
(2)
The correlation feature is a measure of gray tone linear dependencies in the image [6].
N −1
p ( i, j )
2
Energy = (3)
i , j =0
It measures the textural uniformity that is pixel pair repetitions. It detects disorders in textures.
Energy reaches a maximum value equal to one. High energy values occur when the gray level
distribution has a constant or periodic form [6].
N −1 p ( i, j )
Homogeneity = 1+ (4)
(i − j )
2
i, j =0
This statistic is also called as Inverse Difference Moment. It measures image homogeneity as it
assumes larger values for smaller gray tone differences in pair elements. It is more sensitive to the
presence of near diagonal elements in the GLCM. It has maximum value when all elements in the
image are same [6].
2.4. Support Vector Machine (SVM)
Support vector machine, is a supervised learning technique that seeks an optimal hyperplane to
separate two classes of samples. Kernel functions are used to map the input data into a higher
dimensional space where the data are supposed to have a better distribution, and then an optimal
separating hyperplane in the high-dimensional feature space is chosen. The idea behind SVMs is to
map the original data points from the input space to a high dimensional, or even infinite-dimensional,
feature space such that the classification problem becomes simpler in the feature space. The mapping
is done by a suitable choice of a kernel function (Figure 5).
3The 2nd EPI International Conference on Science and Engineering IOP Publishing
IOP Conf. Series: Materials Science and Engineering 676 (2019) 012015 doi:10.1088/1757-899X/676/1/012015
Figure 5. SVMs allow mapping of the
data from the input space to a high-
dimensional feature space where a
linear separation is obtained [7]
Clouds data that have trained and achieved the desired results need to be tested to determine the
ability when studying the training data given. Testing is conducted to observe the performance of the
system that has been created by looking at the value of the minimum error. Training and testing results
can be analyzed by observing the accuracy of output target. The training and testing process of clouds
classification is shown in Figure 6.
Figure 6. Flowchart training and
testing process in clouds
classification
2.5. Cross validation
In this research, process validation using cross validation method with three stages of validation.
Clouds data used consist of 60 training data and 20 testing data for four types of clouds. Cross
validation method for each cloud is shown in Table 1.
Table1. Cross validation method
Clouds First Second Third
Data Validation Validation Validation
1
2
Training Data
3 Training Data
4
5
6
Training Data Test Data
7
8 Test Data
9
10
Training Data
11
Training Data
12
4The 2nd EPI International Conference on Science and Engineering IOP Publishing
IOP Conf. Series: Materials Science and Engineering 676 (2019) 012015 doi:10.1088/1757-899X/676/1/012015
Clouds First Second Third
Data Validation Validation Validation
13
14
Test Data
15
16
17
18 Test Data Test Data
Training Data
19
20
3. Result and Discussion
All the experiments were conducted in Matlab version 9.0 running on a PC Intel-Pentium Core i5 with
4 GB of RAM. A total of 80 clouds data measuring 200x200 pixel are processed using the GLCM-
SVM method. Table 2 below shows the results of GLCM feature extraction on all four types of clouds.
Table 2. The result of GLCM feature extraction
Real Clouds
No Grayscale GLCM Output
Data
0 45 90 135 average
Contrast 0.16515 0.23645 0.22256 0.27025 0.2236
1 Correlation 0.90333 0.86126 0.86945 0.84138 0.86885
Energy 0.22221 0.19656 0.20051 0.18533 0.20115
Homogeneity 0.91814 0.88601 0.89205 0.87116 0.89184
0 45 90 135 average
Contrast 0.077206 0.15437 0.11991 0.10855 0.11501
2 Correlation 0.9657 0.93143 0.94674 0.95177 0.94891
Energy 0.24072 0.21487 0.22582 0.22768 0.22727
Homogeneity 0.96143 0.92444 0.9405 0.94581 0.94305
0 45 90 135 average
Contrast 0.041867 0.064118 0.048455 0.0634 0.05446
3 Correlation 0.97381 0.95989 0.96969 0.96029 0.96592
Energy 0.2787 0.26797 0.27494 0.26801 0.27241
Homogeneity 0.97928 0.96881 0.97604 0.96885 0.97325
0 45 90 135 average
Contrast 0.04995 0.10361 0.09495 0.10431 0.088205
4 Correlation 0.9785 0.95548 0.95918 0.95519 0.96209
Energy 0.26658 0.25118 0.25297 0.25074 0.25537
Homogeneity 0.97572 0.95371 0.95695 0.95336 0.95993
The output extraction feature in this GLCM method is a matrix. This matrix is the characteristic of
each cloud image. Table 2 showed that no specific value about the four types of clouds. That's why
SVM as classification method was chosen to classify the type of clouds. To choose the best training
data for high accuracy, we used cross validation method with three stages of validation. The results of
validation shown in Figure 7.
5The 2nd EPI International Conference on Science and Engineering IOP Publishing
IOP Conf. Series: Materials Science and Engineering 676 (2019) 012015 doi:10.1088/1757-899X/676/1/012015
120
100
100 100
Success Rate (%)
80
80 80 80 80 80 80 80
60
60 60 60
40
20
0
Altocumulus Cirrus Cumulonimbus Cumulus
First Validation Second Validation Third Validation
Figure 7. The graphic result of cloud classification
Based on the graph in Figure 7, it could be seen that the validation of stage three Altocumulus
cloud types reached 100% success rate. Cirrus, cumulonimbus, and cumulus cloud types reached 80%
success rate. Likewise with the Cirrus cloud type on second stage of validation the success rate
reached 100%, but altocumulus and cumulonimbus cloud types just reached 60% success rate. At the
first stage, there is 60% success rate for cirrus cloud type. In Cumulonimbus clouds the success rate of
testing reached 80% in the first and third stages of validations. While in Cumulus's cloud the test
success rate reached 80% in all validations. Thus the third stage of validation was chosen, because in
the four types of clouds, the lowest success rate reached 80% while in the first and second stage of
validations, there was still a success rate of 60%. From the average of three stage validation, the third
stage also occupied the highest value, which is 85% success rate. The results of the average value of
three stages validation shown in Figure 8.
90
80 85
70 75
Success Rate (%)
60 65
50
40
30
20
10
0
First Validation Second Validation Third Validation
Figure 8. The average values for three stages of validation
Now we can see in Figure 8, in the first stage of validation had accuracy level of 75%, while in the
second stage of validation had accuracy level of 65%, then in the third stage of validation had
accuracy level of 85%.
6The 2nd EPI International Conference on Science and Engineering IOP Publishing
IOP Conf. Series: Materials Science and Engineering 676 (2019) 012015 doi:10.1088/1757-899X/676/1/012015
4. Conclusion
Based on experimental results, it concludes that Gray Level Co-occurrence Matrix (GLCM) with
Support Vector Machine (SVM) method, can be used for cloud identification. Clouds data used consist
of 60 training data and 20 testing data for four types of clouds. Process validation using cross
validation method with three stages of validation the highest accuracy value in this research achieved
in third stages of validation and reach 85% accuracy.
References
[1] Anonymous, Meteorological, Climatological, and Geophysical Agency: Comulonimbus cloud
alert until January 2017 : Okezone News,” https://news.okezone.com/. [Online].
Available: https://news.okezone.com/read/2016/12/05/340/1559035/ [Accessed: 03-Sep-
2018].
[2] Z. Zhen et al. 2015 SVM Based Cloud Classification Model Using Total Sky Images for PV
Power Forecasting in IEEE Power & Energy Society Innovative Smart Grid Technologies
Conf. (ISGT), Washington, DC, USA, pp. 1–5.
[3] M. Ramadhani and D. Suprayogi 2018 Acne Classification Based on Texture Using GLCM
Method in e-Proc. of Engineering : vol 5 No. 1 pp. 870-876.
[4] I. Nurtanio et al 2013 Classifying Cyst and Tumor Lesion Using Support Vector Machine
Based on Dental Panoramic Images Texture Features in IAENG Int. Journal of Computer
Science vol 40 (1) pp 29-37
[5] R. M. Haralick et al 1973 Textural Features for Image Classification in IEEE Transactions on
Systems, Man, and Cybernetics vol SMC-3 no 6 pp. 610–621.
[6] D. Gadkari 2000 Image Quality Analysis Using GLCM thesis in University of Pune, Florida.
[7] J. Luts et al 2010 A tutorial on support vector machine-based methods for classification
problems in chemometrics in Analytica Chimica Acta vol 665 no 2 pp. 129–145.
7You can also read