Numerical Model of Current Speed in Bojong Salawe Beach, Pangandaran West Java Province
←
→
Page content transcription
If your browser does not render page correctly, please read the page content below
Available online at http://www.iorajournal.org/index.php/ijgor/index

                                                                                                                              e-ISSN: 2722-1016
                                    International Journal of Global Operations                                                p-ISSN: 2723-1747
                                                     Research
                                                         Vol. 2, No. 1, pp. 17-23, 2021

 Numerical Model of Current Speed in Bojong Salawe Beach, Pangandaran
                          West Java Province
              Subiyanto1,*, Nira Nirwana1, Yudi Nurul Ihsan1, Yuniarti1 and Eddy Afrianto2
                 1
                     Department of Marine Science, Faculty of Fishery and Marine Science, Padjadjaran University, Jatinangor, Indonesia
                       2
                         Department of Fishery, Faculty of Fishery and Marine Science, Padjadjaran University, Jatinangor, Indonesia

                                              *Corresponding author e-mail address: subiyanto@unpad.ac.id

Abstract

The purpose of this study was to determine the hydrodynamic conditions at Bojong Salawe beach. The method used in this research
is a quantitative method, where numerical data is collected to support the formation of numerical models such as wind, bathymetry,
and tide data. The hydrodynamic model will be made using Mike 21 with the Flow Model FM module to determine the current
movement pattern based on the data used. In the west monsoon with a maximum instantaneous speed of 0.04 - 0.08 m/s, while in
the east monsoon it moves with a maximum instantaneous speed of 0,4 – 0,44 m/s. The dominant direction of current movement
tends to the northeast. The results indicate the current speed during the east monsoon is higher than the west monsoon. The
difference in the current speed is also influenced by the tide conditions; higher during high tide and lower during low tide. Monsoons
also have a role in the current movements, though the effect is not very significant.

Keywords: Bojong Salawe. MIKE 21, Modelling, Sediment Transport

1. Introduction

   Bojong Salawe Beach has a more complex oceanographic condition which is located along the South Coast of Java.
This is because Bojong Salawe Beach is directly adjacent to the Indian Ocean so that the currents and waves are very
large (Minarrohman & Pratomo, 2017). This is in line with the opinion of Bird & Ongkosongo (1980) which argues
that steep and steep beaches with sand beaches are the dominant component on the South Coast of Java. Because the
location of the South Coast of Java is directly adjacent to the high seas, namely the Indian Ocean, this boundary forms
the oceanographic parameters of the South Coast of Java. On the South Coast of Java Island, the combination of tides,
waves and strong local winds, especially during the West monsoon will cause big waves. Three factors trigger waves,
namely tidal currents, coastal winds, and shifting (fluctuating) rock masses on the ocean floor (Minarrohman &
Pratomo, 2017).
   The wind is one of the climate elements that have an important role in the interaction between the sea and the
atmosphere. For the dynamics of marine waters, especially on the surface, the wind is the main source of energy as the
driving force for seawater itself. This transfer of energy from the wind to the sea surface will cause waves and ocean
surface currents. The currents generated by the wind have different speeds based on depth. The current speed generated
by the wind has a small change with increasing depth so that it does not affect at all.
   In Indonesia, the wind pattern that plays a big role is the monsoon (monsoon) including the South Coast of Java
which is still affected by the monsoon winds (Fadika, Rifai, & Rochaddi, 2014). The period of this monsoon is divided
into four, namely the transitional monsoon I, the east monsoons, the second monsoons and the west monsoons. The
transitional season I occur from March-May, in this period in April and May there will be a natural phenomenon, namely
Kelvin waves propagating at the equator due to the transitional phase of winds at the equator from east to west which
causes wind anomalies (Minarrohman & Pratomo, 2017). The month of June - August is called the eastern season where
Indonesia experiences the dry season due to the wind that blows with a little water mass. The third period, namely
transitional season II which occurs from September - November, is the same as transition one where there is a wind
deflection, only in the opposite direction to the first shift, the turning occurs from west to east. And the last period
occurs from December to February because the west monsoon winds blow where the wind carries a lot of water mass,
causing Indonesia to experience the rainy season (Yananto & Sibarani, 2016).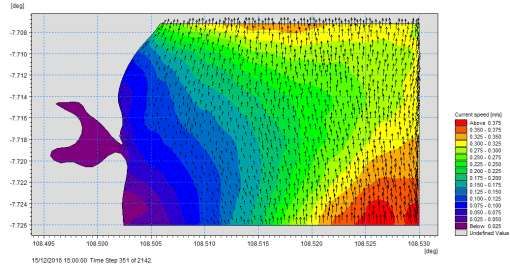
Subiyanto et al. / International Journal of Global Operations Research, Vol. 2, No. 1, pp. 17-23, 2021 18
Ocean tides are a phenomenon of periodic rising and falling sea levels that occur throughout the hemisphere due to
generating forces. The main tidal forces come from the sun and the moon (Douglas in (Ismail & Taofiqurohman, 2012).
The dominance of tidal currents is seen in the process of ocean air circulation, especially in coastal waters. When tides
occur, tidal currents will transport sea air towards it. Vice versa, when the tide occurs, the tidal currents will transport
sea air from coastal waters to the sea (Ismail & Taofiqurohman, 2012). This paper aims to analyze the movement of
currents speed in the Bojong Salawe Beach, Pangandaran in two different seasons.
2. Methodology
2.1. Methods
The method used in this research is a quantitative method, where numerical data is collected as a support in the
formation of numerical models and validated by statistical calculations (Supian et al., 2020). The method used in this
research is observation and simulation; an examination of natural conditions by describing a parameter simply and
systematically using hydrodynamic and sediment transport modeling in MIKE 21 (Lumborg & Pejrup, 2005).
The model is run by the Hydrodynamic Module (HD) and simulate an examination of natural conditions by
describing a parameter simply and systematically using hydrodynamic modeling in MIKE 21 (Lumborg & Pejrup,
2005). This simulation uses a two-dimensional numerical method by inputting hydrodynamics (wind, bathymetry, tides)
validated with field data (DHI, 2012). The results of the two-dimensional model of the movement of currents speed in
the Bojong Salawe Beach, Pangandaran in two different seasons. Hydrodynamic is simulated for three months during
the West Monsoon (December, January, February) and the East Monsoon (June, July, and August) in 2017, 2018, and
2019 to determine the sediment transport patterns in the estuary and Bojong Salawe Beach by comparing it during high
tide and low tide conditions (Husrin et al., 2014).
2.2. Data
The data used in this research is secondary data taken from the following sites.
Table 1: Data required in the study
No. Data Source Resolution Note
1 Bathymetry GEBCO 30 Arc-
The General Bathymetric Chart of the Oceans
Second
2 Tides IOC-UNESCO Every 1 Intergovernmental Oceanographic Commission of UNESCO
hour
3. Wind ECMWF Every 1 Europe Centre for Medium-Range Weather Forecasts
hour
2.3. Research Limits and Scenarios
This research will be carried out in Bojong Salawe Pangandaran Coast by modeling it using MIKE 21. The tools
needed to support this research are Google Earth, Laptop, Ms. Office and MIKE. The materials used in modeling it are
tides, wind and bathymetry. The study boundaries are at the coordinate point 7o41’28.6” S, 108o32’20.6” E to 7o42’55.2”
S, 108o29’55.9” E.
The research was conducted in two different seasons, namely the west season and the east season. This aims to see
the differences in oceanographic conditions in the two seasons. The hydrodynamic model will be created using Mike
21 with the Flow Model FM module to determine the flow movement pattern based on the data used (Supian et al.,
2020). The model equation used in this study is as follows (DHI, 2012).
Continuity Equation:
p q d
+ + = (1)
t x y t
Momentum of mass on the X axis:
p p2
pq gp p + q 1
2 2
+ + + gh + − (h xx ) + (h xy ) −
t x h y h t 2
C .h 2
w x y (2)
h
p − fVVx + ( pa ) = 0
w x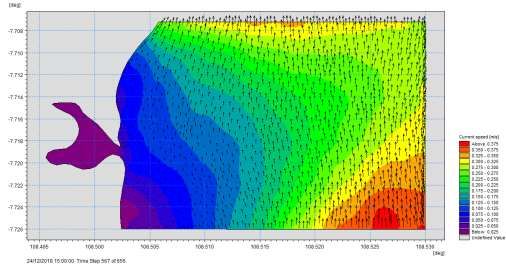
Subiyanto et al. / International Journal of Global Operations Research, Vol. 2, No. 1, pp. 17-23, 2021 19
Momentum of mass on the Y axis:
q q2 pq gq p + q 1
2 2
+ + + gh + − ( h yy ) + ( h xy ) −
t y h x h y 2
C .h 2
w y x (3)
h
p − fVVy + ( pa ) = 0
w y
where:
h ( x, y , t ) : Depth (= − d, m)
d ( x, y , t ) : The variation in depth with time (m)
( x, y , t ) : Water level (m)
p , q ( x, y , t ) : Flux density in the x and y directions (m3s-1m-1)
1
C ( x, y ) : Chezy resistance (m 2 / s)
g : Acceleration due to gravity (m/ s 2 )
f (V ) : Wind friction factor
V , Vx , Vy ( x, y, t ) : Wind speed component in the x and y direction (m/ s)
( x , y ) : Coriolis parameter (s −1 )
pa ( x, y, t ) : Atmospheric pressure (kg/ m/ s2 )
w : Density of water (kg/ m3 )
t : time (s)
xx , xy , yy : Effective shear stress component
3. Results and Discussion
3.1. Wind
Figure 1 is a visualization of wind direction and speed downloaded from the European Center for Medium-Range
Weather Forecasts (ECMWF) in the form of a time series every three hours in 3 months each, namely December,
January and February in 2017 , 2018 and 2019 as a comparison of the west monsoons each year. Taking the coordinates
of wind data in this model is assumed to be the regional winds in the research area.
(a) (b)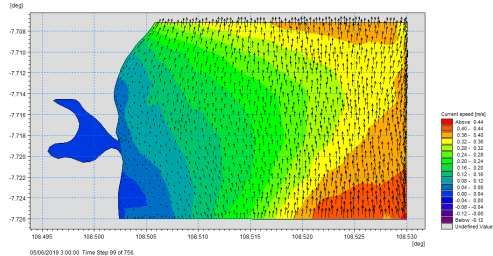
Subiyanto et al. / International Journal of Global Operations Research, Vol. 2, No. 1, pp. 17-23, 2021   20

                                                                  (c)
                      Figure 1: Windrose Chart in West Season (DJF) (a) 2017, (b) 2018, (c) 2019

   Based on Figure 1, it can be seen that the dominant winds moved from the west in 2017, 2018 and 2019. In the
western season of 2017, the wind speed was in the range of 1.8 m / s - 7.2 m / s. The highest speed reaches 7.2 m / s
and the dominant wind speed is at 3.5 m / s - 5.4 m / s. In 2018 wind speeds were in the range of 2.4 m / s - 9.6 m / s.
The highest wind speed reaches 9.6 m / s and the dominant wind speed is in the range of 2.4 m / s - 4.8 m / s. In 2019
the wind speed is in the range of 1.6 m / s - 6.2 m / s. The highest speed reaches 6.2 m / s from the southwest direction
and the dominant wind speed is at 1.6 m / s - 4.8 m / s. Somewhat different from previous years, the direction and speed
of the DJF wind in 2019 experienced a decrease and the direction of the coming of the wind was more varied, with a
dominant direction from the west, the wind also moved from the southwest, south, southeast to a little from the east,
this is because in 2019 and the west season there has been a weak El Nino phenomenon so that the zonal winds from
the west are slightly weakening and the meridional winds from the south are stronger (Athoillah et al, 2017).
   Meanwhile, in June, July and August the conditions are normal and there is no global climate phenomenon so that
the monsoons move accordingly as shown in Figure 2:

                                       (a)                                                   (b)

                                                                  (c)
                      Figure 2: Windrose Chart in East Season (JJA) (a) 2017, (b) 2018, (c) 2019

   For three consecutive years, namely 2017, 2018 and 2019, the dominant wind moved from the southeast. In the
eastern season in 2017, the wind speed was in the range of 2.7 m / s - 6.3 m / s with the dominant speed in the range of
3.9 m / s - 5.1 m / s. In 2018 the wind speed was in the range of 2.3 m / s - 6.2 m / s with the dominant speed in the
range of 3.6 m / s - 4.9 m / s. And in 2019 the wind speed is in the range of 3 m / s - 6 m / s with the dominant speed in
the range of 5 m / s - 6 m / s.
   According to Aldrian (2000), when the west monsoon the zonal wind moves from the west and in the east monsoons,
the wind moves from the east. Meanwhile, the meridional wind will move from the north in the west monsoon and in
the east monsoons from the south. This is what causes the wind movement to come from the southeast, because there
is a meeting of zonal winds from the east and meridional winds from the south. Zonal wind and meridional wind itself
is a division of wind types based on horizontal motion based on latitude and longitude. Zonal winds will move in the
east and west directions while meridional winds will move in the north and south.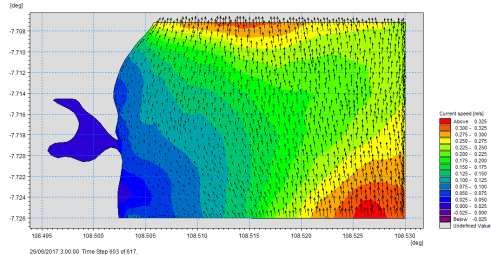
Subiyanto et al. / International Journal of Global Operations Research, Vol. 2, No. 1, pp. 17-23, 2021 21
3.2. Hydrodynamic Simulation
The analysis of the simulation results of this hydrodynamic model is based on the highest and lowest tide conditions
that occurred in both the western and eastern seasons in 2017, 2018 and 2019. The separation of these conditions is
because the currents that occur at that time will have high velocities due to the tidal elevation. also high (Husrin et al,
2014). The following is the visualization of Figures 3 and Figure 4.
N
(a)
N
(b)
N
(c)
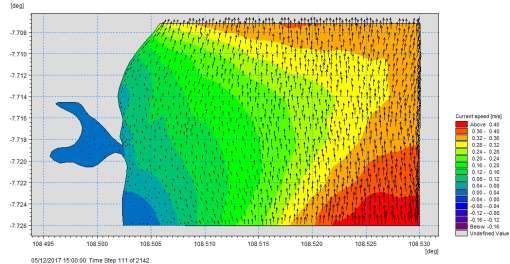
Figure 3. Current Speed in West Monsoon at Highest Tide (a) 2017 (b) 2018 (c) 2019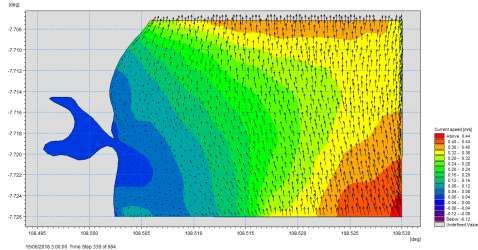
Subiyanto et al. / International Journal of Global Operations Research, Vol. 2, No. 1, pp. 17-23, 2021         22

   Based on Figure 3, the highest tide that occurs in the western season in 2017 is the 351/2142 time step on 15
December at 15.00 WIB having current conditions with a maximum current speed of more than 0.375 m / s and a
minimum current speed of less than 0.025 m / s. In 2018 the highest tide occurred at the 111/2142 time step on December
5 at 15.00 WIB having current conditions with a maximum current speed of more than 0.4 m / s and a minimum current
speed in the range of 0.04 - 0.08 m / s. And in 2019 the highest tide occurred at time step 567/2142 on December 24 at
15.00 WIB, the maximum current speed was more than 0.375 m / s and the minimum current speed was less than 0.025
m / s. The following explanation is presented in Table 2:

                  Table 2: Current Conditions during High Tide West Season (DJF) (2017-2019)
                                                                          current speed (m/s)
               No           Period              Time       Time step
                                                                          Max           Min
               1           DJF 2017             15.00      351/2142      >0,375        0,4       0,04 – 0,08
               3           DJF 2019             15.00      567/2142      >0,375
Subiyanto et al. / International Journal of Global Operations Research, Vol. 2, No. 1, pp. 17-23, 2021 23
N
(c)
Figure 4. Current Speed in East Monsoon at Highest Tide (a) 2017 (b) 2018 (c) 2019
Based on Figure 4, the highest tide that occurs in the eastern season in 2017 is the 603/2190 time step on June 26 at
03.00 WIB having current conditions with a maximum current speed of more than 0.325 m / s and a minimum current
speed of 0 - 0.025 m / s. In 2018 the highest tide occurred at the 339/2190 time step on June 16 at 03.00 WIB having
current conditions with a maximum current speed of more than 0.44 m / s and a minimum current speed ranging from
0 - 0.04 m / s. And in 2019 the highest tide occurred at the 99/2190 time step on June 5 at 03.00 WIB, the maximum
current speed was in the range of 0.4 - 0.44 m / s and the minimum current speed was in the range of 0 - 0.04 m / s. The
following explanation is presented in Table 3:
Table 3: Current Conditions during High Tide East Season (JJA) (2017-2019)
current speed (m/s)
No Period Time Time step
Max Min
1 JJA 2017 03.00 351/2142 >0,375 0,4 0,04 – 0,08
3 JJA 2019 03.00 567/2142 >0,375Subiyanto et al. / International Journal of Global Operations Research, Vol. 2, No. 1, pp. 17-23, 2021 24
Husrin, S., Prihantono, J., & Softyan, H. (2014). Impacts of Marine Sand Mining Activities To the Community of Lontar Village,
Serang - Banten. Bulletin of the Marine Geology, 29(2), 81–90. https://doi.org/10.32693/bomg.29.2.2014.68
Ismail, M. F. A., & Taofiqurohman, A. (2012). Simulasi Numeris Arus Pasang Surut di Perairan Cirebon. Jurnal Akuatika, III(1),
1–10.
Lumborg, U., & Pejrup, M. (2005). Modelling of cohesive sediment transport in a tidal lagoon - An annual budget. Marine Geology,
218(1–4), 1–16. https://doi.org/10.1016/j.margeo.2005.03.015
Minarrohman, M. G., & Pratomo, D. G. (2017). Simulasi Arus dan Distribusi Sedimen secara 3 Dimensi di Pantai Selatan Jawa.
Jurnal Teknik ITS, Vol. 6: 174-178. https://doi.org/10.12962/j23373539.v6i2.24607
Supian, S., Hiwari, H., Ibrahim, T. M., & Subiyanto. (2020). Hydrodynamic model simulation of cikidang river estuary,
pangandaran based on two season in Indonesia. International Journal of Advanced Science and Technology, 29(5), 220–229.
Yananto, A., & Sibarani, R. M. (2016). Analisis Kejadian El Nino Dan Pengaruhnya Terhadap Intensitas Curah Hujan Di Wilayah
Jabodetabek (Studi Kasus : Periode Puncak Musim Hujan Tahun 2015/2016). Jurnal Sains & Teknologi Modifikasi Cuaca,
17(2), 65. https://doi.org/10.29122/jstmc.v17i2.541You can also read