Melbourne Institute Nowcast of Australian GDP & Dating the Business Cycle - March 2021
←
→
Page content transcription
If your browser does not render page correctly, please read the page content below
MELBOURNE INSTITUTE
Applied Economic & Social Research

Melbourne Institute Nowcast of
Australian GDP & Dating the
Business Cycle

March 2021
Melbourne Institute Nowcast of Australian GDP
& Dating the Business Cycle                                                 Released March 25, 2021

GDP grew by 3.1 per cent in the December quarter of 2020
On March 3, the ABS reported that GDP grew by 3.1 per cent in the December quarter of 2020, giving
an annual growth rate of –1.1 per cent and showing signs of recovery. According to the ABS,
household consumption rebounded further in the fourth quarter as restrictions continued to be eased,
contributing 2.3 percentage points to GDP. Public expenditure contributed marginally to growth, while
net exports subtracted 0.1 percentage points from GDP. The next release of the National Accounts,
covering the March quarter of 2021, will be on June 2.
 Figure 1: GDP Growth (chain volume, per cent)      Figure 2: Contributions to GDP Growth (ppt)

 Source: ABS, up to Dec quarter 2020.               Source: ABS, up to Dec quarter 2020.

First nowcast for March Quarter GDP (released in March 2021)
GDP growth is projected to be 1 per cent in the March quarter 2021, giving a year-ended growth rate
of positive 0.1 per cent. The nowcast for Q1-2021 reflects the further easing of restrictions on
households and business activities, although we note the on-going uncertainty of COVID-19 on
economic activity. In April 2021, the second nowcast for Q1 will be released.
Strong housing market conditions continue to be the primary positive contributor to the first GDP
growth nowcast for Q1 in 2021. We note, however, that extremely weak business credit conditions
and uncertainty about both the domestic labour market (including the removal of JobKeeper) and
international economic conditions pose risks for growth during 2021.
Solid growth estimated to have occurred in February and March
The Monthly Activity Index suggests that, following the strong growth in the December quarter,
activity in January was weak. A possible contributing factor includes the disruptions associated with
the Northern beaches COVID outbreak in Sydney. Subsequently solid growth is estimated to have
occurred in both February and March. The February labour market data, which is discussed further
below, is one indication of this. Our estimate for March is based on only limited data and is likely to
be revised as further information become available.
Looking further forward, growth in the Westpac-Melbourne Institute Leading Index recently has
softened, but remains well above its trend. This suggests that above-trend growth is likely to occur in
the next 3 to 9 months. As noted above, the impact of the removal of the JobKeeper wage subsidy is
an important source of uncertainty around the growth outlook in the immediate future.
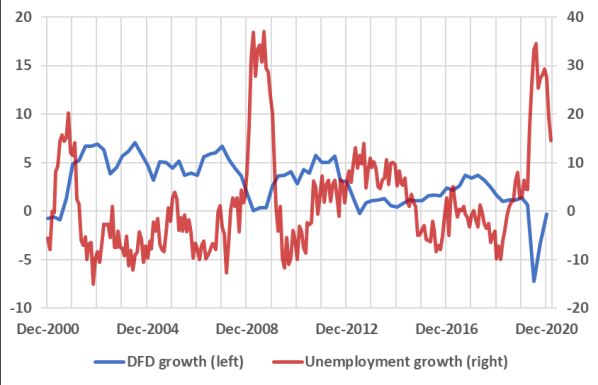
The unemployment rate continued to decline, and hours worked bounced back1
The number of unemployed grew by 15 per cent over the year to February, 5 percentage points lower
than the value observed last month. The unemployment rate slid further from 6.4 per cent in January
to 5.8 per cent in February. Consistently, the ease in unemployment conditions lifted some of the drag
on the growth of domestic final demand, which fell by a small 0.3 per cent over the year to the
December quarter.
After the fall in January, hours worked bounced back, at least temporarily, in February, with its
monthly growth rate reaching 6.1 per cent. This has closed the gap between its current value and the
value observed in the same month last year. Overall, labour market conditions contributed negatively
to the first Q1 nowcast in 2021, primarily due to the sharp fall in hours worked in January.
Figure 3: Unemployment and DFD Figure 4: Growth of hours worked
(year-ended growth, per cent) (monthly, per cent)
Source: ABS, up to Feb 2021. Source: ABS, up to Feb 2021.
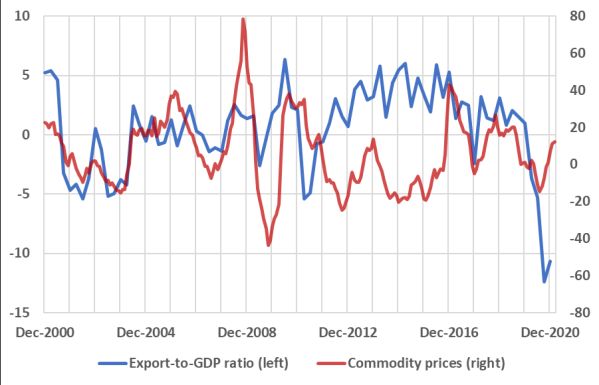
Commodity prices rose further, while imports remained weak
The index of commodity prices grew by 12 per cent over the year to February, due primarily to the
large increase in bulk commodity prices (especially iron ore prices, which peaked again in January after
reaching a nine-year high in December). The exports-to-GDP ratio remained well below its historical
level in the December quarter, although it ticked up slightly compared to Q3, which was partially
consistent with the recent improvement in commodity prices.
Net exports increased in January, due primarily to the large decline in total imports over the year to
January. Overall, the trade sector remains weak and despite improvements in commodity prices,
international conditions contributed negatively to the first nowcast for Q1 in 2021.
Figure 5: Commodity Prices and Exports-to-GDP Figure 6: Trade balance
Ratio (year-ended growth, per cent) ($ billion)
Source: ABS, up to Feb 2021. Source: ABS, up to Jan 2021.
1
Our nowcast model uses monthly information regarding labour market conditions, housing and business
lending, retail sales, housing approvals, consumer expectations, trade conditions and commodity prices to gauge
current economic conditions. We note that the nowcast is currently in the experimental stage.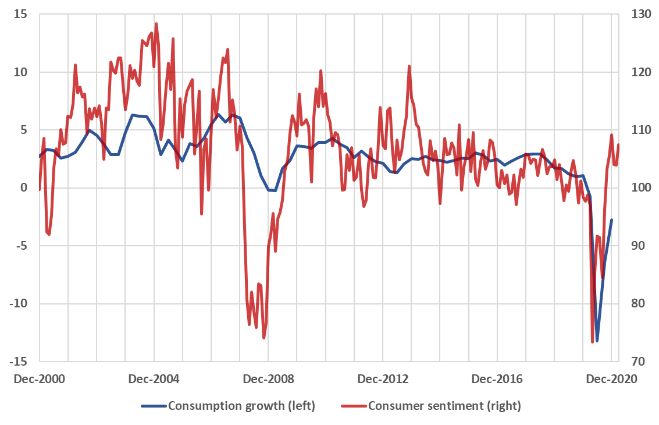
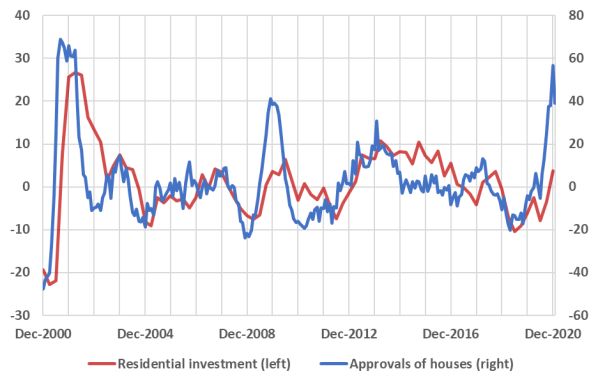
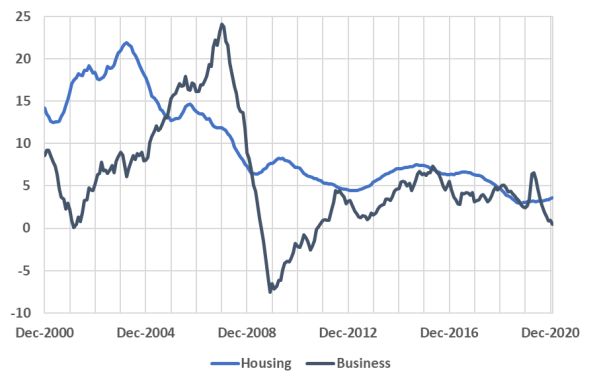
Consumer sentiment improves in March
The seasonally adjusted current conditions component of consumer sentiment clawed back falls in
January and February, rising by 3.5 points in March (after falling by another 0.1 points in February and
by 5.1 points in January). The number of optimists has now exceeded the number of pessimists for
the sixth consecutive month suggesting that consumers believe current conditions have improved
relative to the conditions observed over much of 2020.
Annual growth in non-food retail trade rose to just under 20 per cent in the latest January data,
continuing its run of double-digit annual growth observed since March 2020. Growth in non-food retail
trade contributed positively to this month’s nowcast. Annual growth in food-related retail trade also
rose to 10.9 per cent in January, after a five-month period of consecutive declines in annual growth.
Looking forward, however, annual growth is expected to moderate further from the current rates.
 Figure 7: Consumer Sentiment and Consumption           Figure 8: Retail trade
 (index and year-ended growth, per cent)                (year-ended growth, per cent)

 Source: ABS and Melbourne Institute, up to Mar 2021.   Source: ABS, up to Jan 2021.

Dwellings approval continue to grow strongly, although business lending remains weak
The rate of annual growth in dwelling approvals fell in January, after rising for six consecutive months
from July to December 2020. Nevertheless, annual growth was still at a high 39 per cent. Monthly
building approvals also exceeded 10 thousand for the fifth consecutive in January, with December’s
approval count of nearly 14 thousand being the highest on record. As with last month, housing activity
has been a major positive factor in the nowcast for Q1.
Unsurprisingly, annual growth in housing credit has continued to rise, reaching an annual growth rate
of over 3.6 per cent in January. This is above the annual growth of 3.1 per cent in January 2020,
although well below the annual growth of 4.4 per cent in January 2019. In contrast, annual growth in
business lending was a meagre 0.5 per cent in January, and at its lowest rate since 2011. Growth
prospects for investment in 2021 continue to be weak.
 Figure 9: Dwelling Approvals and Residential            Figure 10: Housing Credit and Business Credit
 Investment                                              (year-ended growth, per cent)
 (year-ended, per cent)

 Source: ABS, up to Jan 2021.                            Source: ABS, up to Jan 2021.
Dating the Australian Business Cycle

The Melbourne Institute uses a Monthly Activity Index, together with the nowcast and a rule to
identify turning points, to date whether the Australian economy may be in a recession.2
The Monthly Activity Index is constructed so that at the quarterly frequency, it coincides with the log
of real quarterly GDP to ensure that both data set exhibits similar turning points. Essentially our
approach interpolates the quarterly values in history, guided by monthly partial indicators of the state
of the economy.3
Table 1 identifies the turning points (as in peaks and troughs) and the periods of contractions and
expansions in business cycle analysis using monthly data. They show that the COVID-19 recession
began in March-2020 and was very short by historical standards – lasting only 2 months. These dates
are essentially unchanged from last month.
The recently released, less timely, quarterly ABS GDP data confirm the COVID-19 recession has ended
(Table 2). The shortness of the recession is less obvious with the quarterly GDP data. Using GDP per
capita, which is a better measure of the living standards of Australians, also shows that an expansion
is now occurring (Table 3).
Despite an expansion being underway, and the surprisingly large fall in the unemployment rate which
occurred in February, it is likely that considerable slack in the Australian economy still exists.
Consequently, further periods of above-trend growth are necessary to reduce this spare capacity. The
Reserve Bank has provided forward guidance that it will maintain its expansionary settings for several
years. Alternatively, for both the State and Federal governments balancing fiscal consolidation and
the need to provide support to economic growth is likely to become a major issue in the near term.

                                    Table 1: Monthly Business Cycle Dates
                                    Contraction             Expansion                           Cycle
       Peak         Trough
                                   peak to trough         trough to peak         peak to peak       trough to trough
                                     (months)                (months)             (months)              (months)
                   Jan-1975
    Sep-1981       Jan-1983               16                     80                                        96
    Mar-1990       Jun-1991               15                     86                   102                  101
    Mar-2020      May-2020                 2                    345                   360                  347
                                                             Ongoing
    Averages                               9                    131                   231                  181
    Standard deviations                    7                    147                   182                  143
Note: The average durations are rounded to full months. Includes the ongoing phase. Sample is 1974:09- 2021:03.

2
  The rule is known as Bry-Boschan Quarterly (BBQ). See A. R. Pagan and D. Harding (2002) “Dissecting the cycle:
a methodological investigation’, Journal of Monetary Economics, 49(2), p. 365-381. Also see
http://www.ncer.edu.au/data/data.jsp. The commonly quoted “two-quarters of negative growth” rule to define
a recession is an approximate way of identifying turning points in the level of economic activity.
3
  The data used are: the Westpac-Melbourne Institute Consumer Sentiment Index (time to buy a major
household item and family finances versus a year ago); retail trade; the trimmed-mean CPI; the Melbourne
Institute Inflation Gauge; monthly imports; the real and nominal trade-weighted exchange rate and aggregate
hours worked. We construct the Monthly Activity Index from 1974:09 onwards due to availability of the monthly
data. The MI Monthly Activity Index is currently still in development (particularly its open economy aspects).
Table 2: Real GDP Business Cycle Dates
Contraction Expansion Cycle
Peak Trough
Peak to Trough to Peak to Trough to
trough peak peak trough
(quarters) (quarters) (quarters) (quarters)
Mar-1961 Sep-1961 2
Jun-1965 Mar-1966 3 15 17 18
Sep-1971 Mar-1972 2 22 25 24
Jun-1975 Dec-1975 2 13 15 15
Jun-1977 Dec-1977 2 6 8 8
Sep-1981 Jun-1983 7 15 17 22
Jun-1990 Jun-1991 4 28 35 32
Dec-2019 Jun-2020 2 114 118 116
ongoing
Average durations 3 25 30 34
Standard deviations 2 34 37 37
Note: The average durations and standard deviations are rounded to full quarter. Includes the ongoing phase. Sample is
1959:Q3 – 2020:Q4.
Table 3: Cycles in Real GDP per Capita
Contraction Expansion Cycle
Peak Trough
Peak to Trough to Peak to Trough to
trough peak peak trough
(quarters) (quarters) (quarters) (quarters)
Jun-1974
Jun-1975 Dec-1975 2 4 6
Jun-1977 Dec-1977 2 6 8 8
Sep-1981 Jun-1983 7 15 17 22
Sep-1985 Sep-1986 4 9 16 13
Dec-1987 Jun-1988 2 5 9 7
Sep-1989 Dec-1991 9 5 7 14
Jun-2000 Dec-2000 2 34 43 36
Dec-2005 Jun-2006 2 20 22 22
Mar-2008 Dec-2008 3 7 9 10
Jun-2018 Dec-2018 2 38 41 40
ongoing
Average durations 3 13 17 16
Standard deviations 2 12 14 12
Note: The average durations and standard deviations are rounded to full quarter. Includes the ongoing phase. Sample is
1973:Q3 – 2020:Q4.Melbourne Institute Nowcast of Australian GDP & Dating the Business Cycle
The Melbourne Institute Nowcast of Australian GDP and the Monthly Index used to date the business
cycle use monthly information regarding labour market conditions, housing and business lending,
retail sales, housing approvals, consumer expectations, trade conditions and commodity prices in
order to gauge current economic conditions.
We note that the nowcast and the dating methodology are currently in the experimental stage.
Disclaimer: The University of Melbourne and the Melbourne Institute give no representation, make
no warranty, nor take any responsibility as to the accuracy or completeness of any information
contained herein and will not be liable in contract tort, for negligence or for any loss or damage
arising from reliance on any such information. The Melbourne Institute Nowcast of Australian GDP
presents the professional analysis and views of the Melbourne Institute.
For information on the data contained in the report contact the Melbourne Institute, The University
of Melbourne, on (03) 8344 2196.
© The University of Melbourne, Melbourne Institute: Applied Economic and Social Research.
This report is copyright. Apart from any fair dealing for the purposes of study, research, criticism or
review, as permitted under the Copyright Act, no part may be reproduced without written
permission.
For more information about the Melbourne Institute, see:
http://melbourneinstitute.unimelb.edu.au/
For more information about Macro@MI and other reports see:
http://melbourneinstitute.unimelb.edu.au/research-programs/macroeconomicsYou can also read