Short Term Technical Picks - SSL Research Centre 06th August 2021 - SHCIL Services Ltd.
←
→
Page content transcription
If your browser does not render page correctly, please read the page content below
Short Term Technical Picks

  06th August 2021
SSL Research Centre
Short Term Technical Picks
           a). Short Term Technical Picks - A short-term technical bet for Investor-Trader / Trader-Investor

           b). Strategy Objective:

           ➢ Take advantage of the technical selling in the market and identify scrip which are mispriced; capitalise on the
              directional as well as the consolidating market; Capture the sectoral rotation in the market.

           ➢ While selecting the stocks, emphasis is given on fundamentals, and prospective event flow in the market. This is
              supported and endorsed by technical indicators and derivative data.

           ➢ While the stock fundamentals are sound, stop loss is recommended for the leveraged traders based on the
              individual's risk appetite at the support level indicated in the technical view.

           ➢ The product carries four-to-five trading/investment ideas with a time horizon ranging from three to four months
              targeting a potential return of 10%-15% for the large caps and 15-20% for the mid-cap/small-cap during the given
              timeframe.

           c). Frequency & Time Frame: Quarterly basis & 3-4 Months

https://www.shcilservices.com/ssl-research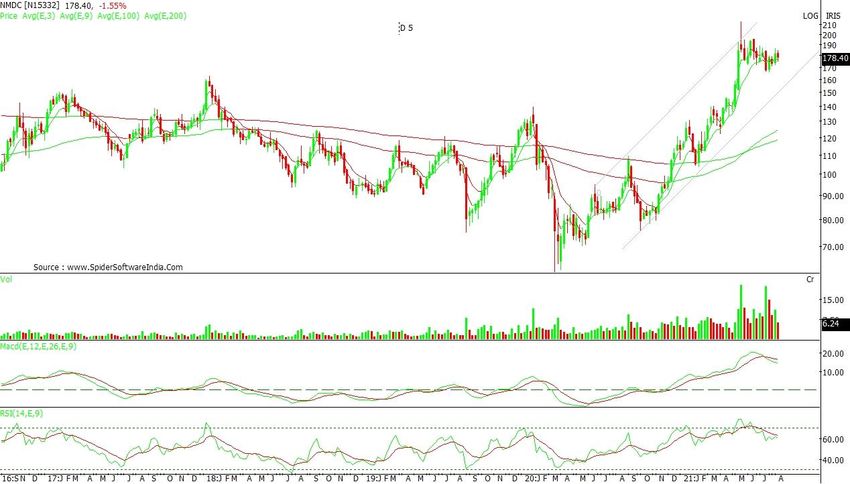
1. Tata Consultancy Services Limited – Buy (Large Cap)
 CMP : 3311           Target : 3680    SL: 3130        Upside Potential : 11.14%
                                                                                                                 Particulars
Weekly Chart
                                                                                                 Symbol                   TCS
                                                                                                 Sector                   COMPUTERS -
                                                                                                                          SOFTWARE
                                                                                                 Face Value (Rs.)         1
                                                                                                 52 Week High/Low         3399.65/2216.45
                                                                                                 Free Float Market
                                                                                                                          3,40,12,999.32
                                                                                                 Cap (Rs Lakhs.)
                                                                                                           Shareholding Pattern

                                                                                                 Promoters                72.19%

                                                                                                 Institutions (FII+DII)   23.44%

Technical Rationale                                                                              Others                   4.38%

The stock has seen a breakout from the key resistance level of 3225 and suggesting uptrend could continue in short term to medium
term scenario. This uptrend could get damaged if the stock closes below 3024 levels on monthly basis. The stock witnessed fresh
buying at lower levels as the stock tested weekly low of 3132 with good volumes and gave an upside breakout level of 3225 on Mondays
(02nd Aug) session with good volumes. Moreover, the daily chart structure is positive as the stock is well placed above its 200 days
exponentially moving averages. The daily RSI is already in strong buy mode. A move past 3399.65 could take the stock towards the
levels of 3500/3550/3680. Keeping in mind the above-mentioned evidences, we recommend traders to buy TCS for medium term gains.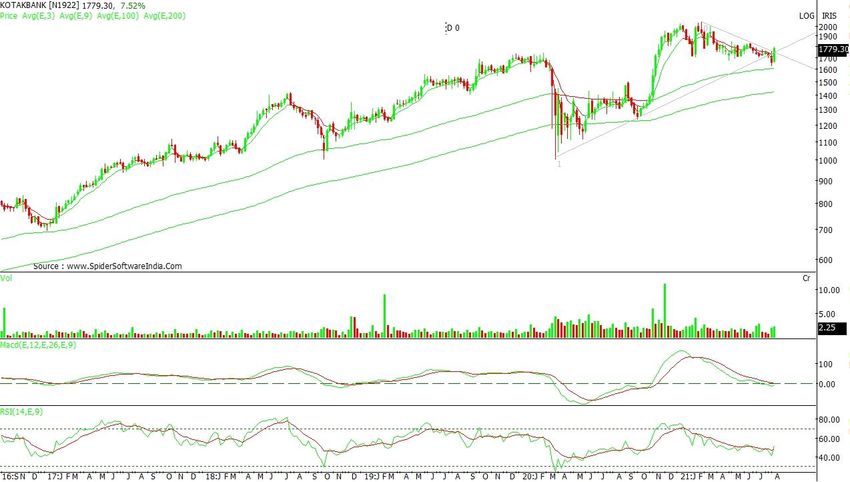
2. Kotak Mahindra Bank Limited – Buy (Large Cap)
 CMP : 1779.10         Target : 2080     SL: 1657        Upside Potential : 16.90%
                                                                                                                  Particulars
  Weekly Chart
                                                                                                Symbol                   KOTAKBANK
                                                                                                Sector                   PRIVATE SECTOR
                                                                                                                         BANK
                                                                                                Face Value (Rs.)         5
                                                                                                52 Week High/Low         2049.00/1230.60
                                                                                                Free Float Market        2,59,90,990.15
                                                                                                Cap (Rs Lakhs.)
                                                                                                            Shareholding Pattern

                                                                                                Promoters                26.00%

                                                                                                Institutions (FII+DII)   57.39%

                                                                                                Others                   16.61%
Technical Rationale
After hitting an all-time high at 2049 on 16th Feb 2021, Kotak Mahindra bank has been trading continuously downward bias and given an
upward breakout recently suggesting the stock prices approach towards its apex and breakout of 2049 would take the stock towards
2080/2120/2180 levels in short to medium term. Daily RSI has also given a breakout from the falling resistance line which substantiates
positive trend in the stock On the downside the support will be at 1665/1626 levels. Hence, we advise you to buy KOTAKBANK @ CMP
with return potential of 16.90%.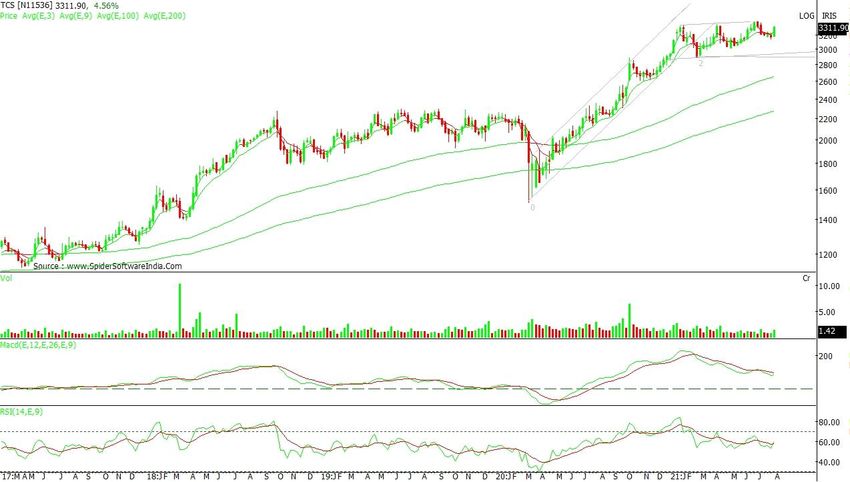
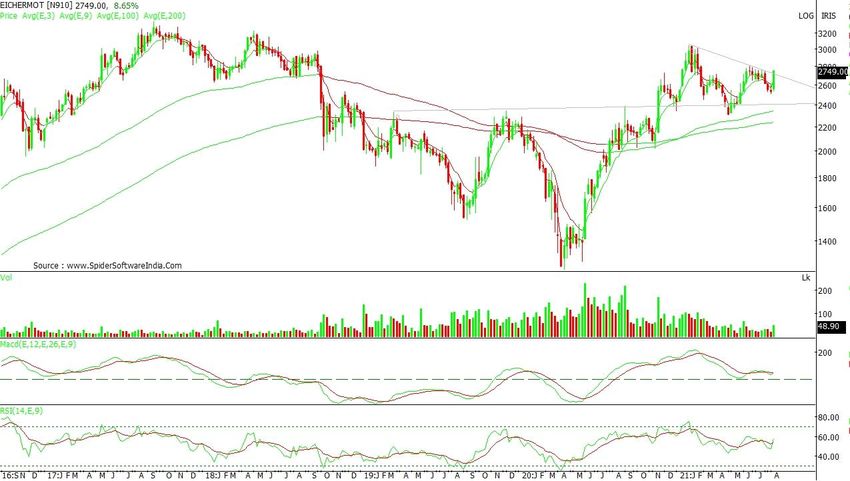
3. Eicher Motors Limited – Buy (Large Cap)                                                                      Particulars
  CMP : 2742           Target : 3149    SL: 2558       Upside Potential : 14.84%                  Symbol                   EICHERMOT
 Weekly Chart                                                                                     Sector                   MOTOR
                                                                                                                           CYCLES/SCOOT
                                                                                                                           ERS
                                                                                                  Face Value (Rs.)         1
                                                                                                  52 Week High/Low         3037.00/2006.67
                                                                                                  Free Float Market
                                                                                                                           38,09,384.70
                                                                                                  Cap (In Lakhs)

                                                                                                           Shareholding Pattern

                                                                                                  Promoters                    49.22%

                                                                                                  Institutions (FII+DII)       38.43%

Technical Rationale                                                                               Others                       12.35%

The stock has surged from the April 2020 low of 1245 with good volumes with formation of head and shoulder pattern. The stock has
been forming very good bullish head and shoulder pattern and if Eicher Motor breaks/trades above its key resistance level of 2797 on
weekly closing basis, the stock can move towards 3037/3149 or even 3223 levels in short term to medium term. The daily and weekly
momentum indicators like MACD and RSI are accelerating upside movements. Overall, the monthly chart pattern on Eicher Motor is
likely to remain uptrend in medium to long term. Hence, we recommend EICHERMOTOR for short to medium term target of 3037/3223
levels.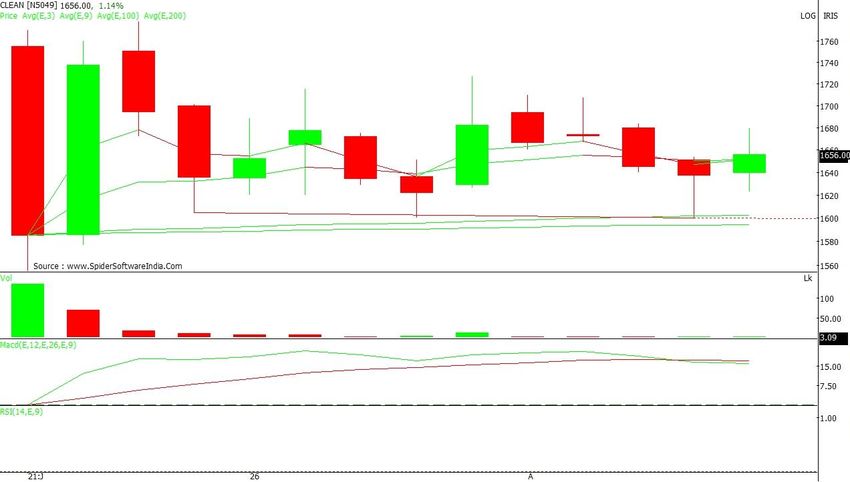
4. NMDC Limited – Buy (Large Cap)
CMP : 178.40 Target : 213 SL: 163 Upside Potential : 19.40%
Weekly Chart Particulars
Symbol NMDC
Sector INDUSTRIAL
MINERALS
Face Value (Rs.) 1
52 Week High/Low 213.20/75.60
Free Float Market 20,57,856.77
Cap (Rs Lakhs.)
Shareholding Pattern
Promoters 68.29%
Institutions (FII+DII) 24.95%
Others 6.77%
Technical Rationale
After touching 52-week high, the NMDC has been trading in a rangebound mode with strong accumulated volumes over the past two
months. On the monthly chart stock has broken downward sloping channel and gave fresh bullish breakout suggesting uptrend can be
expected to continue in short term. On the daily chart RSI is placed above 70 suggesting strong build-up in momentum on the monthly
chart. Technically stock is trading above its short-term as well as medium term exponential moving averages which is positive for the bull
run and breakout of 195 would take the stock at 213 and 251 levels. On the downside the support will be at 165/152 levels. So we
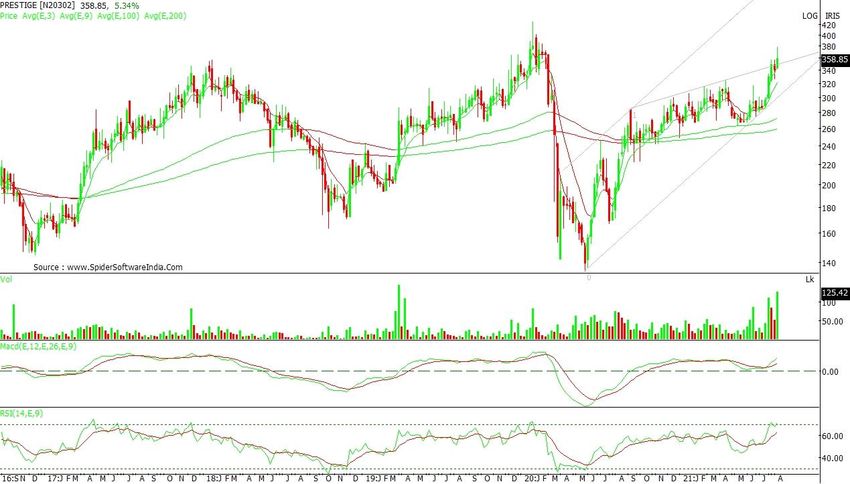
advise you to buy NMDC at current levels for the upside potential of 22.78%.5. Prestige Estates Projects Limited – Buy (Mid Cap)
CMP : 360 Target : 446 SL: 324 Upside Potential : 23.90% Particulars
Symbol PRESTIGE
Weekly Chart
Sector RESIDENTIAL/COM
MERCIAL/SEZ
Project
Face Value (Rs.) 10
52 Week High/Low 377.80/201.20
Free Float Market
5,02,419.95
Cap (In Lakhs)
Shareholding Pattern
Promoters 65.48%
Institutions (FII+DII) 32.07%
Others 2.45%
Technical Rationale
The stock has given a breakout from the ‘rounding bottom’ on weekly chart recently with good accumulated volumes suggesting
uptrend will continuum in short to medium term and it can move towards next technical resistance levels of 401/426. The trend indicator
ADX indicates the current trend is expected to witness further upside in short term. Moreover, the stock has given a close above its
short-term moving averages on both daily as well as weekly chart. The daily RSI is already in strong buy mode. The support level for
the stock can be seen at 325 and 298 levels. We recommend to buy PRESTIGE at CMP for short to medium term gains.6. Clean Science and Technology Limited – Buy (Mid Cap)
CMP : 1656.30 Target : 1950 SL: 1555 Upside Potential : 17.70%
Daily Chart Particulars
Symbol CLEAN
Sector CHEMICALS -
SPECIALITY
Face Value (Rs.) 1
52 Week High/Low 1779.00/1555.05
Free Float Market Cap
1,91,315.22
(In Lakhs)
Shareholding Pattern
Promoters 94.65%
Institutions (FII+DII) 0.77%
Rationale Others 4.58%
The recent listed speciality chemical stock CLEAN are looking positive with considering its strong and longstanding relationships with
multinational customers, quality of products, strong earnings track record with healthy return ratios, greater cost control, process
innovation with consistent focus on R&D, and positive industry outlook. After testing the low of 1555 the stock witnessed good buying
interest among market participants with formation of positive kind of chart pattern suggesting the stock can move towards 1726/1779 in
short term. Breakout of 1770 would invite further buying pressure and then 1850/1940 are possible. The support can be seen at
1600/1577 levels.7. Stove Kraft Limited – Buy (Small Cap)
CMP : 812.75 Target : 980 SL: 743 Upside Potential : 20.60% Particulars
Symbol STOVEKRAFT
Weekly Chart
Sector HOME
APPLIANCES
HOUSEWARES
Face Value (Rs.) 10
52 Week High/Low 850.00/406.10
Free Float Market Cap
94,714.54
(In Lakhs)
Shareholding Pattern
Promoters 54.29%
Institutions (FII+DII) 16.35%
Others 29.37%
Rationale
Stove Kraft is engaged in the manufacture, trade and retail of a wide and diverse suite of kitchen solutions under "Pigeon" and "Gilma"
brands and recently the company reported a good set of Q1 numbers, with e-commerce sales contributing over 30 percent of revenue.
The company plans to launch over 30 Store Keeping Units in the coming quarter with focus on increasing distribution, increasing network
in rural areas and bringing more customers onboard through increasing our number of outlets. The stock has doubled from its issue price
listed in February itself. Technically the stock has been trading in an upward bias since listing date and it has tested all time high of 850.
Considering fundamental and technical parameters we are positive on STOVECRAFT for short to medium term gains.SSL Research Centre
Head – Research
S. Devarajan s.devarajan@shcilservices.com 022-61778621
(Technical & Derivatives)
Gauri Hanmantgad Research Associate gauri.hanmantgad@shcilservices.com 022-61778600
Disclaimer
This is solely for information of clients of SHCIL Services Ltd. and does not construe to be an investment advice. It is also not intended as an offer or solicitation for the purchase and sale of any financial
instruments. Any action taken by you on the basis of the information contained herein is your responsibility alone. SHCIL Services Ltd., its associate companies, and employees will not be liable in any manner
for the consequences of such action taken by you. We have exercised due diligence in checking the correctness and authenticity of the information contained in this recommendation. SHCIL Services Ltd., its
associate companies, and employees shall not be in any way responsible for any loss or damage that may arise to any person from any inadvertent error in the information contained in this recommendation or
any action taken on basis of this information.
Disclosures: SSL is registered as Research Analyst with SEBI bearing registration number INH000001121 as per SEBI (Research Analysts) Regulations, 2014. SSL is primarily engaged in the business of
providing broking services. SHCIL Services Limited is a SEBI registered Stock Broker providing services to institutional and retail clients. SEBI registration no: INZ000199936 Details of associates of SSL are as
under: 1.Stock Holding Corporation of India Limited (SHCIL) : SHCIL is primarily engaged in the business of providing custodial services, post trading services, Sub-broking services in association with SHCIL
Services Limited and depository related services. SHCIL is also registered as Research Analyst with SEBI bearing registration number INH000001303 as per SEBI (Research Analysts) Regulations, 2014.
2.StockHolding Document Management Services Limited: Stockholding DMS Limited is in the business of providing End to End Document Management Solutions and Information Technology Enabled Services.
3.StockHolding Securities IFSC Limited (SSIL): SSIL offers a comprehensive bouquet of service solutions to all eligible investors at IFSC, Gift City, Gandhinagar.
SSL or its Research Analyst or relatives or its associates do not have any financial interest in the company(ies). SSL, the Research Analyst or relatives or its associates collectively do not hold more than 1% of
the securities of the company(ies) referred to in this document as of the end of the month immediately preceding the date of this document. SSL or its Research Analyst or relatives or its associates may from
time to time have positions in, purchase or sell, or be interested in any of the securities mentioned herein. SSL, the Research Analyst or relatives or its associates do not have any other material conflict of
interest in the above company. SSL, the Research Analyst or relatives or its associates have not received compensation or other benefits of any kind from the company(ies) referred to in this document or from
any third party, in the past twelve months. SSL, the Research Analyst or relatives or its associates have not managed or co-managed in the previous twelve months, any offering of securities for the
company(ies) referred to in this document. SSL, the Research Analyst or relatives or its associates have not served as an Officer, Director or employee of the company(ies) referred to in this document. SSL, the
Research Analyst or relatives or its associates have not been engaged in market making activity for the company(ies) referred to in this document.
SHCIL Services Limited
CIN NO: U65990MH1995GOI085602.
Plot No. P-51, T.T.C. Industrial Area, MIDC Mahape, Navi Mumbai – 400 710
Devarajan Digitally signed by
Devarajan Sadasivam
www.shcilservices.com
Sadasivam Date: 2021.08.06 17:55:54
+05'30'You can also read