Record Q2 Result - Profitability Improved Thanks to Fast Response to Exceptional Circumstances and Well-Functioning Strategy - KESKO OYJ
←
→
Page content transcription
If your browser does not render page correctly, please read the page content below
KESKO OYJ

Record Q2 Result – Profitability Improved Thanks to Fast Response
to Exceptional Circumstances and Well-Functioning Strategy
JUKKA ERLUND, CFO
K Group and Kesko Today

         Biggest in Finland,         Profitable growth     43,000 employees,

    #1   #3 in Northern Europe
         with retail sales of over
                                     strategy in 3 core
                                     divisions
                                                           approx. 1,800 stores and
                                                           comprehensive digital
         €13,5bn                                           services in 8 countries

         Strong financial            Market cap approx.    World’s most
         position with good          €7.2bn with over      sustainable grocery
         dividend capacity           50,000 shareholders   trade company

2
Key figures in a nutshell
                                                                                       Comparable
                                       Net Sales
                                                                                      operating profit

                                                                                            Car trade
                                                        Grocery              Speciality
                Speciality  Car trade                                                       €23.9m
                                                        trade                goods trade
                goods trade €866.0m                                                                      Grocery trade
                                                        €5,611.3m             €6.8m
                 €285.0m                                                                                  €335.4m

          Building and                                              Building and
          technical trade                                           technical trade
                                      €10 893,1m                     €168.9m               €502.0m1
          €4,144.1m

    Continuing operations, rolling 12-months, Q2/2020
    1Incl. Common functions and eliminations €-32.9m
3
Growth Strategy
Focus:

         Grocery trade
                                            One unified

         Building and technical trade

         Car trade

4
Core Divisions at a Glance
Grocery Trade                                                 Building and Technical Trade                            Car Trade

•       Net sales approximately €5.6bn                        •   Net sales approximately €4.4bn                       •   Market leader with net sales of €0.9bn
•       Quality leader in the Finnish grocery market: #2 in   •   #1 operator in building and technical trade in       •   Operating the Volkswagen Group’s business in
        grocery retailing, #1 in foodservice B2B                  Northern Europe                                          Finland: Audi, Volkswagen, SEAT, Porsche, Bentley
                                                                                                                           and MAN
•       Rapidly expanding online food store network           •   537 stores in 8 countries
                                                                                                                       •   Value chain includes importing, retailing, leasing
•       Market share at its highest in >15 years, ~37%        •   Comprehensive digital services
                                                                                                                           services and after sales as well as an extensive
•       1.3m customer visits per day                          •   Serves three customer segments –                         dealer and servicing network
                                                                  B2B share approximately 70%
•       1,200+ stores in the retailer business model                                                                   •   Various service concepts and wide electric car
                                                              •   Strong position to fully benefit from the ongoing        charging network
•       One of the most profitable players in Europe
                                                                  consolidation of the market

    5
Kesko’s Financial Targets

                                                              Level
                                                          achieved
    Indicator                           Target level
                                                       in Q2 2020*
                                                                      Main themes and actions to achieve the financial targets

    Comparable operating margin, %          5.0%         4.6%           •       All business division:
                                                                            •      Customer driven organic growth
    Comparable return on capital                                            •      Improved efficiency
    employed, %                             11.0%        10.1%
                                                                        •       Improved cash flow generation
                                                                        •       Focused capital expenditure:
    Interest-bearing net debt/EBITDA,   at maximum
    excluding the impact of IFRS 16         2.5           0.6               •      Selected acquisitions
                                                                            •      Limited store sites expansion needs
                                                                            •      Further development of digitalisation

6   *rolling 12 months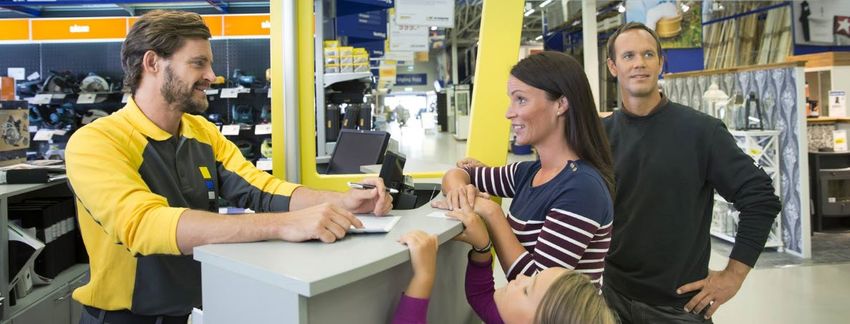
Solid Dividend Track-record
Dividend in two instalments in 2020

Kesko's dividend policy: In the long-term, Kesko aims to distribute a steadily growing dividend of some 60-100% of its
comparable earnings per share, taking into account the company’s financial position and strategy. Kesko has been paying its
dividends in two instalments starting with the dividend paid for the year 2018.
                                                                                                                                                             2.97

                                                                                                        2.50                                   2.47                2.52*
                                                                                                                                 2.29                 2.34
                                                                                                                                        2.20
                                                                                                                     2.01 2.00
                  1.84
                                                          1.68                1.65               1.70
                                      1.47                       1.40                1.50
                        1.20                 1.20
Payout ratio, %
                  65                 82                   83                  91                 147                 100         97            96            85

Effective
dividend yield,   4.6               4.8                   5.2                 5.0                 7.7                 4.2        4.9           5.0           4.0
B share, %

                    2011                  2012             2013                2014                 2015               2016        2017         2018          2019
                         Comparable earnings per share, €                      Dividend, €

7   2011-2016 Comparable earnings per share, Group; 2017-2019 comparable earnings per share, continuing operations
    *Prior to the share split (1:4)
Q2 – Kesko Group
and Divisions
Key Events in Q2
                                                                                                            4-6/2020    4-6/2019
•   Record result and very strong cash flow
                                                                            Net sales, € million              2,814.5    2,781.4
•   Grocery trade sales grew and profitability improved further
                                                                            Net sales growth, %                 1.2        4.1
•   Demand continued strong in building and technical trade

                                                                            Operating profit, € million*      155.2       122.5
•   Good development continued in K-Rauta and Onninen in Finland,
    significant profit improvement in building and home improvement trade   Operating margin*                   5.5        4.4
    in Sweden
                                                                            Profit before tax, € million*      135.2      99.2
•   Acquisition of Carlsen Fritzøe Handel, leading building and home
                                                                            Earnings per share, basic, €*      0.24       0.18
    improvement trade operator in the Oslo region, in July
                                                                            Cash flow from operating
•   Positive result in car trade under difficult circumstances thanks to                                      421.8       271.4
                                                                            activities, € million
    adjustment measures                                                     * Comparable

•   New ambitious climate targets: carbon neutral by 2025, zero emissions

9   by 2030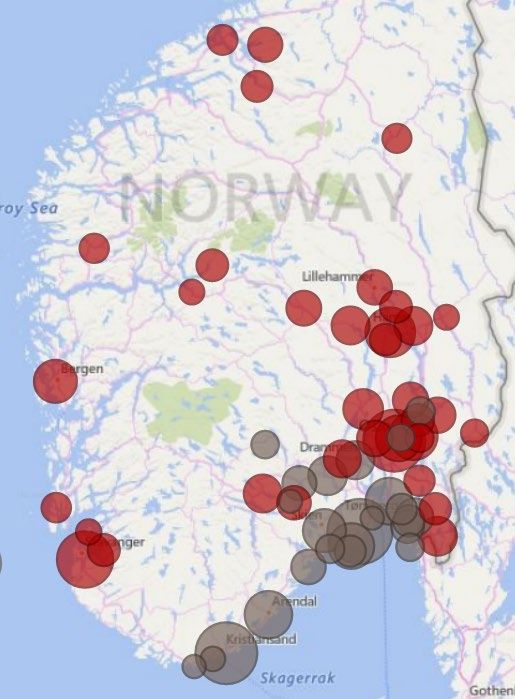
Net Sales
Q2 net sales up by 1.2%, or 2.2% in comparable terms                                      Rolling 12 months

                                                      €33.2 million                                     1.4%                 2.5%
                                                                                             €m
     €m
                                                                                          11,000
                                                                                           11 000
33,500
   500                                                                                                                   10,893.1

33,000
  000                             2,781.4   2,803.9    2,734.2                  2,814.5   10,800
                                                                                           10 800
                                                                      2,540.4                       10,720.3
22,500
   500       2,400.8
                                                                                          10,600
                                                                                           10 600
22,000
  000

1,500
1 500                                                                                     10,400
                                                                                           10 400

11,000
   000
                                                                                          10,200
                                                                                           10 200
     500

      0                                                                                   10,000
                                                                                           10 000
               Q1/19               Q2/19     Q3/19       Q4/19         Q1/20     Q2/20                  2019             Q2/2020

10        Continuing operations                                                                     %    Comparable growth
Net Sales by Division
Comparable growth
M€
1.6%
1 600
8.7%
1 400
1,408.6 1,431.1
1 200
1,158.7
1 000 1,066.4
800
600
-21.5 %
400
200
211.9 192.0
0
Grocery Trade Building and technical Trade excl. speciality goods Car Trade
trade
Q2/2019 Q2/2020
11Operating Profit
Operating profit grew by €32.8 million
Rolling 12 months
+ €32.8 million €m
€m 502.0
500
180
152.0 155.2
160 480
140 122.5 129.7
461.6
120 460
100
80 65.1 440
57.5
60
40 420
20
0 400
Q1/19 Q2/19 Q3/19 Q4/19 Q1/20 Q2/20 2019 Q2/2020
Operating
2.4% 4.4% 5.4% 4.7% 2.6% 5.5% 4.3% 4.6%
margin
12 Comparable operating profit, continuing operationsOperating profit by division
€+4.0 m
€m € +30.2 m
90 83.0
79.0
80 75.7
70
60
50 45.5
40
30
€ -1.2 m
20
10 5.0 3.8
0
Grocery Trade Building and technical Trade excl. speciality Car Trade
goods trade
Q2/2019 Q2/2020
13 Comparable operating profit, continuing operationsReturn on Capital Employed Improved to 10.1%
%
20
14.8 14.6
15 13.7
10.1
10 9.5
8.8
7.5
6.6
5
0
Grocery trade Building and technical trade Car trade Group, continuing operations
Q2/2019 Q2/2020
14 Rolling 12 months, comparable figuresStrong Financial Position
Cash flow from operating activities strengthened operatively by €195 million, cash flow for the
comparison period contained exceptional positive items totalling €44 million
Q2/2020 Q2/2019
Cash flow from operating activities, € million 421.8 271.4
Cash flow from investing activities, € million -70.6 -347.2
Capital expenditure, € million 69.1 373.4
Liquid assets, € million 461.8 200.6
Interest-bearing net debt excl. lease liabilities, € million 330.0 439.6
Interest-bearing net debt/EBITDA (rolling, excl. IFRS 16 impact) 0.6 1.0
Lease liabilities, € million 2,312.1 2,351.6
15GROCERY TRADE, BUILDING AND TECHNICAL TRADE, CAR TRADE Market Q2 vs. K Group
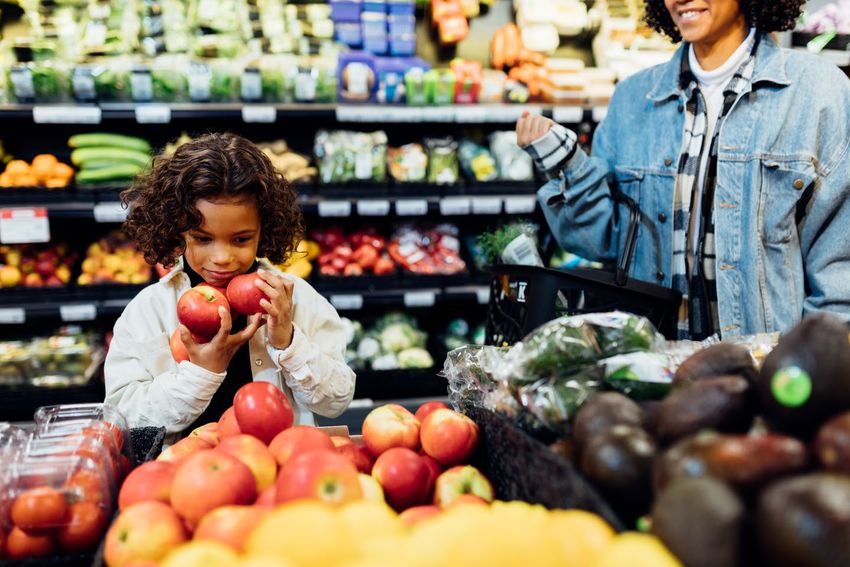
Grocery Trade Q2

Market Q2
                                                                         K Group
•    Significant growth in retail sales of food due to the exceptional
     circumstances                                                       •   Well-functioning strategy helped also under exceptional
                                                                             circumstances, retail sales up by 12.3%
•    Total market growth in retail 9.5%*, prices up by approx. 1.3%
                                                                         •   Market share growth continued stronger than before
•    Safety of customers and personnel emphasised during the
     epidemic                                                            •   Sales grew in all K-food store chains
•    Customer visits down, average purchase up due to the epidemic
                                                                         •   We have been able to respond to the rapid rise in demand for
•    Strong growth in demand for online sales of groceries                   online grocery sales better than our competitors
•    Demand plummeted in foodservice, a turn for the better              •   Profitability improved despite the decrease in Kespro’s sales
     seen in June

17   * Source: The Finnish Grocery Trade Association PTY
Building and Technical Trade Q2
Market Q2
K Group
• B2B trade has continued strong in both building and home
• Net sales grew forcefully and profit rose to a new level
improvement trade and technical wholesale
• B2B trade continued strong in both building and home
• Activity on construction sites has continued without major
improvement stores and Onninen
disruptions
• B2C sales grew clearly more than anticipated
• Surprisingly high activity in B2C sales across Northern Europe
• We strive to accelerate growth also via new acquisitions
• It is still difficult to estimate how demand will develop in H2
• Strategic review of operations in the Baltics and Belarus and
• Demand in the leisure trade weakened heavily at the beginning
Kesko Senukai subsidiary consolidation examination
of the epidemic, fast recovery since May
ongoing
18Car Trade Q2
Market Q2 K Group
• Automotive sector struggling globally due to the • New car sales and orders below normal levels,
coronavirus epidemic and tightened emission limits car sales improved clearly in June
• Orders for new passenger cars in Finland down by more • Market share of brands represented rose to 17.8%,
than 40%, orders for vans down by nearly 20% 18.5% in June and Volkswagen the market leader
• Decline in demand for servicing, repairs and spare part • Development of own leasing fleet good despite
services and used cars more moderate the epidemic, totalling 2,600 cars at the end of Q2
• Signs of recovery in the car trade towards the end of Q2 • Servicing and spare part sales have remained good
• Adjusting operations has helped in managing the situation
19Guidance for 2020
Outlook and Guidance for 2020
Outlook for Kesko Group's continuing operations is given for year 2020, in comparison with year 2019.

Kesko estimates that the comparable operating profit for continuing operations will be in the range of €430-510 million in 2020. Before, the
company estimated that the comparable operating profit for continuing operations would be in the range of €400-450 million.

Guidance upgrade rationale
The profit guidance upgrade is based on better than anticipated net sales development in the building and technical trade division in various
operating countries as well as in the grocery trade. Consumer sales have developed better than anticipated during the exceptional
circumstances. B2B sales have also continued stronger than anticipated in both building and home improvement stores and Onninen. Retail sales
for all the grocery trade chains have developed better than anticipated, compensating for the decrease in sales in the foodservice business.

In addition to the foodservice business, net sales have clearly decreased in the car trade. Adjustment measures carried out have enabled the
company to manage the situation and costs in its various business operations under the challenging circumstances.

Although conditions surrounding the coronavirus have improved in Kesko’s operating countries, it is hard to predict the development of the
epidemic situation and its economic impact. Therefore, the range for the guidance on comparable operating profit for 2020 is still wide.
21
Contact

Hanna Jaakkola
Vice President, Investor Relations
tel.+358 40 5666 070
hanna.jaakkola@kesko.fi

23
Attachments
24
Net Sales
Net sales growth 1.6%
                                                                                        Rolling 12 months
                                                    €22.5 million
                                                                                        €m
                                                                                                      3.2%             2.9%
     €m

                                                      1,456.0                                                        5,611.3
                                1,408.6   1,402.7                             1,431.1   5,600
                                                                                          5 600   5,531.2
1 400
1,400                                                               1,321.5
             1,263.9                                                                      5 400
                                                                                        5,400
1,200
1 200
                                                                                        5,200
                                                                                          5 200
1,000
1 000
                                                                                        5,000
                                                                                          5 000
     800
                                                                                          4 800
                                                                                        4,800
     600                                                                                4,600
                                                                                          4 600
     400                                                                                4,400
                                                                                          4 400

     200                                                                                4,200
                                                                                          4 200

      0                                                                                   4 000
                                                                                        4,000
               Q1/19             Q2/19     Q3/19        Q4/19       Q1/20     Q2/20                   2019          Q2/2020

25         Comparable figures                                                                     %     Comparable growth
Operating Profit
Record Q2 operating profit
Rolling 12 months
+ €4.0 million €m
€m 360
120 340 335.4
327.9
98.6 320
100 93.5
79.0 83.0 300
80
56.8 60.4 280
60
260
40
240
20 220
0 200
Q1/19 Q2/19 Q3/19 Q4/19 Q1/20 Q2/20 2019 Q2/2020
Operating
4.5% 5.6% 6.7% 6.8% 4.6% 5.8% 5.9% 6.0%
margin
26 Comparable figuresExcellent Performance by K Group people and Successful Strategy
Execution Enabled a Good Result Under Exceptional Circumstances
• K-retailers have shown their strength also during these
exceptional times: agility and fast response in the stores
• Store staff and Kesko employees have performed excellently
under the exceptional circumstances
LET’S HELP
• Success in ensuring safety
THOSE OVER 70
• We have managed to ensure product availability and deliveries
to stores under all circumstances
• Fast response and establishing new services such as offering
shopping assistance to people over 70 and selling restaurant
meals in grocery stores
• Successful adjustment of foodservice operations to the sudden
decline in sales
27Successful Response to Rapid Growth in Demand for
Online Grocery Sales
• Online grocery sales at K-Ruoka.fi approx. €93 million* Online grocery sales, € million*
in H1, up by 446% 35
• 176 stores joined the K-Ruoka.fi service, which now 30
covers 447 K-food stores around Finland
25
• Online accounted for 4.2% of sales in Q2, vs. 0.6%
in 2019 20
• Despite the rapid growth, customer satisfaction has 15
remained high, NPS 80 10
• Online sales of groceries clearly above earlier levels 5
• Growth continues strong also after the epidemic 0
January February March April May June
Myynti
Sales 2019 Myynti 2020
Sales 2020
* Figures 0% VAT, incl. collection and delivery fees
28Net Sales
Q2 net sales up by 8.7%, growth 8.7% also in comparable terms
Rolling 12 months
€92.3 million
€m
2.7% 4.7%
€m
44,400
400
1,400
1 400
44,200
200 4,144.1
1 200
1,200 1,158.7
1,066.4 1,074.0 3,984.5
976.6 44,000
000
11,000
000 934.9
867.5
33,800
800
800
33,600
600
600
33,400
400
400
33,200
200
200
33,000
000
0
2019 Q2/2020
Q1/19 Q2/19 Q3/19 Q4/19 Q1/20 Q2/20
29 Comparable figures, excl. speciality goods trade % Comparable growthOperating Profit
Record Q2 operating profit
Rolling 12 months
+ €30.2 million €m
168.9
€m
80 75.7 160
70
60 54.5
140
50 45.5 133.3
40
29.4
30 120
20
9.3
10 3.9
0 100
Q1/19 Q2/19 Q3/19 Q4/19 Q1/20 Q2/20 2019 Q2/2020
Operating
0.5% 4.3% 5.1% 3.0% 1.0% 6.5% 3.3% 4.1%
margin
30 Comparable figures, excl. speciality goods tradeContinued Strong Development for K-Rauta and Onninen
in Finland
Good sales development has accelerated market share growth
• B2B trade has continued stronger than anticipated
• Onninen’s profitability improved further thanks to
e.g. good product availability
• K-Rauta’s B2C trade has developed better than
anticipated during the exceptional circumstances
• Extended opening hours for K-Rauta have improved
service and increased sales
• Sales of revamped K-Rauta.fi online service up by some
100%, lending good support to sales in physical stores
31Determined Strategy Execution in Sweden Has Led to Significant Improvement in Profitability • Profitability improved significantly and profit exceeded €10 million, strong market also contributed • K-Rauta’s net sales growth 17.1% comparatively, growth also strong in K-Bygg • Significant measures taken to improve K-Rauta’s profitability, work continues • K-Bygg’s sales and profitability have developed well as part of Kesko • Technical wholesale company MIAB acquired in Sweden • Sweden an important growth area also going forward 32
Acquisition of Carlsen Fritzøe Handel,
 a Leading Building and Home Improvement
 Operator in the Oslo Region
 • Carlsen Fritzøe’s 25 stores in the Oslo fjord region highly complement
   the Byggmakker store network
 • In 2019, the company’s net sales totalled some €201 million and EBITDA
   €13.3 million
 • Debt-free transaction price some €142 million, objective to complete
   the acquisition in August-September
 • Once the transaction has been completed, Kesko will be a leading building
   and technical trade operator in Norway with retail sales of nearly €900 million
 • Significant growth potential in Norway also going forward
                                                                                     CFH store

                                                                                     Byggmakker store

33
Net Sales
Q2 net sales down by 9.4%, or 21.5% in comparable terms
Rolling 12 months
€m
- €19.9 million -11.6% -7.7%
900
€m
863.9 866.0
250 228.5
222.9 222.6
211.9
200.5 800
200 192.0
150
100 700
50
0 600
Q1/19 Q2/19 Q3/19 Q4/19 Q1/20 Q2/20 2019 Q2/2020
34 Comparable figures % Comparable growthOperating Profit
Operating profit down by €1.2 million
Rolling 12 months
€m
- €1.2 million
€m 30
26.8
10 25 23.9
9.0
8 7.7
20
6.1
6 15
5.0 5.0
3.8
4 10
2 5
0 0
Q1/19 Q2/19 Q3/19 Q4/19 Q1/20 Q2/20 2019 Q2/2020
Operating
3.8% 2.4% 2.3% 3.9% 2.7% 2.0% 3.1% 2.8%
margin
35 Comparable figuresVolkswagen in Finland for 70 Years • First Beetles handed over to buyers on Senate Square, Helsinki on 9 June 1950 • More than 347,000 Volkswagen vehicles on Finnish roads • Strategic partnership with the world’s biggest car manufacturer Volkswagen Group since 1977 36
You can also read