2018 Results February 7, 2019 - Fagron investor Relations
←
→
Page content transcription
If your browser does not render page correctly, please read the page content below
2018 Results February 7, 2019


Video: Together we create the future of personalized medicine

What is Personalized Medicine?

          Prevent                Diagnose   Treat
What is Personalized Medicine?

          Prevent                Diagnose   Treat
Key Drivers of Personalized Medicine

  Dosage       Dosage         Drug
   forms      strengths     shortages

Combination   Lesser side
 therapies      effects

 Pharmaco
 Genetics

Global Market for Personalized Medicine

                       ~$12b
                          Personalized
                          Medicine

                                          ~$1.2b
                                            Brands &
                                            Essentials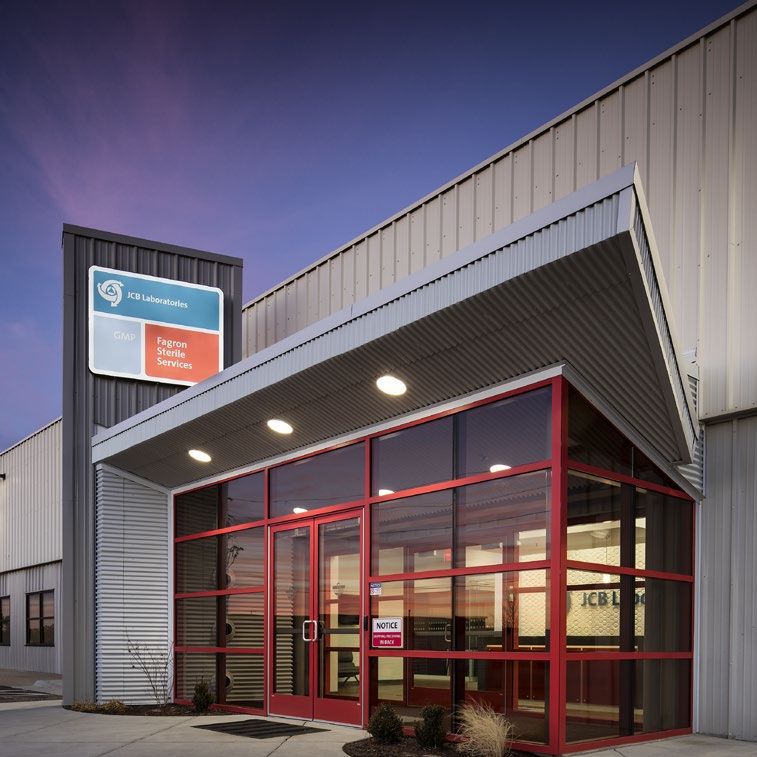
Market Shares of Fagron

Personalized medicine      Personalized medicine   Personalized medicine
~$ 3.0b                    ~$ 1.8b                 ~$ 4.5b
Brands/Essentials          Brands/Essentials       Brands/Essentials
~$ 300m                    ~$ 180m                 ~$ 450m

Fagron share FCS NL ~50%   Fagron share B/E ~50%   Fagron share FCS ~7%
Fagron share B/E ~45%                              Fagron share B/E ~12%

2018
Operational
 Headlines
Leadership
team                                                    Rafael Padilla
                                                        Chief Executive Officer

                                     Karin de Jong
                                     Chief Financial                    Marcello Bergamini   Ellen van Sprundel
       Constantijn van Rietschoten   Officer                            Area Leader          Leader
       Chief Communications
                                                                        Europe (excl. NL)    The Netherlands
       Officer

                                     Johan Verlinden
                                     Global Legal                       Ivan Maróstica       Hal Weaver
       Tomasz Kania                  Affairs Director                   Area Leader          Area Leader
       Chief Operations Officer                                         South America        North America

                                     Céline Caveye
                                     Global HR
                                     Director                           Max Belanger
       Savvas Koulouridas
                                                                        Area Leader
       Global Innovations Director
                                                                        RoW

                                     Jason McGuire
                                     Global Quality
       Baris Arican                  Director
       Chief Information Officer

                                                                                                                  Pg.11
Fagron Europe
B&E
• Successful integration of Kemig (Croatia)
• Launch of Fagron Genomics in Barcelona
• Brands grow to 11% of sales, from 8% in 2017
• Healthy growth in Essentials
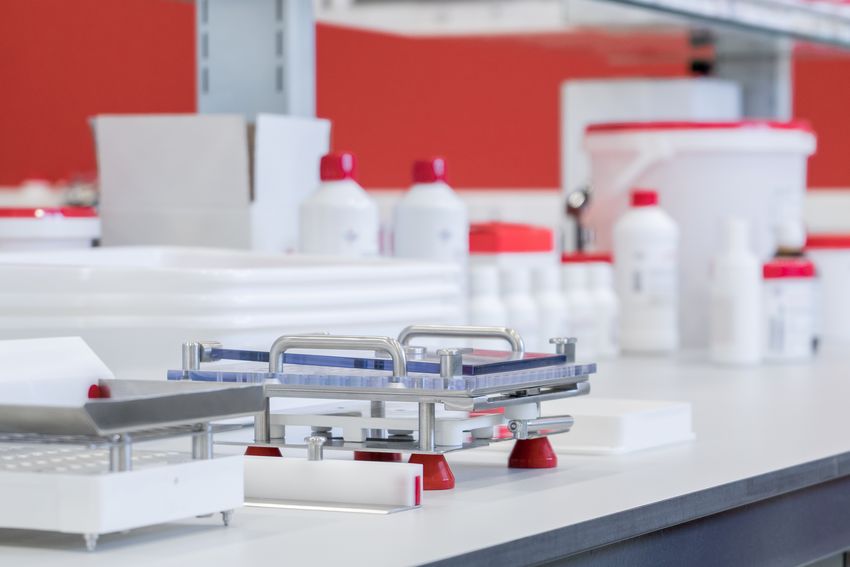
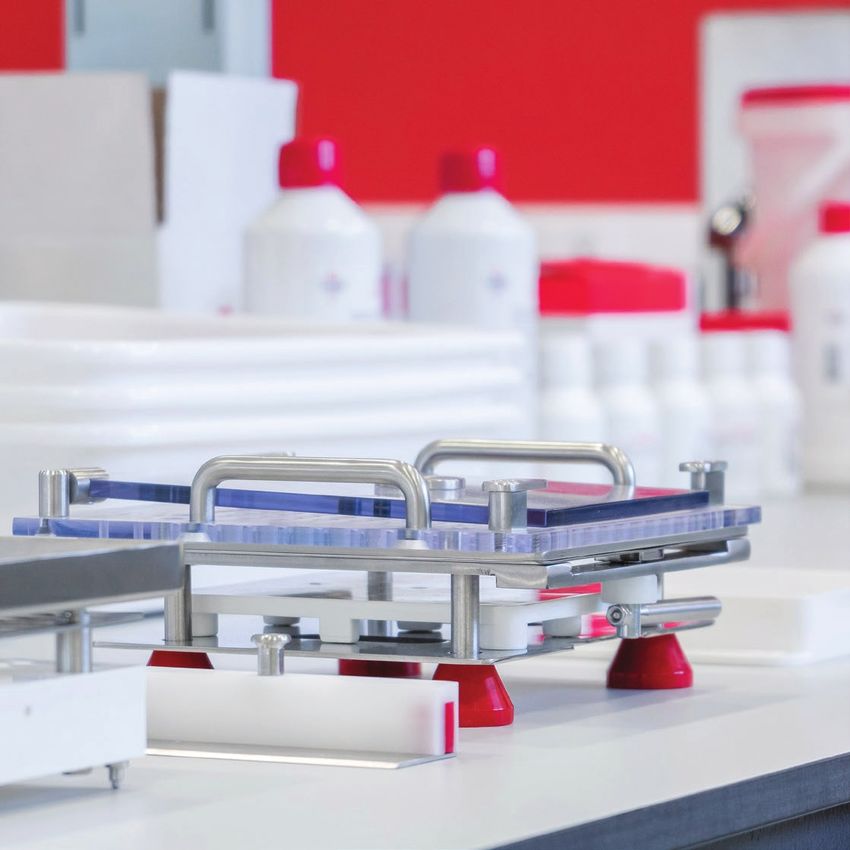
FCS
• Investing in sterile facility in NL to further improve quality and
processes - € 4m of missed sales in 2018
• FSBA-facility in NL received GMP-status
• Introduction of midazolam cassettes and syringes to Dutch market
• Introduction of LIA to market by FCS BelgiumFagron Europe
(x € 1,000) 2018 2017 ∆
Turnover 250,086 245,769 +1.8%
REBITDA 63,313 63,301 0.0%
REBITDA margin 25.3% 25.8%
• Organic turnover growth of 2.7% (+2.7% CER)
• Acceleration in H2 to 3.5% (H1: 1.9%)
• € 4m negative impact on turnover due to
reduction of capacity in Dutch facility
• REBITDA margin decreases by 50bps to
25.3%Fagron South America
B&E
• Successful integration of All Chemistry (now: Organic
Compounding)
• Organic turnover growth at CER of 12.7%
• Growth driven by underlying market growth, good product
availability and focus on Brands
• Brands represent 36% of sales – well-filled pipeline for 2019
FCS
• Turnover growth at CER of 14.4%
• Focus on distinctive and innovative Brands
• Better view on compounding markets in Central America creates
future opportunitiesFagron South America
(x € 1,000) 2018 2017 ∆
Turnover 100,930 103,190 -2.2%
REBITDA 20,107 20,815 -3.4%
REBITDA margin 19.9% 20.2%
• Organic turnover growth of -5.4% (+12.7% CER)
• Growth in CER driven by:
• Strong growth of Brazilian compounding
market
• Good product availability
• Focus on Brands
• Strong growth in Colombia (+14.4% CER)
• REBITDA margin decreases by 30bps to 19.9%,
but increased from 19.8% in H1 to 20.0% in H2Fagron North America
B&E
• Acquisition and integration of Humco
• Successful implementation of multiple brand strategy
• Growth acceleration in 2018 – 13.9% organic growth in H2-18
• Strong growth in Brands (15% of sales in 2018)
FCS
• Growth acceleration in 2018 – 32.6% organic growth in H2-18
• Growth of 72.8% in Wichita in 2018
• Wichita on-track to reach communicated turnover target
• Very well positioned to benefit from ongoing outsourcing trendFagron North America (x € 1,000) 2018 2017 ∆ Turnover 113,488 77,769 +45.9% REBITDA 14,847 11,461 +29.5% REBITDA margin 13.1% 14.7% • Organic turnover growth of 19.5% (+25.1% CER) • FCS performing in-line with expectations • Organic growth of 30.0% at CER • Acceleration in H2 to 32.6% (H1: 27.5%) • Wichita facilities grow 72.8% in 2018 • Brands & Essentials • Acceleration in H2 to 13.9% (H1: 7.6%) • Integration of Humco on-track • REBITDA margin decreases by 160bps to 13.1%, but increases from 11.0% in H1 to 14.8% in H2
2018
Financial
 Results
Consolidated Turnover
 (x € 1,000)         2018     2017       ∆
 Fagron             464,504   426,728   +8.9%
 HL Technology        7,174     6,802   +5.5%
 Total              471,679   433,529   +8.8%

• Turnover +14.5% at CER
• Organic turnover growth of 3.9% (+9.3% CER)
Turnover Development
Excluding HL Technology

500

                                  19.5   22.8   26.6   5.1   464.5
450
                           13.1
                     6.4
        426.7
400

350

300

250
Financial Review
Gross Margin Operating costs REBITDA
+9.1% to € 290.7m +12.3% to € 191.7m +3.5% (+8.8% CER) to € 99.1m
FY-18: 61.6% (+10bps) due to acquisition/ integration of Margin decreases to 21.0%
H2-18: 61.8% (+110bps) Humco & FTE increase WichitaFinancial Review
Non-recurrent result EBITDA DA
Amounts to -€ 6.0m +1.0% to € 93.0m +11.5% to € 19.6m
Consists of settlement with former H2: +9.1% to € 49.1m Increase mainly driven by
owners JCB, dismissal costs amortization of the Humco brand
and acquisition costsFinancial Review
Financial result Taxes Net profit
Unchanged at -€ 18.6m Effective tax rate of 21.1% -8.8% to € 42.9m
Effective cash tax rate of 21.8% Recurrent net profit increases by
0.9% to € 49.5mNet Financial Debt
Consolidated
300
250
18.4 9.2
15.7 7.2
200 73.3
38.9
150
252.3
236.2
100
50
0Together, we create the future of personalized medicine Albert Mascarell-Creus Leader Fagron Genomics
FAGRON GENOMICS

Opportunities
Standardization on pharmaceutical markets
Low treatments efficacy
Taylor-made pharmaceutical solutions
The global pharmaceutical market is inefficient
    Overmedication. One drug for all (standardization). Trial-error (or fashion) selection

        75%                          43%                             40%                             38%                              52%
      ONCOLOGY                     DIABETES                          ASTHMA                         ANTI-                       OSTEOPOROSIS
                                                                                                DEPRESSANTS

                          % of patients with poor treatment results
          Personalized Medicine and Pay for Performance: Should Pharmaceutical Firms be Fully Penalized when Treatment Fails? Antoñanzas et al., PharmacoEconomics 2018
Personalization is the key for treatments success
DOSAGE
ADJUSTMENT SELECT BEST DRUGS
• Increase or reduce the • Taylor made treatments to
compound concentration potentiate the response
based on expected and efficacy to single and
efficacy. complex drugs
AVOID SECONDARY COMFORT
EFFECTS APPLICATIONS
• Understand the potential • Multiple APIs in a single
risks to suffer toxicity and product
select alternative • Compounds synergy
treatments. • Alternative vehicles
• Fagron BrandsFAGRON GENOMICS About us What is Fagron Genomics? Our tower for success
Next Generation Genomics Laboratory

Massive Genotyping
Gene mutation panels for pharmacogenomics, cancer, inflammation and custom
assays.

                         From 16 to 828 mutations         Hormonal pharmacogenetics
                         From 1 to 95 patients/run        Anesthetics pharmacogenetics
                         One mutation – 1-3 data points
                         TAT: ~8 hours                    Trichology pharmacogenetics

Next Generation Sequencing (NGS)
Powerfulness on genetics to unravel the patient’s status. For physicians and clinical
trials.
                         Neurodegenerative

                                  Cardiovascular
                                                                              Genome
                                 Microbiome                                   Expression

  Read at full-gene level              Oncology
                                                                             Clinical
  From 1 to 384 patients/run
  One mutation – 50-100 data points – 15Gb
                                                                             Exome
  TAT: Up to 56h                                                             25.000 genes
A tower to define the roadmap to success
PRESCRIBERS
1 Empowered physician. Prescriptions of Brands.
2 PHARMACIES (Brands + Essentials)
Increase consumption of compounding services.
3 ACADEMIES
Spread the message. Educate. Awareness.
PATENTS + INNOVATION
4 Algorithms. IA. Patents. Fast go-to-market.
DIGITALIZATION
5 Easy online platform to manage DNA data.
PERSONALIZATION
6 Focus on personalized medicine.
One patient, one treatment.FAGRON GENOMICS Our services Current services TrichoTestTM
Our analyses portfolio 2019

                         TELOTESTTM                                         PAIN-PGXTM

                         Measure the cellular                               Optimize dosage and
                         biological age through                             select the best
                         telomere length                                    anesthetics drugs

TRICHOTESTTM                                       NUTRITESTTM                                    BHRT-PGXTM

Personalized treatment                             Personalized obesity                           Balance the hormonal
for alopecia                                       and anti-aging                                 replacement
                                                   nutritional treatments                         treatments

                                           Focused on real patient needs.
                                 Empowers the physician through DNA information.
                             Oriented to improve treatments efficacy and patients fidelity.
Selecting the best anesthetics for surgeries
More than 40 drugs analyzed | Avoid anesthetics complications | Reduce hospital costs.
70% Response to codeine Response to codeine 30%
10% Toxicity desflurane Toxicity desflurane 90%
90% Increase dosage for ibuprofen Increase dosage for ibuprofen 30%
60% Efficacy morphine Efficacy morphine 60%
50% Sinergy opioid + NSAID Sinergy opioid + NSAID 75%
80% Safety lidocaine Safety lidocaine 20%Closing the gap: from DNA to treatment
GENE INTREPRETATION GREEN-RED COMPOUNDS CATEGORIES OVERVIEW PERSONAL FORMULA
Color-based interpretation of APIs and compounds Fast interpretation in order to Created based on:
the genetic variations found. recommended and to be provide clear and direct DNA variations
avoided. information to the patient Clinical data
Medical protocols
Pharmaceutical know-howFAGRON GENOMICS The market Specialities market
A growing market volume

                                                      +39,500          +7.1% 2018-2022
          Infertility / Gynecology                    GYNECOLOGISTS

                                                 +39,000
           Medical Aesthetics                    MED.AESTHETICS
                                                                      +7.8% 2015-2020
                                               +13,000
              Dermatology                      DERMATOLOGISTS

              Nutrition                   +35,000                     +15.0% 2016-2026
                                          DIETITIANS/NUTRITIONISTS

          Anesthesics
                                     +12M                             +1.4% 2017-2018
                                     SURGERIES/YEAR
FAGRON GENOMICS Go-to-market European launch Mutual benefits for the group
Our synergy leads us to increase sales & margin
+60 countries Treatment
+2,500 team personalization
Global Diagnostic &
Structure and
leadership in Innovation Prevention
investment
compounding tools
MAIN BENEFITS MAIN BENEFITS
- Innovative mission aligned with the rebranding - World-wide market penetration
- 1 patient 1 genetic test 8-48 prescriptions / year - Unlimited therapeutically agents to recommend
INCREASE IN PERSONALIZED TREATMENTS = INCREASE IN COMPOUNDING SALES
39Summary & Outlook 2019
• New Brand Identity & Purpose
• Turnover growth driven by all areas
• Growth acceleration in H2-2018
• Focus remains on:
• strong organic growth, and
• targeted acquisitions
• Strategic focus on innovation and quality
improves competitive advantage
• Dividend proposal of € 0.12 p/s
• Further growth of turnover and profitability
expected in 2019Video: 2019
Q&A
You can also read