Reviewing 2020's Holiday Shopping Season - Adobe Digital Insights
←
→
Page content transcription
If your browser does not render page correctly, please read the page content below

Reviewing 2020's Holiday Shopping Season
Adobe Digital Insights

Methodology

  •   Holiday season defined:
       •   Season is the months of November and December (some analyses run thru mid-December due to timing of data availability)
       •   Cyber 5 are the five days between Thanksgiving and Cyber Monday

  •   Analysis of more than 1 trillion visits to U.S. based retail websites.
  •   Product and pricing insights based on analysis of sales of more than 100 million unique products.
  •   Adobe Analytics measures transactions at 80 of the top 100* U.S. online retailers — more than
      any other technology company.
  •   Shipping analysis based on millions of orders in 2019 and 2020.

                                                                                                                 *Per Internet Retailer 2018 eGuide
                                                                                                         ©2020 Adobe. All Rights Reserved. Adobe Confidential.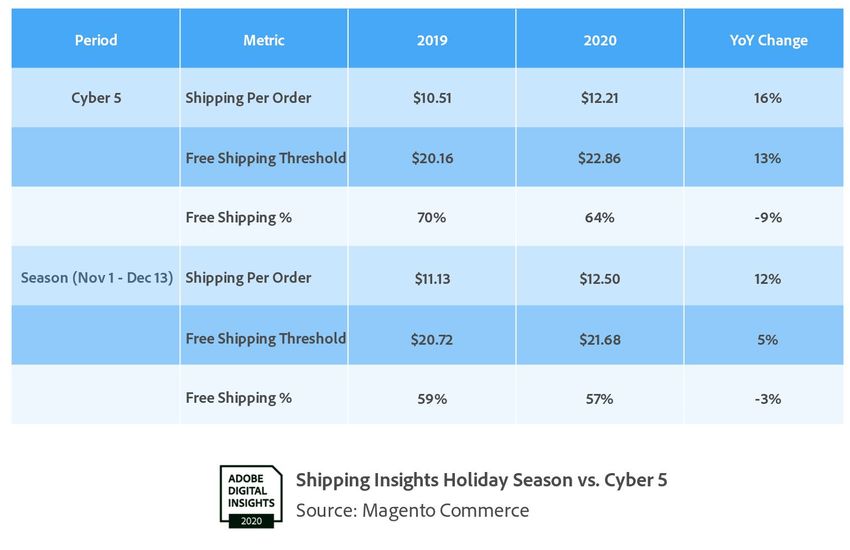
Key findings
Driven by COVID-19, the 2020 holiday season was one for the record                               David vs. Goliath
books                                                                                            •   Large retailers ($1 billion+) grew their share of total
•   Online holiday season revenue exceeded $188.2 billion dollars, 32% YoY growth.                   holiday revenue over small retailers ($10-50 million)
•   Every day, including Christmas Eve, exceeded $1B. With Cyber Monday exceeding $10B, the          thanks to a higher in-season growth rate.
    average day eclipsed $3B for the first time.                                                 •   Large retailers also benefit from higher conversion of
•   Early and late sales reduced the impact of Cyber 5 (Thanksgiving thru Cyber                      visits resulting in more money per minute.
    Monday), which saw a growth of just 21% compared to the 32% for the overall season
•   November, which included Cyber Monday this year, reached the $100B level – the first time
    a single month has hit those highs.                                                          Top gifts for an unprecedented holiday
•   Christmas Day, typically the biggest mobile shopping day, saw 52% of the revenue coming      •   New game consoles and related accessories topped gift
    from smartphones – surpassing the halfway point for the first time.                              lists, along with perennial favorites.

The drivers of online revenue boost were quite varied
•   More visitors and better conversion drove the lift in sales. Average order value remained
    flat YoY
•   Home improvement and consumer electronics retailers saw strong growth
    whereas apparel and jewelry exhibited lower growth
•   Cities with higher household incomes and /or better educated population grew more than
    those at the other end of the spectrum

Minimal contact shopping
•   Ordering online for local pickup (BOPIS) continued its growth over last year, peaking just
    two days before Christmas.
•   Given the 1 billion+ orders generated it was a bit more expensive when it wasn't free –
    minimum threshold went up as did costs.
                                                                                                                              ©2020 Adobe. All Rights Reserved. Adobe Confidential.
Online Retail Spend An unprecedented year resulted in a much bigger online season.
E-commerce holiday season saw two years’ worth of growth, reaching $188.2B, +32%
YoY

 • The online holiday season exceeded $188B
                                                                35%                                                                                                       $200B
                                                                                                                                                                32%       $180B
                                                                30%

   resulting in a strong growth rate of 32% over the            25%
                                                                                                                                                                          $160B
                                                                                                                                                                          $140B

                                                       Growth
   2019 Season

                                                                                                                                                                                  Spend
                                                                                                                                                                          $120B
                                                                20%
                                                                                18%                                             17%                                       $100B
                                                                15%                                             15%
                                                                                              14%                                                                         $80B
                                                                                                                                               13%
 • The COVID-19 pandemic accelerated the shift of               10%                                                                                                       $60B
                                                                                                                                                                          $40B
                                                                5%
   spending to online starting in March. By the                   0
                                                                      $70.1B   $82.5B        $94.4B        $108.2B             $126B        $142.5B          $188.2B      $20B
                                                                                                                                                                           0

   holiday season consumers shifted twice as much                      2014     2015          2016           2017               2018           2019            2020

   as expected into one year: the 32% is twice the                                                     Growth          Spend

   15% average annual growth rate seen since 2015.
                                                                                        Online Holiday Spend by Year
                                                                                        Source: Adobe Analytics

                                                                                                                                       ©2020 Adobe. All Rights Reserved. Adobe Confidential.
Consumers concentrated their spending during the Cyber 5 days despite earlier sales
• Given YoY growth in excess of 50%* since the early
days of COVID-19 and changes to physical shopping,
retailers had incentive to balance the load by
spreading deals out.
• The Cyber 5 days accounted for 18% ($34.4B) of the
entire season, down from 20% in 2019.
• This amounted to shifting $3.7B of sales (1.2 days'
worth) to other days in the season.
• Because of the shift, Cyber 5 had some of the slowest
growth rates across the season, with the five days
totaling 21% growth. Only SMB Saturday came close to
matching the overall season growth – 30% vs. 32%.
• Despite having a stronger growth, Black Friday still
didn’t surpass Cyber Monday
* There was about 51% more online shopping this year compared to last year
between April 1st and Dec 14th, representing an extra $216B spend online.
©2020 Adobe. All Rights Reserved. Adobe Confidential.With every day over $1B this year consumers reached key spending milestones much
earlier
• Given strong YoY growth, there were more “big days” this year
• For the first time there were no days with less than $1B in online spend
• Christmas Eve was the sole day in 2019 under $1B, this year sales were $1.1B
• Thanksgiving joined the $5B club for the first time
• As a result, consumer spending reached season milestones earlier
• $50B: Nov 20, 2020 six days earlier than in 2019
• $100B: Nov 30, 2020 10 days earlier than in 2019
• $150B: Dec 13, 2020 for the first time ever
©2020 Adobe. All Rights Reserved. Adobe Confidential.Not every region, demographic or category saw the same growth over Cyber 5
States Categories City Demographics
Strong Growth Low Growth High Growth Low Growth High Growth Low Growth
Rhode Island South Carolina Consumer Electronics Apparel HH Income > $7kk HHI < $40k
New Mexico Wyoming Grocery Jewelry Highly Educated Less Education
Maine Missouri Home Improvement
Vermont Arkansas
New Hampshire Oklahoma
• Throughout the holiday season, groceries, appliances and books saw major boosts over October levels compared to last year - grocery at
404% higher boost than 2019, appliances at 202% and books at 107%. The toys and jewelry categories saw incremental boosts, with
toys seeing 50% and jewelry 66%more boost than 2019.
©2020 Adobe. All Rights Reserved. Adobe Confidential.Shopping in a Pandemic Other than the level change, not so different as past years.
Curbside / pickup provided an alternative to wandering store aisles
•   Since the beginning of the pandemic consumers shifted their
    buying habits to take advantage of retailers BOPIS (Buy Online
    Pick-Up in Store) options.
•   Earlier in the year at the onset of the pandemic, BOPIS
    increased from 15% of orders at retailers who offer the service,
    to 25%, a 65% share increase.
•   Over the course of the holiday season, BOPIS continued to
    average 1 in 4 orders (25%), an increase of 40% over 2019
    holiday levels (18%).
•   As expected, BOPIS usage peaked for the last-minute shopping
    when standard or even expedited shipping won’t get gifts
    delivered on time.
      •   In both 2020 and 2019, the peak day for BOPIS usage was
          December 23, two days before Christmas.

                                                                       ©2020 Adobe. All Rights Reserved. Adobe Confidential.
Free shipping slightly less prevalent this year; the cost to ship rose.
• Based on Adobe's Magento Commerce data, consumers take
advantage of ‘free shipping’ especially during the Cyber 5.
• 57% of the season’s orders thru Dec 13th qualified for
free shipping
• That rose to 64% during Cyber 5 (+16%)
• Potentially related to the stress COVID placed on the
shipping infrastructure, Cyber 5 was more expensive to ship
this year than last year
1. The cost to ship (where charged) increased 12% YoY
from $10.51 to $12.21
2. The minimum observed order also increased from
$20.16 to $22.86
3. Orders shipped for free dropped from 70% during
Cyber 5 to 64% this year
©2020 Adobe. All Rights Reserved. Adobe Confidential.Retailers changed pricing at the beginning of Thanksgiving Week
Popular categories saw prices drop just before Cyber 5 Computer prices typically drop slowly thru the
(Nov 22nd) as retailers kicked things off early. holiday season, leveling off after Cyber 5. This year
was different with retailers offering aggressive
Toys and television product categories saw prices dip discounts the week of Black Friday.
19% below their October 1st benchmark, while computer
prices dropped 29% by Black Friday.
Data: Adobe’s DPI where prices are anchored on October 1st
12 ©2020 Adobe. All Rights Reserved. Adobe Confidential.Adobe’s holiday gift list included perennial brand favorites.
Toy Brands Technology Brands Gaming Brands
Barbie Acer Electronic Arts (FIFA 21, Madden 21, NBA 2K21)
LEGO Amazon Ubisoft (Just Dance 2021)
NERF Apple Sony (PlayStation 5)
Star Wars Samsung Microsoft (Xbox Series X/S)
Spin Master HP Nintendo (Switch, Super Mario, 3D All-stars)
Lenovo
Data thru Dec 15th
©2020 Adobe. All Rights Reserved. Adobe Confidential.Website visits were more valuable this year due to better conversion
• The change in consumer behavior led to not only
more visits but an increase in the value of those
visits.
• Revenue per visit increased 10% YoY during Metric Holiday 2019 Holiday 2020 YOY Change
holiday season.
Revenue per visit $4.20 $4.61 +10%
• That improved revenue per visit was driven by Conversion 2.8% 3.0% +9%
improved conversion since the average order
value changed by only $0.34 AOV $152 $153 0%
• Smartphones, the device with the lowest
conversion, saw a 15% increase year over year, Value of a Visit
Source: Adobe Analytics
1.77% to 2.04%
• The stable value of an order meant there were
more packages to ship. Assuming just one
package per order suggests that over 1 billion
packages were shipped for the first time
©2020 Adobe. All Rights Reserved. Adobe Confidential.Smartphones continue their steady increase despite shifting to working from home
• Consumer behavior continues a trend
started in 2015, steadily moving their
shopping to smartphones.
• In November and December, 40% of
revenue came from smartphones in line
with the long-term trend that had
suggested around 41% for this holiday
season.
• $23B more was spent on smartphones
this year during the holiday season.
• On Christmas Day retailers saw 52% of
online spend come from smartphones –
the first time over 50%.
©2020 Adobe. All Rights Reserved. Adobe Confidential.Search engines were most likely the last touch before reaching a retailer’s site
• Search accounted for 45% of both visits and revenue
during the holiday season. Paid search traffic was
slightly more effective in generating revenue than
organic search.
• Paid search had a higher share of revenue (25%)
than visits (23%), while organic was less effective,
representing a 20% revenue share and a 22% visit
share.
• Second to search is direct traffic which is often
associated with brand strength/loyalty.
• Affiliate and partner referrals remain strong revenue
producers – while they are 6% of traffic, they are 14%
of revenue.
• Social networks and display are often considered
awareness generators – combined they account for
less than 5% of revenue and only 1 in 10 visits.
©2020 Adobe. All Rights Reserved. Adobe Confidential.Small retailers' advantage in revenue boost over large retailers weakened this season.
130%
• Small retailers ($10 - $50M) had seen a larger 107%
123%
boost* in sales during the beginning of COVID but 95%
84%
that advantage disappeared during the holiday season
as the large ($1B+) retailers concentrated their 52%
dominance of the holiday shopping season.
• However, the boost difference for the holiday season SMB Large
this year**, at 110% for large retailers vs. 104% for Holiday 2019 COVID Holiday 2020
small, was much closer than it was last year, at 107%
for large and 84% for small.
Holiday Boost (2019 & 2020) vs. COVID Boost for
SMB and Large Companies
Source: Adobe Analytics
*Comparing Mar 15 – Sep 30 vs. Jan 1 – Mar 14
**Comparing daily sales in Nov – Dec vs. Oct
©2020 Adobe. All Rights Reserved. Adobe Confidential.Large retailers drive sales earlier during Cyber 5, smaller ones later
• The boost difference for Cyber 5 days remains most 573%
545%
501%
pronounced on Thanksgiving, with large retailers having 486%
50% more of a boost* on that day than small retailers,
indicating their focus on leveraging Thanksgiving as a 273%
294%
233%
shopping day with deals.
154%
• Small business had a slight boost advantage on both
Small Business Saturday and Cyber Monday. The boost Thanksgiving Black Friday SMB Saturday Cyber Monday
difference shrunk by 6 percentage points from 2018 to Large SMB
2019, and we now see a 21 point advantage.
Sales Boost on Key Days (2020)
Source: Adobe Analytics & Magento Commerce
* Comparing daily sales in Nov - Dec vs. avg day in Oct
©2020 Adobe. All Rights Reserved. Adobe Confidential.Large retailers generated more revenue per minute of Cyber 5 shopping than smaller
ones
• Large retailers were 44% more effective at generating
revenue per time spent shopping, at $1.20 per minute for
large vs. $0.83 per minute for small
• Metrics that are similar between small and large retailers:
• Order value: consumers placed the same size orders
with small retailers as they did at large ones, $163 vs.
$167 respectively.
• Use of smartphones to shop: 63% of visits to small
retailers vs. 64% of visits to large retailers
• Metrics that set large retailers apart from smaller retailers:
• Large retailers have a slight advantage in order initiation
(carts per visit is +17%) and a significantly larger
advantage in completion: cart to orders (+73%)
• Whether it is comparison shopping, a level of
confidence, or other issue, large retailers have a much
higher final conversion rate: 5.1% vs. 3.0%
©2020 Adobe. All Rights Reserved. Adobe Confidential.You can also read