Statistical Study of Solar Activity Parameters of Solar Cycle 24 - BHU
←
→
Page content transcription
If your browser does not render page correctly, please read the page content below
Volume 65, Issue 1, 2021
Journal of Scientific Research
Institute of Science,
Banaras Hindu University, Varanasi, India.
Statistical Study of Solar Activity Parameters
of Solar Cycle 24
Abha Singh1 and Kalpana Patel*2
1 Department of Physics, T.D.P.G. College, Jaunpur-222002, U.P., India. abhatdcjnp@gmail.com
2 Department of Physics, SRM Institute of Science and Technology, Delhi-NCR Campus, Delhi-Meerut Road, Modinagar-201204, U.P. India.
spacek.kalpana@gmail.com*
Abstract: The solar atmosphere is one of the most dynamic smoothed sunspot numbers that was brought into existence with
environments studied in modern astrophysics. The term solar its classification (Kunzel, 1961). The number predicts short term
activity refers to physical phenomena occurring within the periodic high and low activity of the Sun. The part of the cycle
magnetically heated outer atmosphere of the Sun at various time with low sunspot activity is referred to as "solar minimum"
scales. S u n spots, high-speed solar wind, solar flares and coronal
while region with maximum solar activity is called as "solar
mass ejections a r e th e b a s i c p a ra m e t e r s th a t g o v e rn
maximum”. Hathaway et al. (2002) examined the ‘group’
solar activity. All solar activity is driven by the solar magnetic field.
The present paper studies the relation between various solar sunspot number which shows it use in featuring the Sun’s
features during solar cycle 24. The study reveals that there exists a performance during the solar year (Hoyt & Schatten, 1998a).
good correlation between various parameters. This indicates that
they all belong to same origin i.e., the variability of Sun’s magnetic Coronal mass ejections (CMEs) are the explosions in the solar
2
4field. corona during its high magnetic conditions. CMEs from the solar
corona are the most spectacular phenomena of solar activity and
Index Terms: Coronal Mass Ejections - Solar Activity- Sunspot perhaps the primary driver and source of space weather
Number- Solar Radio Emission Flux- Solar wind (Gosling, 1997; Singh et al. 2010). Traditionally, the coronal
mass ejection ejects away around 1014–1017g of the core which
I. INTRODUCTION
gives out the energy of the order (~10 19 – 1025 J) (Chen, 2011;
Sun’s ambience is wide and has ever active surroundings that Howard et al. 1985; Vourlidas et al. 2002). Solar flares are the
2
4are under education in today’s current astrophysics because of other class of the most spectacular disturbances seen on the Sun,
its continuous changes in the Sun’s magnetic field. The Sun’s typically lasting several minutes. It can be defined as the sudden
surface changes with time during its 11 years cycle and its brightening and explosive release of energy of order same as
magnetic flux affects robustly the entire environment. The 11 CME (~1019 – 1025 J) from a localized active region of the Sun,
year tenure was earlier defined by the sunspot number change mainly with the appearance like electric and magnetic field
(Schwabe, 1844). As we are running in the solar cycle 24, radiations containing X-rays, UV rays, visible light, and radio
which has its beginning in December 2008, is the weakest solar waves. Flares takes place in lively area just about sunspots, here
cycle (Jiang et al. 2015; Singh & Bhargawa, 2017, 2019) and it the strong field containing magnetic character go through the
is leading into minimal stage of the solar cycle 25. Of all photosphere to interact with the corona. The association of
astrophysical activity features, the sunspots are the most solar flares and CMEs have been widely (Gopalswamy, 2006).
easily observed and have been tracked since around early 1600s Solar flux is also fundamental pointer of the Sun’s performance
by Galileo. The sunspots can come into view as solitary, remote that helps to find out the level of radiation obtained from the
dark central region covered by a regular less dark region around Sun. The solar flux (10.7 cm) unit is solar flux units (SFUs),
umbra (Spiegel, 1994). Since last four hundred years, the where 1 SFU = 10-22 Watts per metre2 per Hz. Astrophysical
periodic changes in the Sun’s activity were featured with storm is a river of plasma consists mainly of negative charged
particle, positive charged particle and -particles, ejected from
*
Corresponding Author the higher environment of the Sun. The attractive region of the
DOI: 10.37398/JSR.2021.650125 197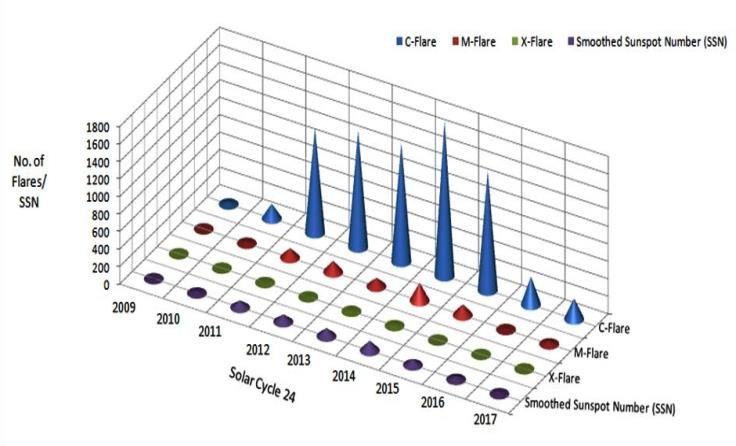
Journal of Scientific Research, Volume 65, Issue 1, 2021
Sun, and various structures, energy and unstable changes are was 13.8. Fig. 1(b) depicts the annual happening rate of
entrenched inside the astrophysical storm on a very large extent. regularity of the coronal mass ejections (CME) shown in SOHO
Based on the 110 Skylab CMEs, (Hildner, 1976) the relation LASCO directory. Minimal rate of occurrence was 746 in
between coronal mass ejection occurrence (CMEO) and the 2009. Rate of regularity maximizes continuously as sunspot
numeral spot on the surface of the Sun is given as: number and reaches to maximum 2477 in the year 2014.
Thereafter CME occurrence frequency continuously decreases
CMEO = 0.96 + 0.084 N (1) reaches to 784 in 2017. Fig. 1(c) and 1(d) are graph plotted for
intense solar flares and 2800 MHz astrophysical radio release (F-
The above relation is autonomous of the astrophysical 10) correspondingly during the same period. These plots are
performance cycle which showed a velocity of 3.2 for each awfully to a great extent alike to the numeral spot on the surface
daytime for maximum stage of the solar cycle. In 2012, learning of the Sun. For detailed analysis scatter plots have also been
was made by Webb and Howard for the tenure from 1973 to plotted.
1989, with the result showing the coronal mass ejection rate of
recurrence follows the astrophysical performance activity series
for amplitude and phase together. Gopalswamy et al. (2009)
made a revision for the relation between coronal mass ejection
and numeral spot number on the surface of the Sun and they
found that the relation between them was weak during the
maximal stage of the astrophysical cycle whereas in the uprising
and the downfall time of the astrophysical cycle the trend is not
the same. Sharma & Verma (2013) also revised the link among
the various solar characteristics. They were with the good
agreement as an inference. Visakh et al. (2017) studied solar
activity for 24th solar cycle with the inference that coronal mass
ejection and sunspot cycle are not in good correlation. Christian
(2018) have analyzed coronal mass ejection (CME) observed
parameters, sunspot number (SSN) and sunspot area (SSA) for
solar cycle 23, comparing them to check for possible similarities
in their variation pattern within the solar cycle. For the present
Fig. 1. Variations of (a) Sunspot Number, (b) CMEs Number, (c)
work the analysis has been done among the various astrophysical
Solar Flares and (d) Solar Flux during the period from 2009 to 2017.
parameters for the tenure of 2009 to 2017.
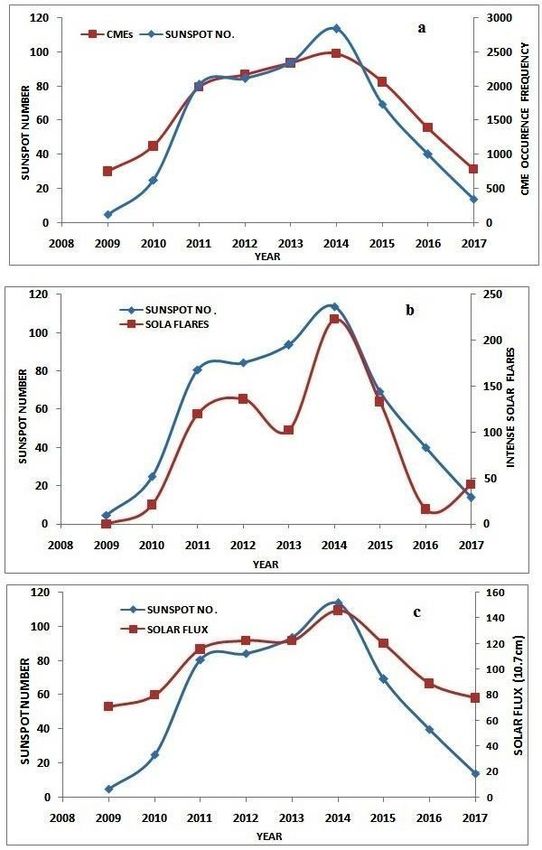
Fig. 2 (a, b and c) shows the correlation between different
II. DATA USED
solar activity parameters. It is clear that sunspot has good
The sunspot and solar flux information has been taken from correlation with solar parameters like CMEs, solar flares and
2
4the link: http://omniweb.gsfc.nasa.gov/form/dx1.html. The solar flux. The correlation coefficients were found to be 0.98,
astrophysical flares information has been taken from: 0.91 and 0.98 for these parameters respectively. Fig. 3 shows the
spaceweatherlive.com. The CME data used in this study is yearly analysis of the solar flux with its classification and its
collected from LASCO and SOHO available in CME catalogue comparison with the smoothed sunspot number (SSN). From this
that can be found at http://cdaw.gsfc.NASA.gov/CME. figure we observed that the maximum peak is obtained in the
year 2014 for the C- class flare, M-class Flare and the X-class
III. RESULTS AND DISCUSSION flare with their respective values as 1776, 207 and 16
respectively for the year 2014.
Fig. 1 depicts the changes in various solar parameters during
the period from 2009 to 2017, which shows that in the Correspondingly, the smoothed sunspot number observed was
4starting of solar cycle 24, the Sun is quiet with low sunspot
2 113.3 for the year 2014. Hence, it was found that the year 2014
number and solar activity. Fig. 1(a) depicts the annually was the maximum solar flare year of the cycle 24. Solar year
averaged numeral number of the sunspot on the surface of the 2009 and 2017 shows the minimum values for the C, M and
Sun, for the time of 2009 - 2017. In 2009, the numeral is 4.75 X class of the solar flare as they are the minimal year of the
which ascend to the value of 113.63 in 2014 showing the solar cycle with the SSN values as 4.8 and 21.7 respectively. It
maximal stage of the solar cycle. After that numeral value of is also observed that from 2009-2014 the SSN increases and
the spot on the surface of the Sun descends for the minimal
t h en decreases. Same trend has been followed by the C, M, X
stage of the astrophysical period. In 2017, the sunspot number class flare for the maximum years.
198
Institute of Science, BHU Varanasi, India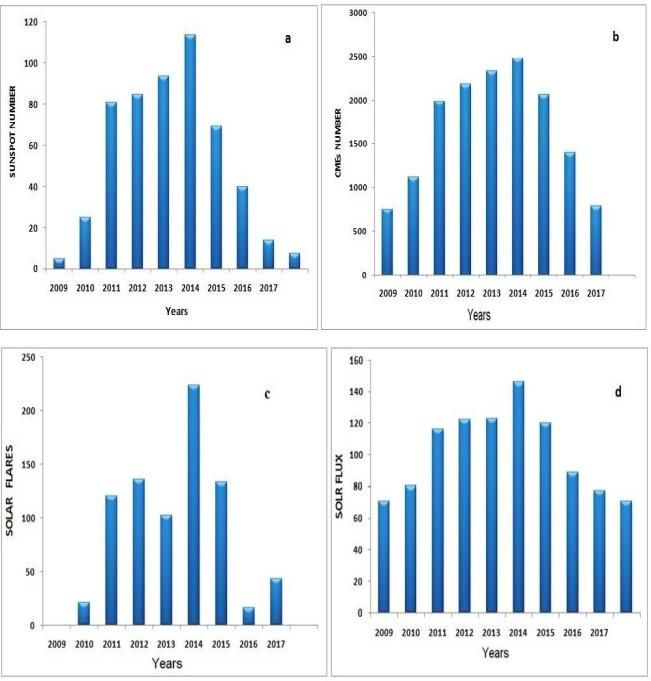
Journal of Scientific Research, Volume 65, Issue 1, 2021

                                                                           Fig. 4. Variation of solar indices till 2014 with its Smoothed Sunspot
                                                                         Number (SSN).

                                                                           In fig. 5, we have shown the variation of Dst storms with the
                                                                         smoothed sunspot number. The figure predicts that the minimum
                                                                         occurrence of disturbed storm time index (Dst) for the year
                                                                         2009 with SSN as 4.8. Smoothed sunspot number increases till
                                                                         2014 and then declining phase. Same behavior is observed by
                                                                         the disturbed storm time index with little contradiction for the
                                                                         year2013 and 2014 which is due to the variation of Dst
                                                                         occurrence for moderate, intense, severe storms for the same
                                                                         year which on total shows some contradiction.

Fig. 2. Correlation between various solar parameters during the period
                         from 2009 to 2017.

                                                                           Fig. 5. Yearly variation of disturbed storm time counts with its
                                                                         Smoothed Sunspot Number (SSN).

                                                                            From the above results, it is found that the strong correlation
   Fig. 3. Annual variation of Solar Flares with Smoothed Sunspot
                           Number (SSN).                                 is observed for the declining phase of the solar cycle than the
                                                                         uprising phase. This factor is in very well agreement with the
    Fig. 4 shows the variation of the yearly solar indices and its       results available. Also it is observed as an inference that Coronal
comparison with sunspot number, it is observed that mean value           mass ejections and as a result disturbed storm time index is more
of the solar indices is minimal for 2009 with the respective             for the year when the solar flare energy are more with the high
                                                                         smoothed sunspot number for the particular year which is in
values of 0.02 with the maximum indices value as 6.34 for the
year 2014. On the other hand same increasing trend has been              good agreement with other published works.
followed by SSN with the maximum value of 113 for the year
2014 and minimum as 4.8 in 2009.

                                                                                                                                            199
    Institute of Science, BHU Varanasi, India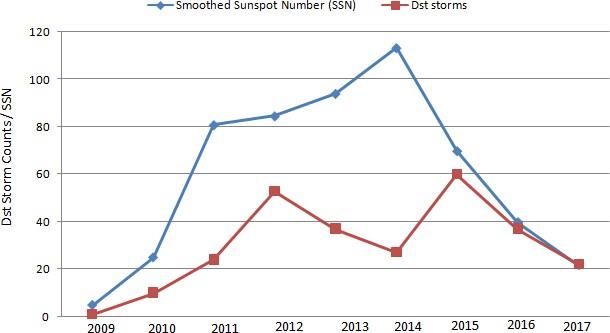
Journal of Scientific Research, Volume 65, Issue 1, 2021

                 SUMMARY & CONCLUSION                                   Hildner, E., Gosling, J.T., MacQueen, R.M. et al. (1976). Frequency of
                                                                            coronal transients and solar activity, Solar Physics, 48, 127–135 .
    Solar Cycle 24 started with minimal activity in the beginning.      Hoyt, D.V., and Schatten, K.H. (1998a). Group Sunspot Numbers: A
2
4The number of occurrence of CME (per year) increases/                      New Solar Activity Reconstruction. Solar Physics, 179, 189–219 .
 decreases with increase/decrease in sunspot numbers, but the           Howard, R. A., Sheeley, N. R., Koomen, M. J., Michels, D. J.
                                                                            ( 1985). Coronal mass ejections: Journal of Geophysical
 variations are different. Coronal mass ejection occurrence rate
                                                                            Research, 90, A9, 8173-8191.
 when compared with the sunspot numbers on the surface of the           Jiang J., Cameron R. H., Schüssler M. (2015). The cause of the weak
 Sun depicts a strong link between them. Kane (2011) in his                 solar cycle 24. The Astrophysical Journal Letters, 808: L28, pp 6.
 findings observed the same inference for the previous period.          Kane, R.P. (2008). Similarities and Dissimilarities between the
 Ramesh & Rohini (2008) and Ramesh (2010) reported that the                 Variations of CME and Other Solar Parameters at Different
 CME ejection occurrence rate was in good agreement with the                Heliographic Latitudes and Time Scales. Solar Physics, 248, 177–
 sunspot area on the surface of the Sun than that with the sunspot          190.
 numbers on the surface of the Sun. Conversely, Kane (2008)             Kane, R. P. (2011). Solar activity during sunspot minimum. Indian
 stated that spot area on the surface of the Sun is strongly                Journal of Radio & Space Physics, 40, 7-10.
                                                                        Ramesh K. B., and Rohini V. S. (2008). 1-8 Angstrom Background X-
 linked with the sunspot nu mb ers on the surface of the Sun. The
                                                                            Ray Emission and the Associated Indicators of Photospheric
 sunspot numbers on the surface of the Sun and astrophysical                Magnetic Activity. The Astrophysical Journal Letters (USA), 686
 change are in good link with coefficient value as 0.98. Year               (1), L41-L44.
 2014, was the maximum solar flare year whereas solar year              Ramesh K. B. (2010). Coronal mass ejections and sunspots—solar cycle
 2009 and 2017 are the minimal solar flare year. Comparison                 perspective. The Astrophysical Journal Letters (USA), 712, L77-
 of the yearly solar indices with sunspot number shows that                 L80.
 mean value of the solar indices is minimal for 2009 with the           Sharma A., and Verma S. R. (2013). Solar Activity during the Rising
                                                                            Phase of Solar Cycle 24. International Journal of Astronomy and
 respective values of 0.02 with the maximum indices value as
                                                                            Astrophysics, 3(3), 212-216.
 6.34 for the year 2014. Same behaviour of occurrence is there
                                                                        Schwabe M. (1844). Sonnen- Beobachtungen im Jahre 1843, Astron.
 smooth sunspot number and Dst storms with some contradiction               Nachr., 21, 233-256.
 due to the variation of Dst occurrence for moderate, intense,          Singh A.K., Bhargawa, A. (2017). An early prediction of 25th solar
 severe storms for the same year.                                          cycle using Hurst exponent. Astrophysics and Space Science, 362,
                                                                           199.
                    ACKNOWLEDGEMENTS                                    Singh, A.K., Bhargawa, A. (2019). Prediction of declining solar
                                                                           activity trends during solar cycles 25 and 26 and indication of
                                                                           other solar minimum. Astrophysics and Space Science, 364, 12.
   The author and the team are grateful to the NASA/GSFC for            Singh, A.K., Siingh, D., Singh, R.P. (2010). Space Weather: Physics,
the      link     (https://omniweb.gsfc.nasa.gov/form/dx1.html).            Effects and Predictability. Surveys in Geophysics, 31, 581-638.
Spaceweatherlive.com was extremely accommodating for the                Spiegel E. A. (1994). In Lectures on Solar and Planetary Dynamos,
real time solar activity to obtain the astrophysical characteristics.       In: Proctor MRE, Gilbert AD, editors. UK: Cambridge University
The LASCO and SOHO data catalogue was helpful to get the                    Press, 245.
                                                                        Vourlidas, A., Buzasi, D., Howard, R. A., & Esfandiari, E. 2002, Solar
coronal mass ejection (CME) data.
                                                                            Variability: From Core to Outer Frontiers (ESA Special
                                                                            Publication), Vol. 506, ed. J. Kuijpers (Noordwijk: ESA), 91‒94.
                           REFERENCES                                   Visakh Kumar U. L.,Varghese B.S., Kurian, P.J. (2017). Relation
                                                                           Between solar wind Parameters, Coronal Mass        Ejections And
Chen, J. (2011). Coronal Mass Ejections: Models and their
6 Observational Basis. Living Reviews Solar Physics, 8 (1), 1-92.          Sunspot Numbers. International Journal Engineering and Applied
Christian, (2018). A statistical analysis of sunspot & CME parameters      Sciences, ISSN: 2394-3661, Volume-4, Issue-9, September.
                                                                        Kunzel, H. (1961) M. Waldmeier: The sunspot‐activity in the years
8 for the solar cycle 2. International Journal of Physics &
   Astronomy, 2 (4), 300‒308.                                              1610‐1960. Zürich 1961: Verlag Schulthess u. Co. AG
Gosling, J. T. (1997). Coronal Mass Ejections : An Overview,            Webb, D.F., and Howard, T.A. (2012) Coronal Mass Ejections:
   Geophysical Monograph Series, 99, 9-16.                                 Observations. Living Review Solar Physics, 9, 3.
Gopalswamy, N. (2006). Coronal mass ejections of solar cycle                                            ***
   23. Journal of Astrophysics Astronomy, 27, 243–254.
Gopalswamy, N., Makela, P., Xie, H., Akiyama, S., Yashiro, S.
   (2009).     CME interactions with coronal holes and their
   interplanetary     consequences.       Journal     of  Geophysical
   Research,114,A00A22,doi:10.1029/2008JA013686.
Hathaway, D. H., Wilson, R. M., Reichmann, E. J. (2002). Group
   Sunspot Numbers: Sunspot Cycle Characteristics. Solar Physics,
   211, 357–370.

                                                                                                                                          200
     Institute of Science, BHU Varanasi, India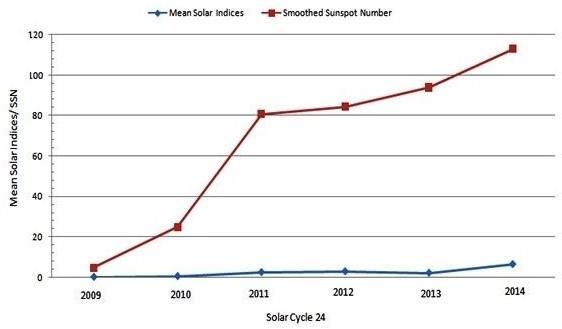
You can also read