Industry Outlook - West Virginia Executive

Page created by Charles Moran
 
CONTINUE READING
Industry Outlook - West Virginia Executive
[ industry ]

IndustryForecasting
         Outlook    West Virginia’s Future
     JENNIFER JETT PREZKOP

   West Virginia’s economic woes have            five years will provide some relief. While      into West Virginia’s population, employ-
been the cause for much concern for several      the state’s economic health will rely heavily   ment, exports and income rates and will
years. With a population that is both aging      on that of the U.S. and the broader global      look at eight specific industries in which
and shrinking, a major drug epidemic             economy, the report forecasts a continua-       the most growth is expected over the next
and the challenges facing the state’s ex-        tion in the state’s emergence from the re-      five years.
traction industry, it’s no wonder the state      cession at a recovery pace of 0.6 percent          Editor’s Note: The information and
faced a $500+ million budget deficit for         per year through 2021.                          graphics in this article have been taken
2017 and is facing an even larger revenue           In order for West Virginians to help spur    from “West Virginia Economic Outlook
shortfall for 2018.                              job and economic growth in the state, it’s      2017-2021,” published in October 2016.
   According to “West Virginia Economic          important to understand where we cur-           For more information or to read the report
Outlook 2017-2021,” published by the             rently are and the challenges we are facing.    in full, visit business.wvu.edu/centers/bu-
West Virginia University (WVU) College           The information in this piece, taken from       reau-of-business-and-economic-research/
of Business and Economics, the slight            “West Virginia Economic Outlook 2017-           economic-outlook.
economic upturn expected over the next           2021,” will provide abbreviated insight

           POPULATION
           Despite the fact that West Virginia gained more than 26,500 residents between 2005-2015, 32 of
           the state’s 55 counties actually registered outright losses in population. The counties that have lost
           population have done so due to natural population decline and/or negative net migration flows.

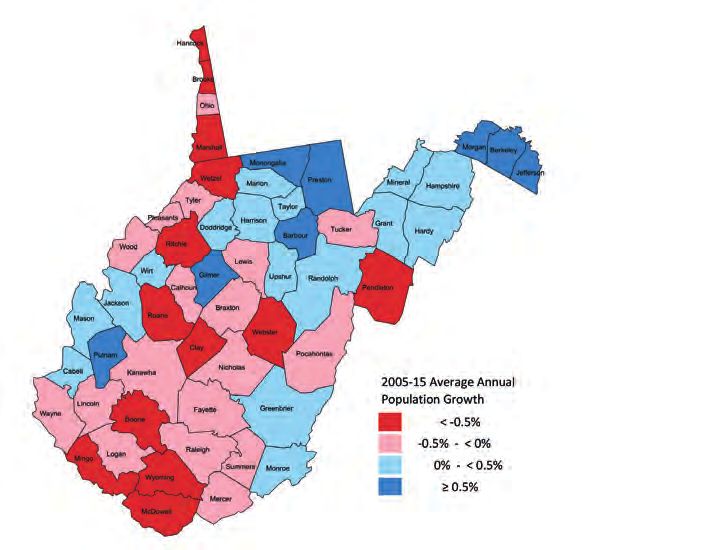
           Over the next five years, 19 counties are expected to see their population numbers remain stable
           or increase during the outlook period. Berkeley, Jefferson and Monongalia counties will be West
           Virginia’s fastest-growing counties at 1.3, 1.1 and 0.9 percent, respectively.

                               Graph 5.1                                                             Graph 5.2
                               Annual Population Growth, 2005-2015                                   Forecast Annual Population Growth,
                                                                                                     2016-2021

                            SOURCE: U.S. Census Bureau                                                  SOURCE: WVU BBER County Econometric Model

76       WEST VIRGINIA EXECUTIVE
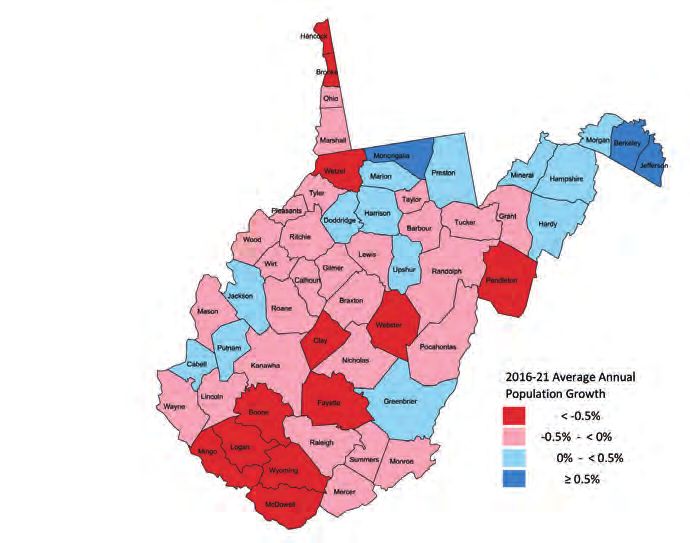
Industry Outlook - West Virginia Executive
EMPLOYMENT
Doddridge County saw the fastest rate of job creation—2.1 percent per year—between 2005-2015.
Monongalia, Berkeley, Lewis and Putnam counties rounded out the top five, and each registered
average annual growth of at least 1.1 percent over the past 10 years.

During the 2016-2021 outlook period, Marshall and Ritchie counties are expected to see the fastest
rates of job growth at roughly 2.4 percent per year. This strong growth will stem in large part from
a rebound in direct hiring and contract labor utilization as producers continue to develop upstream
and midstream natural gas resources throughout the Marcellus and Utica shales. Overall, the
counties expected to enjoy the fastest rates of net job growth over the next five years are generally
situated along the prime areas of known natural gas resources.
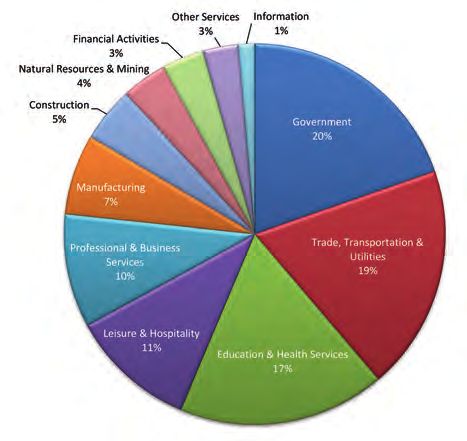
                                                  Graph 2.2
                                    WV Employment Distribution by Sector, 2015

                                             SOURCE: U.S. Bureau of Labor Statistics

                  Graph 5.3                                                                       Graph 5.4
                  Annual Employment Growth,                                                       Forecast Annual Employment Growth,
                  2005-2015                                                                       2016-2021

                    SOURCE: U.S. Bureau of Labor Statistics                                    SOURCE: WVU BBER County Econometric Model

                                                                                       WWW.WVEXECUTIVE.COM             S P R I N G 2 017   77
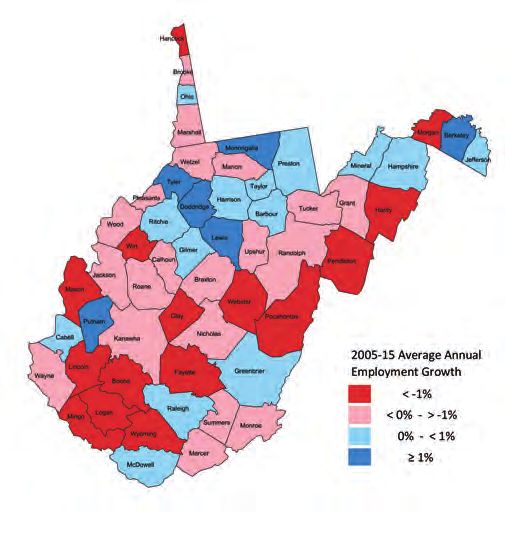
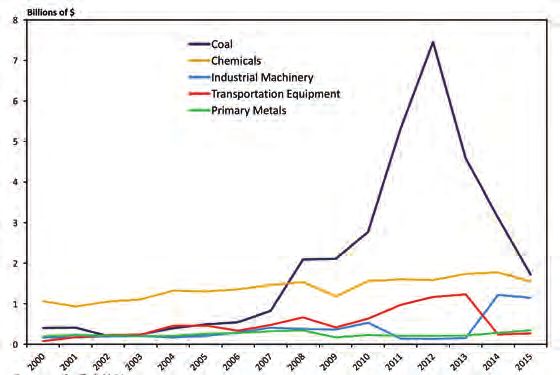
Industry Outlook - West Virginia Executive
EXPORTS
                                       Given the state’s large share of production of globally traded goods and commodities, export
                                       markets have always been an important source of demand for West Virginia. They have accounted
                                       for a growing share of the state’s economic output over the past decade or so and also served to
                                       buoy the state’s economy during the Great Recession.

                                       Export activity deteriorated markedly in the past few years, falling 51 percent from its 2012 peak to
                                       2015. Even with this decline, the dollar value of exports still represented the equivalent of 8 percent
                                       of state economic output in 2015.

                                                                               Graph 2.20                                                                                                       Graph 2.22
                                                                               WV Exports                                                                     Figure 2.22: Top
                                                                                                                                                                      Top 10   10 Export
                                                                                                                                                                             Export      Commodities,
                                                                                                                                                                                    Commodities, 2015 2015
                                                     Figure 2.20: West Virginia Exports
      Billions of $
14
                                                                                                                                                                                                           Export Value      Share of Total West
                                                                                                                                                     Exports Commodity
                                                                                                                 11.9                                                                                     (millions of $)    Virginia Exports (%)
12
                                                                                                                                                     Bituminous Coal                                          1,722                29.6%

                                                                                                           9.6
                                                                                                                                                     Gears and Related Parts                                    527                 9.1%
10
                                                                                                                        9.0                          Flywheels and Pulleys                                      517                 8.9%

 8                                                                                                                            7.7                    Aluminum Alloy Plates                                      206                 3.5%
                                                                                                     7.0
                                                                                                                                                     Civilian Aircraft, Engines, and Parts                      184                 3.2%
                                                                                         6.3
                                                                                                                                    5.8
 6
                                                                                               5.3                                                   Polyamides                                                 181                 3.1%
                                                                                                                                          4.9
                                                                               4.5                                                                   Polysulfides                                               151                 2.6%
                                                 4.0
                                                           3.8       3.8
 4                                                                                                                                                   Artificial Joints, Parts & Accessories                     119                 2.0%
         3.0       2.9       2.9       3.0
                                                                                                                                                     Polyacetals                                                111                 1.9%
 2
                                                                                                                                                     Polyesters (NESOI)                                          98                 1.7%
                                                                                                                                                     All Export Commodities                                   5,815                     -
 0
                                                                                                                                                     Source: US Census Bureau

Source: International Trade Administration
*Note: Data are adjusted for inflation and expressed in 2015 dollars; 2016 is a projection

                                                       SOURCE: International Trade Administration                                                                                     SOURCE: U.S. Census Bureau

                                                           Graph 2.21                                                                                                                            Graph 2.23
                                                 WV Top Five Exporting Industries                                                               Figure 2.23:Top
                                                                                                                                                             TopDestination
                                                                                                                                                                 Destination  Countries
                                                                                                                                                                            Countries      forExports,
                                                                                                                                                                                      for WV   West Virginia
                                                                                                                                                                                                       2015 Exports

                                                                                                                                                                                                      Export Value          Percent change
                                                                                                                                                     Exports Destination Country
                                                                                                                                                                                                     (millions of $)          2012-2015

                                                                                                                                                     Canada                                             $1,755                    -2%
                                                                                                                                                     China                                               $456                    -49%
                                                                                                                                                     Netherlands                                         $401                    -58%
                                                                                                                                                     Japan                                               $325                    -58%
                                                                                                                                                     Brazil                                              $308                    -55%
                                                                                                                                                     India                                               $223                    -70%
                                                                                                                                                     Ukraine                                             $221                    -38%
                                                                                                                                                     United Kingdom                                      $212                    -63%
                                                                                                                                                     Belgium                                             $211                    -36%
                                                                                                                                                     Germany                                             $190                    -45%
                                                                                                                                                     Source: US International Trade Administration

                                                   SOURCE: International Trade Administration                                                                                   SOURCE: International Trade Administration

78                       WEST VIRGINIA EXECUTIVE
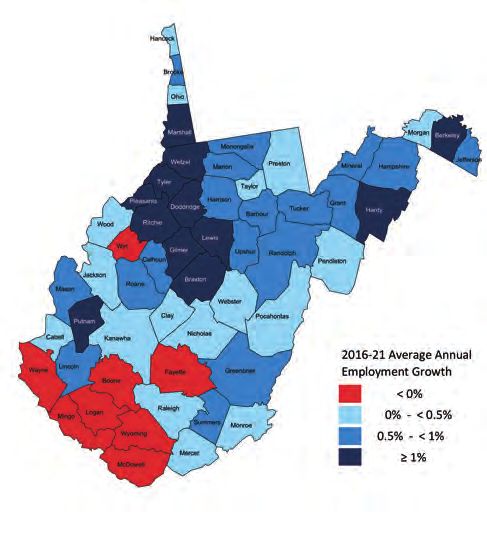
Industry Outlook - West Virginia Executive
8 RISING INDUSTRIES
        According to “West Virginia Economic Outlook 2017-2021,” service-providing sectors will
        experience the most job growth, specifically professional and business services, education and
        health services, leisure and hospitality, trade-transportation and utilities, government, construction,
        natural resources and mining and manufacturing. Here we take a look at these eight rising
        industries and the role they will play in West Virginia’s future.

Professional and Business Services
   In the next five years, the professional and business               transportation companies that provide services to natural
services sector is expected to add jobs at a pace of more              gas rigs and well sites will benefit from the anticipated
than 1.7 percent per year. Much of this growth is expected             growth in drilling activity.
to come from increased contract labor utilization by natural
gas producers and field support services firms, but the gas            Government
industry’s improved prospects should also bolster demand                  Government employment is projected to eke out a minimal
for engineering, legal and other consulting industries.                increase as the structural budget issues facing the state govern-
                                                                       ment will likely limit any potential hiring activity and many
Education and Health Services                                          local governments are dealing with shrinking tax bases and
   Thanks to steadily growing demand for health care,                  a lower level of receipts from coal severance tax allocations.
education and health services will see employment grow
at an average rate of 0.7 percent.                                     Construction
                                                                          The construction sector is expected to get a major boost
Leisure and Hospitality                                                in the coming years. The forecast calls for the sector to grow
   Leisure and hospitality is expected to enjoy job gains of           on average 2.2 percent annually through the end of 2021.
nearly 0.7 percent per year through 2021, with the food                Much of the growth will occur between 2017-2019 as the
services and drinking places sector likely growing faster              energy industry will see several key projects proceed. Recon-
than the accommodation sector.                                         struction in the areas affected by the June 2016 floods will
                                                                       also bolster activity over the next year or so. At the same
Trade-Transportation and Utilities                                     time, major commercial projects as well as several major
   Retail will likely see moderate improvements of 0.3                 projects by WVU will continue to add tens of millions of
percent per year through 2021, while wholesale trade and               dollars more in spending during the next few years. The
transportation and warehousing sectors are expected to see             forecast also calls for single-family housing starts to rise at
job growth proceed at roughly 0.4 percent. In addition,                approximately 6.5 percent per year through 2021.

                                                      Graph 2.13
                                         WV Employment Growth Forecast by Sector

                                  SOURCE: U.S. Bureau of Labor Statistics and WVU BBER Econometric Model

                                                                                          WWW.WVEXECUTIVE.COM          S P R I N G 2 017   79
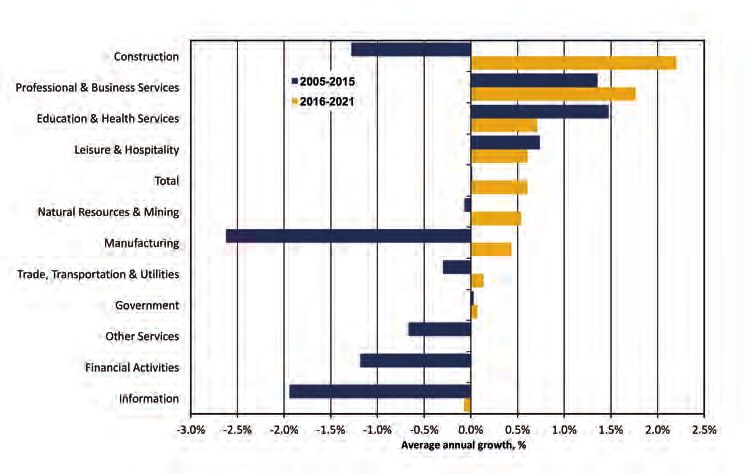
Industry Outlook - West Virginia Executive
NATURAL RESOURCES
                                       AND MINING
                                       The natural resources and mining sector experienced the biggest setback, losing jobs at an
                                       average annual rate of 8 percent in the last three years. Most job losses took place in the coal
                                       mining industry, which contracted at 11.1 percent per year. The oil and natural gas industry, on the
                                       other hand, grew 6.5 percent per year. In the next five years, the sector as a whole is expected
                                       to register a positive job growth of 0.5 percent per year. The coal mining industry will see limited
                                       opportunities for growth. The highly productive thermal coal mines in Northern West Virginia and
                                       lower-cost metallurgical coal mining operations in the state’s southern coalfields will be better
                                       positioned to raise output and bring some idled workers back into the fold. Even with these
                                       moderate improvements, the industry will see employment contract at an average annual rate of
                                       nearly 2 percent per year through 2021.

                                       On the flip side, the oil and natural gas industry is expected to add jobs at a rate of 4.6 percent per
                                       year. Natural gas production will likely rise at nearly 10 percent per year. Production and job growth
                                       will tend to be strongest during the late 2017-2020 timeframe as the price environment improves
                                       in response to new pipeline capacity entering service and allowing stranded supplies from the
                                       Appalachian Basin to reach markets seeing aggressive expansion in gas for electricity generation.
                                       Longer term, prospects for liquefied natural gas (LNG) exports directly from Cove Point, MD, around
                                       2018 will allow shipments of Marcellus Shale gas to flow to European markets where prices are higher.
                                       Furthermore, the recent expansion of the Panama Canal also raises prospects for LNG exports since it
                                       offers enhanced access to Asian markets where overall energy use continues to grow rapidly.

                            Figure 3.2: West Virginia Energy Sector Employment
                                  Graph 3.2 WV Energy Sector Employment                                                                                    Graph 3.4 Natural Gas Production by County
        Coal, Thousands                                                                                    Oil & Natural Gas, Utilities, Thousands
28                                                                                                                                                   10

26
                                                                                             Oil & Gas                                               9

24
                                                        Coal
                                                                                                                                                     8
22

20                                                                                                                                                   7

18                                                                                                                                                   6

16                                                                              Utilities
                                                                                                                                                     5
14

                                                                                                                                                     4
12

10                                                                                                                                                   3

     Source: US Bureau of Labor Statistics; WVU BBER Econometric Model

                SOURCE: U.S. Bureau of Labor Statistics and WVU BBER Econometric Model                                                                       SOURCE: WV Department of Environmental Protection

                        Graph 3.3 3.3
                           Graph  WVWVCoal andand
                                        Coal   Natural GasGas
                                                  Natural  Production
                                                              Output                                                                                      Graph 6.4 Top Destination States for Shipments
170
       Coal Production (Millions of Short Tons, SAAR)                                       Natural Gas Production (Billions of Cubic Feet)
                                                                                                                                               550
                                                                                                                                                           of WV Coal to Electric Utilities, 2008 vs. 2015
160                                                                                                                                            500

                                                                                                                                               450
150
                                                                         Coal                                                                  400
140
                                                                                                                                               350
130
                                                                                                                                               300
120
                                                                                                                                               250
110
                                                                                                                                               200
100
                                                                                                                                               150
                                                        Natural Gas
 90
                                                                                                                                               100

 80                                                                                                                                            50

 70                                                                                                                                            0

                                          SOURCE: U.S. Energy Information Administration
                                                                                                                                                                SOURCE: U.S. Energy Information Administration
                                              and WVU BBER Econometric Model

80                      WEST VIRGINIA EXECUTIVE
Industry Outlook - West Virginia Executive
MANUFACTURING
                         The manufacturing sector contracted at an average rate of 0.6 percent per year in the last five
                         years. The sector, however, is expected to record net job growth over the next five years at a rate
                         of 0.4 percent per year. Manufacturers linked to the U.S. housing market, including furniture and
                         finished wood products producers and certain plastics manufacturers, will enjoy solid growth
                         during the outlook period. Other segments of the sector that should grow steadily over the next five
                         years are food products and auto parts fabricators. 

                    Figure 3.6: Share of Total Manufacturing Employment (2015)
                                                          Machinery                                                   Figure
                                                                                                                   Graph 3.83.8:
                                                                                                                             WVWest Virginia Manufacturing
                                                                                                                                 Manufacturing    Industry Industry Employment
                                                                                                                                                             Employment        Growth
                                                                                                                                                                           Growth     Forecast
                                                                                                                                                                                    Forecast
                                Other Nondurables           4%
                                       6%

                         Other Durables                                                                                Other Nondurables
                               6%
                                                                                                              Wood Products & Furniture
                                                                                   Chemicals
                                                                                                                          Plastics & Rubber
                                                                                     20%
      Nonmetallic Minerals                                                                                                Food & Beverage
             6%
                                                                                                               Transportation Equipment

                                                                                                                             Manufacturing
                                                                                                                                                                                                                                         2005-2015
                                Plastics & Rubber                                                                                 Machinery
                                        7%                                        Wood Products & Furniture                                                                                                                              2016-2021
                                                                                           13%                                     Chemicals

                                                                                                                            Primary Metals
                                    Food & Beverage
                                          8%                                                                         Nonmetallic Minerals

Graph 3.6 Share of                                                                Fabricated Metals                         Other Durables

Total Manufacturing                                                                      11%
                                                                                                                         Fabricated Metals
Employment, 2015                                Primary Metals
                                                     9%
                                                                 Transportation
                                                                   Equipment                                                                   -7%         -6%         -5%            -4%   -3%   -2%     -1%       0%       1%   2%       3%        4%
                                                                      10%                                                                                                                         Average annual growth, %
                                                                                                              Source: US Bureau of Labor Statistics; WVU BBER Econometric Model
SOURCE: U.S. Bureau
                                                                                                                                                         SOURCE: U.S. Energy Information Administration
of Labor Statistics
        Source: US Bureau of Labor Statistics

   Congratulations, Joe Eddy,
                                  on being named a West Virginia Executive Sharp Shooter!

                                                                                                                                                                                  ®
      Proudly Supported By:

                                                                                                                                                           WWW.WVEXECUTIVE.COM                                       S P R I N G 2 017               81
Industry Outlook - West Virginia Executive Industry Outlook - West Virginia Executive Industry Outlook - West Virginia Executive Industry Outlook - West Virginia Executive
You can also read