TRANSPORTATION IMPACT AND IMPLICATIONS OF COVID-19
←
→
Page content transcription
If your browser does not render page correctly, please read the page content below
TRANSPORTATION IMPACT AND
                  IMPLICATIONS OF COVID-19

                                             MAY 2021

Founded in 1971, TRIP ® of Washington, DC, is a nonprofit organization that researches, evaluates and
distributes economic and technical data on surface transportation issues. TRIP is sponsored by insurance
companies, equipment manufacturers, distributors and suppliers; businesses involved in highway and transit
engineering and construction; labor unions; and organizations concerned with efficient and safe surface
transportation.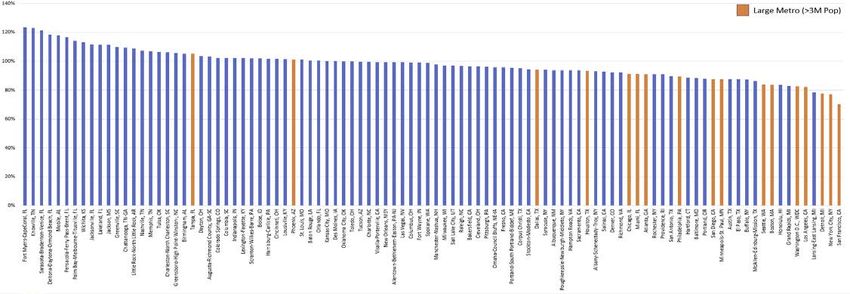
Starting with initial lockdowns in March 2020, the COVID-19 pandemic has had a profound
impact on the U.S. transportation system, including changes in personal and commercial mobility.
These changes in transportation patterns – both during the initial response to COVID-19 and during the
subsequent year of efforts to minimize the spread of COVID-19 while restoring some aspects of daily
life - will likely have significant implications for the nature of the country’s future mobility needs and
the best ways to meet those needs. While the future transportation patterns and needs of a post-
COVID-19 environment will take several years to fully emerge, a review of the initial impact of COVID-
19 on the nation’s mobility patterns is helpful in gaining insights to the future of U.S. transportation
and in determining appropriate future transportation policies.

                                    INITIAL IMPACT OF COVID-19
        Starting in March 2020 the transportation impact of COVID-19 lockdowns was significant, as
most activity was largely curtailed in an effort to slow the spread of the virus. Vehicle travel in the U.S.
by April 2020 was 40 percent lower than in April 2019, but by October 2020 had rebounded to nine
percent lower than October 2019. The decrease of travel by airline or public transit decreased far
more significantly following the start of the pandemic, due to a significant decrease in activity as a
result of stay-at-home orders and an aversion by the public to shared transportation modes that
increased the risk of exposure to the COVID-19 virus. 1

Chart 1. U.S. Travel Trends by Mode January 2020 to October 2020

Source: U.S. Department of Transportation

        The COVID-19 pandemic resulted in a significant increase in the share of Americans who
reported staying at home, and an initial significant decrease in the average number of daily trips taken
by Americans and the average miles of vehicle travel. But, significant signs of recovery were evident by
early Spring 2021.
        Data provided by the Bureau of Transportation Statistics (BTS) indicates that the share of
Americans who said they were staying home and avoiding any trips increased from 21 percent in April
2019 to a peak of 29 percent in April 2020. By March 2021 (the latest month for which data is

                                                                                                               1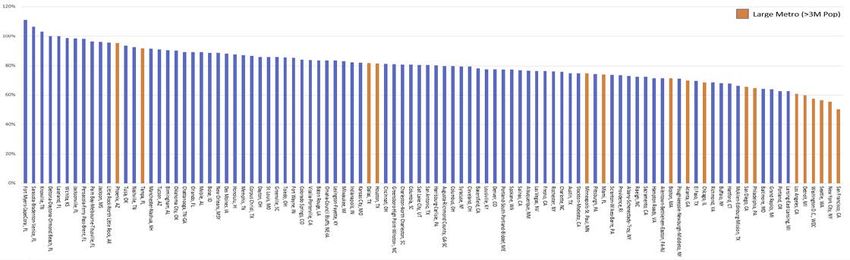
available) the share of Americans who said they were staying home and avoiding trips had decreased
to 22 percent. 2 The report’s appendix includes state-by-state data for the share of the U.S. population
staying home for April 2019, April2020 and March 2021.
        As a result of the increase in the share of Americans staying home or working from home due
to the COVID-19 pandemic, the use of e-commerce, largely for home deliveries, has continued to
increase during the pandemic. During the last quarter of 2019, e-commerce’s share of U.S. retail sales
was 13 percent. E-commerce’s share of U.S. retail sales increased to 15 percent by the second quarter
of 2020 and reached 16 percent by the fourth quarter of 2020, double the eight percent share in
2015.3

Chart 2. E-commerce share of U.S. retail sales in last quarter 2019, second quarter 2020 and fourth
quarter 2020.

Source: U.S. Census Bureau.

        Estimates by BTS also indicate that the total number of daily trips, defined as a trip that
included at least one-destination that resulted in a stop of at least 10 minutes, declined by 38 percent
between April 2019 and April 2020.4 By March 2021, the total number of daily trips had rebounded to
only 12 percent below the number of daily trips taken in April 2019. State-by-state estimates for
average daily trips taken in April 2019, April2020 and March 2021 are provided in the appendix.
        Vehicle miles of travel (VMT) bottomed out in April 2020 at a level 40 percent below April 2019
as a result of the various restrictions implemented due to COVID-19 and the resulting reduction in
commercial and personal travel. 5 By March 2021, vehicle travel in the U.S. had returned to just three
percent below the level of travel in March 2019 (the most recent March not impacted by the COVID-19
pandemic). 6 And in March 2021, vehicle travel in 15 states had surpassed VMT rates in March 2019.
The following chart indicates the states with the highest rate of vehicle travel growth between March
2019 and March 2021.

                                                                                                           2
Chart 3. States with Largest Increase in Vehicle Miles of Travel March 2019 to March 2021
States Exceeding Pre-Pandemic Vehicle Travel -
March 2019 to March 2021
1 Montana 13.3% 9 Utah 3.2%
2 South Dakota 12.7% 10 Tennessee 2.6%
3 Idaho 11.7% 11 Wyoming 1.9%
4 Arizona 9.6% 12 Texas 1.3%
5 Nebraska 7.8% 13 Alaska 0.7%
6 Oklahoma 5.0% 14 Kentucky 0.7%
7 Missouri 4.9% 15 Iowa 0.2%
8 Arkansas 4.3% U.S. Average: - 3%
Source: Federal Highway Administration
State-by-state estimates for vehicle miles of travel in average daily trips taken in March 2019,
March 2020, April 2020 and March 2021 are provided in the appendix.
COVID-19 IMPACT ON TRAFFIC CONGESTION
Analysis by the transportation firm INRIX indicates that, as a result of the COVID-19 pandemic,
weekday traffic congestion patterns have been flattened. By early Spring 2021, evening rush hours had
largely returned to pre-pandemic levels, while morning rush hours continue to be reduced from pre-
pandemic levels and traffic volumes during mid-day remain higher than before the pandemic. In April
2021, INRIX reported that 45 out of 100 large U.S. metro areas had reached or exceeded the pre-
COVID-19 level of trips during the evening rush hour period. 7
Chart 4. U.S. Weekday PM Peak Trips Percent of Pre-COVID-19 by Metro Area (2021).
Source: INRIX
While evening rush hours have returned to pre-COVID levels in nearly half of the nation’s
largest urban areas, morning rush hour traffic levels have returned to pre-COVID levels in just five out
of 100 large U.S. metro areas.
3Chart 5. U.S. Weekday AM Peak Trips Percent of Pre-COVID by Metro Area (2021)
Source: INRIX
INRIX, which has monitored mobility in the U.S. throughout the pandemic, noted in March 2021
that travel in downtown areas has declined the most during COVID-19 and will likely be the slowest to
recover. 8 Travel in suburban and rural areas has largely recovered.
“We expect VMT to continue its gradual return in most major metropolitan areas, just as it has
the last eight months, and most gains will likely be focused on downtowns, as suburbs and rural areas
are already approaching (or have approached) their pre-COVID level of travel,” wrote INRIX’s Bob
Pishue.9
POST COVID-19 FACTORS LIKELY TO IMPACT TRAVEL DEMAND
Steve Polzin, who recently served as a senior advisor at the U.S. Department of Transportation
and previously as the director of Mobility Policy Research at the University of South Florida, wrote in
an April 2021 article for the Institute of Transportation Engineers that transportation policy post-
pandemic will need to be flexible to reflect emerging post-COVID-19 transportation trends. Polzin
anticipates that post-pandemic factors that are likely to impact U.S. travel patterns include reductions
in commuting, business travel, and in-person meetings; increased use of e-commerce and tele-
medicine; and evolving preferences for travel modes due to relative changes in the competitive
attributes of travel options, such as increased auto use due to reduced congestion or additional
parking availability.10
In 2018, five percent of U.S. workers were working from home. 11 By September 2020, workers
in 58 percent of U.S. households that had at least one employed member reported that they had
substituted some or all of their in-person work for tele-work, a share that increased to 62 percent in
March 2021. 12
4Chart 6. Share of U.S. Employees Working from Home (2018), Share of Households with at least One
Employed Member That Had Substituted Some or All in-person Work for Tele-Work (September
2020, March 2021).
Source: U.S. Census Bureau.
Both employers and employees have largely found remote working to be positive and are likely
to support a significant share of work post-pandemic continuing to be from home. A March 2021
survey by PricewaterhouseCoopers found that 83 percent of employers and 71 percent of employees
found remote work had been a success. 13 Moving forward, 68 percent of employers said that they
think having employees in the office three days a week is needed to maintain a strong culture, while 54
percent of employees said they wanted to continue to work from home post-COVID-19.14
The likelihood that remote work will continue to untether a significant share of workers is also
anticipated to result in a significant migration of Americans who, given greater geographic freedom,
will tend to move from areas with higher density and housing costs to areas with lower density and
housing costs.
Based on a survey of approximately 20,000 Americans conducted by Upwork in late 2020 , the
employment firm estimates that approximately 14 to 23 million Americans have moved recently or are
planning to due to the flexibility provided by remote work. 15 The survey found that more than half of
the people (52.5 percent) have or are planning to move to a home that is significantly cheaper, and
that those who have moved or are planning to move are twice as likely to move somewhere that is less
dense and has lower housing costs. The survey also found that the people most likely to move due to
the flexibility provided by remote working are people living in major cities or in suburbs surrounding
major cities. 16
INRIX anticipates that the ability of transit to recover its pre-pandemic ridership level will likely
be reliant on the pace of recovery of downtown districts as employment, entertainment and
residential hubs. “Ultimately, it’s likely that transit ridership, along with VMT ‘recovery,’ will hinge
upon what happens to ’downtowns’ and job centers. While working from home was already
accelerating pre-pandemic, it got an adrenaline boost and appears to be a more permanent commute
option for many. This has likely led to massive reductions in transit ridership, which appears to be tied
to downtown’s recovery, perhaps more so than concern over COVID-19,” notes INRIX’s Bob Pishue. 17
5With the future dimensions of transportation in a post-COVID-19 world likely to take several
years to emerge, deciding on which transportation investments will prove most effective in supporting
quality of life and economic growth will require ongoing analysis of travel, employment, economic,
lifestyle, health and demographic trends.
Emil Frankel, who has served as assistant for transportation policy at the U.S. Department of
Transportation and Commissioner of the Connecticut Department of Transportation, wrote recently
that transportation policy post-COVID-19 will need to be flexible to reflect emerging post-COVID-19
transportation patterns. “We cannot be certain of the nature of the transportation demands and
facilities that will be necessary to enable and support those economic and social changes, and the
altered urban growth patterns that are likely to emerge. However, innovation and flexibility will have
to be essential characteristics of transportation planners, engineers, and executives, as the nation
emerges from its public health and economic crises,” Frankel noted in an article for the Eno Center for
Transportation.
6ENDNOTES
1
United States Department of Transportation (2020). Transportation Challenges Post COVID-19.
22
Bureau of Transportation Statistics (2021). COVID-19 Related Transportation Statistics. COVID-19 Related
Transportation Statistics | Bureau of Transportation Statistics (bts.gov)
3
U.S. Census Bureau (2021). Quarterly Retail E-Commerce Sales, 4th Quarter 2020.
https://www.census.gov/retail/mrts/www/data/pdf/ec_current.pdf
4
Ibid. Additional analysis provided by TRIP.
5
U.S. Department of Transportation (2021). Travel Monitoring. (Additional analysis is provided by TRIP).
https://www.fhwa.dot.gov/policyinformation/travel_monitoring/tvt.cfm
6
Ibid.
7
INRIX (2021). https://inrix.com/blog/2021/04/morning-traffic-still-down-in-major-metro-areas/ Morning
traffic still down in major metro areas - INRIX
8
INRIX (2021). Downtown trips lag metro area recoveries, results in less traffic congestion and transit ridership.
Downtown trips lag metro area recoveries, results in less traffic congestion and transit ridership - INRIX
9
Ibid.
10
Institute of Transportation Engineers (2021). Post-COVID Transportation Trends.
https://www.nxtbook.com/ygsreprints/ITE/ite-journal-april-2021/index.php#/p/36
11
U.S. Census Bureau (2020). 2018 American Community Survey.
https://www.census.gov/acs/www/data/data-tables-and-tools/data-profiles/2018/I.S.
12
Census Household Pulse Survey September 2-14, 2020, March 17-29 2021.
https://www.census.gov/programs-surveys/household-pulse-survey/data.html
13
PricewaterhouseCoopers (2021). It’s Time to Reimagine Where and How Work Will Get Done.
https://www.pwc.com/us/en/library/covid-19/us-remote-work-survey.html
14
Ibid.
15
Upwork (2020). Economist Report: Remote Workers on the Move.
https://www.upwork.com/press/releases/economist-report-remote-workers-on-the-move?utm_medium=email
16
Ibid.
17
INRIX (2021). Downtown trips lag metro area recoveries, results in less traffic congestion and transit ridership.
Downtown trips lag metro area recoveries, results in less traffic congestion and transit ridership - INRIX
7You can also read