Results presentation For the year ended 31 December 2019 - 3 MARCH 2020 - Aggreko plc
←
→
Page content transcription
If your browser does not render page correctly, please read the page content below

3 MARCH 2020

Results presentation
For the year ended 31 December 2019
                                      Results presentation March 2020   1
Introduction
Chris Weston
CEO
               Results presentation March 2020   2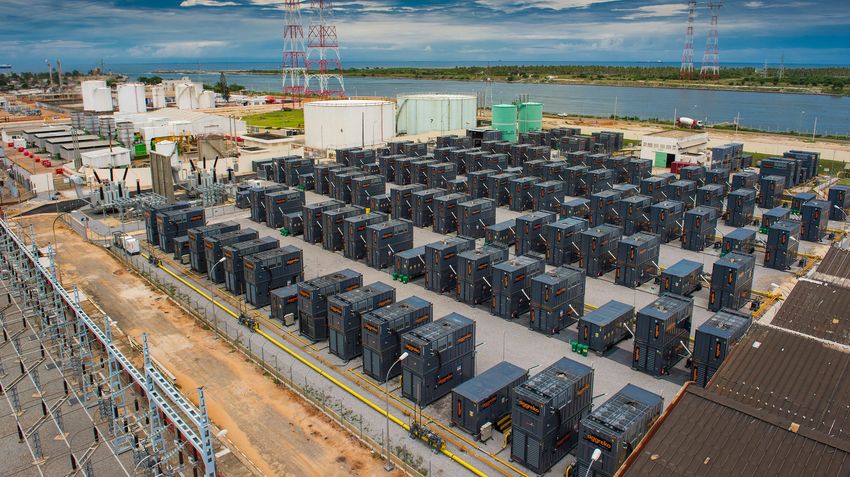
Headlines
Strong profit growth and cash generation, on track to deliver mid-teens ROCE in
2020 and beyond
Strong underlying profit growth of 13%
Significant working capital inflow of £107m
ROCE increased 1.1pp to 11.2%
Final dividend increased 3% to 18.3 pence
Tokyo 2020 preparations progressing as expected
Monitoring the potential impact of coronavirus
Results presentation March 2020 3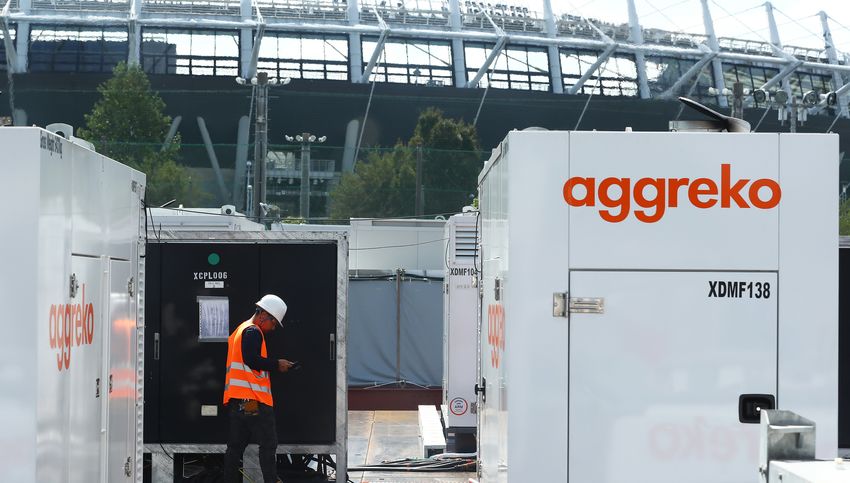
Rental
Solutions
REVENUE
(% OF GROUP excl. pass-through fuel)

53%
OPERATING MARGIN

15.9%         (FY18: 12.9%)

UTILISATION                            22% underlying                         Good growth in            Granny Smith
based on average MW on hire            operating profit growth                North America             operational
                                       Driven by a strong                     Revenue up 5%,            More than 20,000
FY19        58%                        performance in North                   supported by key          solar panels and two
                                       America                                sectors                   Y.Cubes deployed
FY18          62%

                                       Photo: 8MW solar array at Granny Smith gold mine, Australia   Results presentation March 2020   4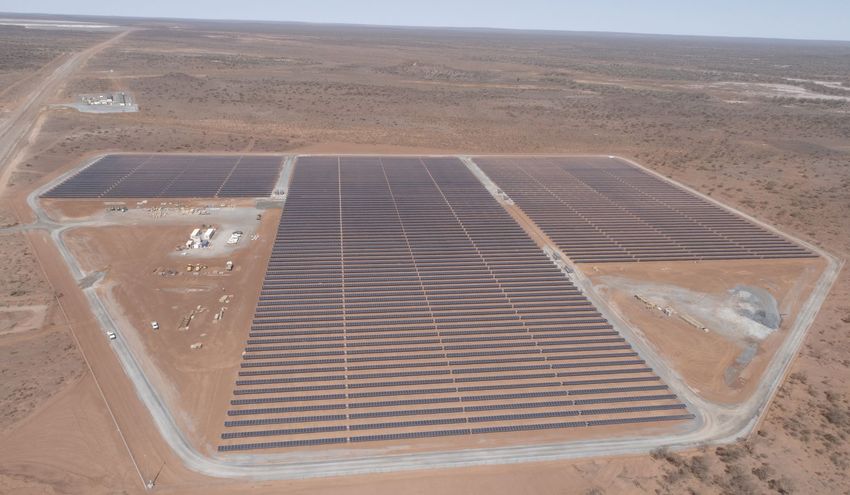
Power Solutions
Industrial
REVENUE
(% OF GROUP excl. pass-through fuel)

27%
OPERATING MARGIN

14.8%         (FY18: 16.6%)

UTILISATION                            Revenue up 6%           excl.         Underlying profit        Tokyo 2020
based on average MW on hire
                                       Winter Olympics & Tokyo 2020
                                       Olympics
                                                                             down 7%                  Olympics
                                       Growth in Africa,                     Driven by Eurasia,       Preparations to
FY19            68%                                                          with slower order        deliver the contract
                                       Middle East and
                                       LAM offset by                         intake and rate          are progressing as
FY18            71%
                                       Eurasia and Asia                      pressure                 expected

                                       Photo: Delivering the 2019 Rugby World Cup in Japan        Results presentation March 2020   5
Power Solutions
Utility
REVENUE
(% OF GROUP excl. pass-through fuel)

20%
OPERATING MARGIN

13.3%         (FY18: 13.4%)

UTILISATION                            21% underlying                         Strong cash collection         New contracts and
based on average MW on hire            operating profit growth                performance                    extensions
                                       Reduced costs and                      Significant progress in        Major contract wins
FY19           65%                     improved operational                                                  to be fully mobilised
                                                                              reducing overdue
                                       performance                            balances                       from 2021, Ivory
FY18           66%                                                                                           Coast extension
                                                                                                             agreed
                                       Photo: Our operations in Ivory Coast                             Results presentation March 2020   6
Well-positioned as energy markets change
Continuing to adapt to
customers’ evolving needs
With growing interest in lower
carbon technology and our new
battery storage product
185MW of hybrid work secured
30 Y.Cubes now under contract
Results presentation March 2020 7Continued focus on our four strategic priorities
Customer focus Technology investment Capital efficiency Expert people
Being particular about the sectors we target Developing competitive configurable products Being mobile & modular Living Always Orange
Offering specialist solutions Smarter use of connected systems & data analytics Getting the very most out of our assets Nurturing our full potential
Being simple to do business with Integrating renewable & storage technology Striving for the most competitive cost base Staying safe and professional at all times
Update on Drivers of growth and returns
strategic priorities Capital allocation policy
August 2020 The opportunity presented by the energy transition
Results presentation March 2020 82019 full year results review
Heath Drewett
CFO
Results presentation March 2020 9Group summary
Movement
CHANGE
excluding
pass-through Good underlying profit growth,
fuel and up 13%
£m FY19 FY18 CHANGE currency
Revenue 1,613 1,760 (8)% (1)% Operating margin of 14.9%, up
1.8pp on an underlying basis
Operating profit 241 219 10% 13%
Operating margin 14.9% 12.5% 2.4pp 1.8pp Effective tax rate of 35%
Net interest expense (42) (37) (13)% ROCE of 11.2%, up 1.1pp on an
Profit before tax 199 182 9% 13% underlying basis
Taxation (70) (57) (23)%
Final dividend up 3% to
Profit after tax 129 125 3% 18.3 pence
Diluted earnings per share 50.7 49.2 3% 6%
Final dividend per share 18.3 17.7 3%
Full year dividend per share 27.7 27.1 2%
ROCE 11.2% 10.3% 0.9pp 1.1pp
Results presentation March 2020 10Strong cash flow
£m FY19 FY18
EBITDA 564 517
Working capital 107 (56) Working capital inflow of £107m
Cash flows relating to fulfilment assets (66) (44) £m FY19 FY18
Cash flows relating to demob provisions (6) (4) Trade and other receivables 78 (10)
Other 29 10 Trade and other payables 21 (60)
Operating cash flow 628 423 Inventory 8 14
Tax (76) (61) Working capital 107 (56)
Net interest (42) (32)
Acquisitions and investments - (33) Fulfilment assets spend increase driven by
Purchase of fixed assets (230) (216) Tokyo 2020
Other fixed asset movements/Lease payments (18) 5
Fleet capex of £189m (2018: £196m)
Free cash flow 262 86
includes £26m related to Tokyo 2020
Dividends (69) (69)
Changes in equity (4) (12) Free cash flow increase of £176m
Net cash flow 189 5
Net debt/EBITDA (incl. IFRS 16 leases) down
Exchange 16 (39) to 1.0x
Movement in lease liability (net of exchange) (103) -
Movement in net debt 102 (34)
Net debt (584) (686) Results presentation March 2020 11Significant progress on working capital
£61m
FY19 FY18
Overall working Decrease in inventory £8m
capital inflow Decrease driven by ongoing inventory initiatives across
of £107m the Group
(2018: £56m outflow)
Decrease in trade and other receivables £78m
Strong cash collection in Power Solutions Utility
Reduced level of unbilled within Rental Solutions
Increase in trade and other payables £21m
Increase driven by deferred revenue for Tokyo 2020 (£52m)
Partially offset by a reduction in fuel creditors due to off-hiring
of major contracts in Brazil
Results presentation March 2020 12Trade receivables
Reduction of £58m, after five years of increases
GROUP TRADE RECEIVABLES (£m)
600 Good progress on cash collections within
Power Solutions Utility
Reduction in the level of Rental Solutions
400 unbilled, with focus now increasing on
collections
200
0
FY15 FY16 FY17 FY18 FY19
RS / PSI trade receivables PSU trade receivables
Results presentation March 2020 13Utility - Invoicing / receipts performance
Good progress on collections, especially in Africa and LAM
POWER SOLUTIONS UTILITY ($m)
200
$m 2H19 1H19 2H18 1H18
Invoicing 240 244 351 362
160
Receipts 289 295 349 345
120 Net total 49 51 (2) (17)
80
Bad debt provision within PSU
broadly unchanged at $81m
40
(Dec 2018: $83m)
0
Q1 18 Q2 18 Q3 18 Q4 18 Q1 19 Q2 19 Q3 19 Q4 19
Invoicing Receipts
Results presentation March 2020 14IFRS 15 - Fulfilment asset progression
Current year increase driven by Tokyo 2020
BALANCE SHEET MOVEMENTS (£m) Capitalised in the period
Capitalised
120 £m 2019 2018
in period
100 66 (24) Burkina Faso 10 -
PIE-A 5 14
80 Amortised 86
to the Granny Smith 3 -
Capitalised income Bangladesh - 11
60 in period statement
(12) 4 Other 30 19
40 44
Amortised Other 44 Sub total 48 44
to the
20 income Tokyo 2020 18 -
statement
Net total 66 44
0 8
Balance at Balance at Balance at
1 Jan 2018 31 Dec 2018 31 Dec 2019
Results presentation March 2020 15Outlook
PBT in line with current expectations
− Currency headwinds of c. 8% (see appendix 4)
− Effective tax rate of c. 35%, subject to geographic mix
Confident of achieving mid-teens ROCE target in 2020 and beyond
− Full year fleet capex £200-£250m
− Further progress on working capital
− Monitoring the potential impact of Coronavirus
Expect another year of good cash generation
Update on our strategic priorities alongside interim results in August
Results presentation March 2020 16Aggreko is a customer focused specialist provider of power,
temperature control and energy services on a global basis.
These services are based on modular and mobile equipment
operated on a digital platform with a market leading
integration capability.
Results presentation March 2020 17Appendix 1 – Rental Solutions
Movement
CHANGE
excluding
FY19 FY18 CHANGE currency
Revenue (£m) 833 822 1% (1)%
Operating profit (£m) 133 105 25% 22%
Operating margin 15.9% 12.9% 3.0pp 2.9pp
ROCE 16.7% 14.7% 2.0pp 1.7pp
Fleet capital expenditure (£m) 71 79
% Revenue by sector FY19
Petrochemical & refining 19%
Building services & construction 18%
Oil & Gas 18%
Utilities 10%
Events 9%
Manufacturing 7%
Mining 6%
Other 13%
Results presentation March 2020 18Appendix 2 – Power Solutions
Power Solutions Industrial Movement Power Solutions Utility Movement
CHANGE CHANGE
excluding excluding
FY19 FY18 CHANGE currency Excluding pass-through fuel FY19 FY18 CHANGE currency
Revenue (£m) 434 424 3% 2% Revenue (£m) 319 342 (7)% (5)%
Operating profit (£m) 64 71 (9)% (7)% Operating profit (£m) 43 46 (7)% 21%
Operating margin 14.8% 16.6% (1.8)pp (1.4)pp Operating margin 13.3% 13.4% (0.1)p 2.9pp
ROCE 10.4% 10.7% (0.3)pp (0.2)pp ROCE 5.8% 6.2% (0.4)pp 1.1pp
Fleet capital expenditure (£m) 69 47 Fleet capital expenditure (£m) 49 70
% Revenue by sector FY19
Oil & Gas 41% This segment includes only Utility customer
Mining 15% projects
Events 13%
Building services & construction 10%
Manufacturing 7%
Utilities 4%
Petrochemical & refining 2%
Other 8%
Results presentation March 2020 19Appendix 3 – Reported to underlying revenue
Movement
£m
FY19 FY18 CHANGE % CHANGE
Reported 1,613 1,760 (147) (8)%
Fuel (27) (172)
Excluding fuel 1,586 1,588 (2) -%
FX¹ 11
Underlying 1,586 1,599 (13) (1)%
¹ The currency impact line included in the table above excludes the currency impact on pass through fuel in PSU, which in 2019 was £5 million
Results presentation March 2020 20Appendix 4 – FX impact into 2020
FX RATES REVENUE (£m)
FY19 restated at
FY19 February FY19 February 2020
average 2020 closing actual closing rates Variance % Variance
US Dollar 1.28 1.30 831 817 (14) (2)%
Euro 1.14 1.20 240 228 (12) (5)%
Australian Dollar 1.83 1.94 72 68 (4) (6)%
Argentinian Peso 61.10 80.09 36 27 (9) (24)%
Brazilian Real 5.03 5.68 86 76 (10) (11)%
Canadian Dollar 1.69 1.72 35 34 (1) (1)%
Russian Rouble 82.61 82.55 70 70 - -
Other 243 234 (9) (4)%
Total revenue 1,613 1,554 (59) (4)%
Total operating profit 241 222 (19) (8)%
Note: UAE Dirhams included within US Dollar as it is pegged to the US dollar; Argentinian Peso includes Power Solutions Utility
contracts which are pegged to the US Dollar but paid and reported in Argentinian Pesos. Results presentation March 2020 21Appendix 5 – ROCE definition
Full year ROCE is calculated by dividing operating profit pre-exceptional items for the year by the average net operating
assets at 1 January, 30 June and 31 December.
FY19 FY18 FY17
£m £m £m
Operating profit (pre-exceptional items, 2017 only) 241 219 224
Average net operating assets
1 January1 2,263 2,074 2,124
30 June 2,190 2,123 2,071
31 December 1,997 2,159 2,074
3-point average 2,150 2,119 2,090
ROCE2 (operating profit pre-exceptional items
divided by average net operating assets) 11.2% 10.3% 10.7%
1 Includes c. £104 million of right of use assets on adoption of IFRS 16 ‘Leases’ from 1 January 2019
2 Prior year ROCE comparatives have not been adjusted for IFRS 16
Results presentation March 2020 22Appendix 6 – IFRS 16: Lease accounting
Effective from 1 January 2019 with NO prior year restatement
Full-year impact:
Income statement
− Improvement in operating profit of c. £3m (including c. £30m additional depreciation in lieu of
operating lease rental cost)
− Increase in interest costs of c. £5m
− Reduction in PBT of c. £2m
Balance sheet
− Increase in fixed assets of £98m, together with a corresponding liability of £101m
Leverage
− Increase in Net debt / EBITDA of c. 0.1x (reflecting incremental debt, but also increased EBITDA)
Return on capital
− Reduction in the Group’s ROCE of c. 0.4pp
Results presentation March 2020 23Appendix 7 – Tokyo 2020
Numbers & timeline What are What we are
we supporting? providing
~ $250m* £26m ~ £20m 550+
contracted Capex Expected capex engineers & staff
revenue in 2019 in 2020 44 Sports
venues
~ 100MW
Demobilise & of capacity
Mobilise & install redeploy
2019-2020
15 JUNE
2020 International ~ 5,400
broadcast centre distribution panels
‘POWER ON’
(IBC)
~ 2,800
transformers
24 JULY – 9 AUGUST
2019-2020 2020
OLYMPIC GAMES
Athletes’
Design: Four Operate 25 AUGUST – 6 SEPT
village
~ 2,500km
iterations PARALYMPIC GAMES of cable
*Includes revenue earned in 2019
Note: For further reference, please see the October 2019 Aggreko events
services presentation on the investor relations website
Results presentation March 2020 24Disclaimer
The information contained in this presentation has largely been extracted from the results announcement for
the twelve months ended 31 December 2019.
This presentation may contain certain “forward-looking” statements. By their nature, forward-looking statements
involve risk and uncertainty because they relate to future events and circumstances. Actual outcomes and results
may differ materially from any outcomes or results expressed or implied by such forward-looking statements.
Any forward-looking statements made by or on behalf of Aggreko speak only as of the date they are made and
no representation or warranty is given in relation to them, including as to their completeness or accuracy or the
basis on which they were prepared.
This presentation is published solely for information purposes.
The distribution of this presentation in jurisdictions other than the UK may be restricted by law and therefore any
persons who are subject to the laws of any jurisdiction other than the UK should inform themselves about, and
observe, any applicable requirements.
All opinions expressed in this presentation are subject to change without notice and may differ from opinions
expressed elsewhere.
Results presentation March 2020 25You can also read