J.P. Morgan Energy Conference - June 18, 2019 Don Marchand, Executive Vice President and Chief Financial Officer - TC Energy

Page created by Felix Rowe
 
CONTINUE READING
J.P. Morgan Energy Conference - June 18, 2019 Don Marchand, Executive Vice President and Chief Financial Officer - TC Energy
J.P. Morgan Energy Conference
June 18, 2019
Don Marchand, Executive Vice‐President and Chief Financial Officer
J.P. Morgan Energy Conference - June 18, 2019 Don Marchand, Executive Vice President and Chief Financial Officer - TC Energy
Forward looking information and non‐GAAP measures
This presentation includes certain forward looking information, including future oriented financial information or financial outlook, which is intended to help
current and potential investors understand management’s assessment of our future plans and financial outlook, and our future prospects overall. Statements
that are forward-looking are based on certain assumptions and on what we know and expect today and generally include words like anticipate, expect, believe,
may, will, should, estimate or other similar words.
Forward-looking statements do not guarantee future performance. Actual events and results could be significantly different because of assumptions, risks or
uncertainties related to our business or events that happen after the date of this presentation. Our forward-looking information in this presentation includes
statements related to future dividend and earnings growth and the future growth of our core businesses, among other things.
Our forward looking information is based on certain key assumptions and is subject to risks and uncertainties, including but not limited to: our ability to
successfully implement our strategic priorities and whether they will yield the expected benefits, our ability to implement a capital allocation strategy aligned
with maximizing shareholder value, the operating performance of our pipeline, power and storage assets, amount of capacity sold and rates achieved in our
pipeline businesses, the amount of capacity payments and revenues from our power generation assets due to plant availability, production levels within supply
basins, construction and completion of capital projects, costs for labour, equipment and materials, the availability and market prices of commodities, access to
capital markets on competitive terms, interest, tax and foreign exchange rates, performance and credit risk of our counterparties, regulatory decisions and
outcomes of legal proceedings, including arbitration and insurance claims, changes in environmental and other laws and regulations, competition in the pipeline,
power and storage sectors, unexpected or unusual weather, acts of civil disobedience, cyber security and technological developments, economic conditions in
North America as well as globally and our ability to effectively anticipate and assess changes to government policies and regulations. You can read more about
these risks and others in our May 2, 2019 Quarterly Report to Shareholders and 2018 Annual Report filed with Canadian securities regulators and the SEC and
available at www.tcenergy.com.
As actual results could vary significantly from the forward-looking information, you should not put undue reliance on forward-looking information and should not
use future-oriented information or financial outlooks for anything other than their intended purpose. We do not update our forward-looking statements due to
new information or future events, unless we are required to by law.
This presentation contains reference to certain financial measures (non-GAAP measures) that do not have any standardized meaning as prescribed by U.S.
generally accepted accounting principles (GAAP) and therefore may not be comparable to similar measures presented by other entities. These non-GAAP
measures may include Comparable Earnings, Comparable Earnings per Common Share, Comparable Earnings Before Interest, Taxes, Depreciation and
Amortization (Comparable EBITDA), Funds Generated from Operations, Comparable Funds Generated from Operations, Comparable Distributable Cash Flow
(DCF) and Comparable DCF per Common Share. Reconciliations to the most directly comparable GAAP measures are included in this presentation and in our
May 2, 2019 Quarterly Report to Shareholders filed with Canadian securities regulators and the SEC and available at www.tcenergy.com.
J.P. Morgan Energy Conference - June 18, 2019 Don Marchand, Executive Vice President and Chief Financial Officer - TC Energy
Our business model
Build or acquire long‐life, critical energy infrastructure
    • Long‐term, secure, low variability income streams
    • World‐class development, procurement and construction
    • Industry‐leading operator – safe, reliable, efficient
    • Maximize customer confidence, satisfaction and value‐for‐money
Finance with long‐term, low cost capital
    • High degree of predictability on largest input cost
    • Lock‐in “spread”
Generate return on and of capital
   • Pay growing, sustainable dividend
   • Sensibly reinvest free cash flow
Repeat

                          Built for all phases of the economic cycle
J.P. Morgan Energy Conference - June 18, 2019 Don Marchand, Executive Vice President and Chief Financial Officer - TC Energy
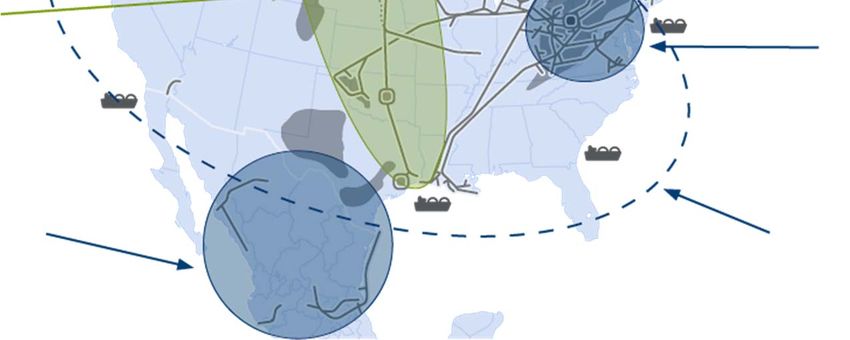
Proven capital allocation framework delivers results

       Produced 14% average annual total shareholder return since 2000
J.P. Morgan Energy Conference - June 18, 2019 Don Marchand, Executive Vice President and Chief Financial Officer - TC Energy
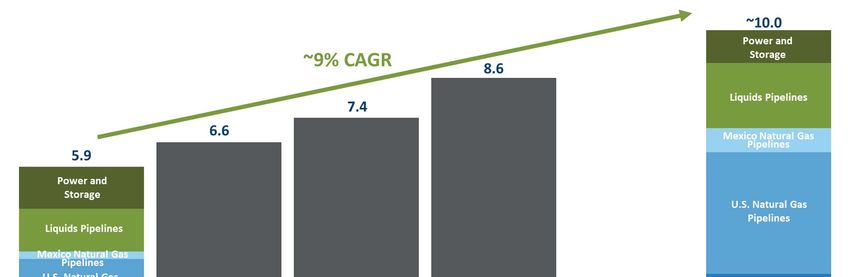
~$95 billion invested since 2000
Billions                                                                         Acquired Columbia      $100B
                                                                                 Pipeline Group and   Total Assets
 $100
                                           Acquired ANR                          Columbia Pipeline
                                           and remainder    Built Keystone and         Partners                         Canadian Natural
                                           of Great Lakes   acquired partner's                                          Gas Pipelines
                                                               50% interest
  $75                                                                                                                   U.S. Natural Gas
                             Acquired                                                                                   Pipelines
                                                    Acquired
                               GTN                 Ravenswood
                                                                                                                        Mexico Natural
                                                                                                                        Gas Pipelines
  $50                  Acquired
                      interest in
                     Bruce Power                                                                                        Liquids
                                                                                                                        Pipelines

         $20B                                                                                                           Power and
  $25 Total Assets
                                                                                                                        Storage

                                                                                                                        Corporate

    $0
      2000                          2005                         2010                       2015              Q1 2019

             Exceptional asset base methodically assembled over past two decades
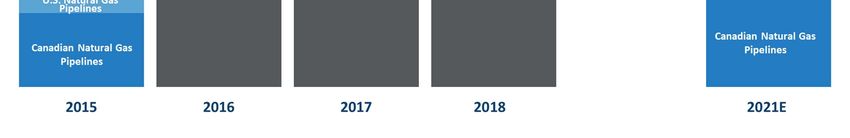
J.P. Morgan Energy Conference - June 18, 2019 Don Marchand, Executive Vice President and Chief Financial Officer - TC Energy
TC Energy today
          One of North America’s largest
          natural gas pipeline networks
                  • 57,500 miles of pipeline
                  • 653 Bcf of storage capacity
                  • 23 Bcf/d; ~25% of continental demand

          Premier liquids pipeline system
                  • 3,000 miles of pipeline
                  • 590,000 Bbl/d Keystone System transports
                    ~20% of Western Canadian exports
          One of the largest private sector
          power generators in Canada
                  • 10 power plants, 6,000 MW*
                  • Primarily long‐term contracted assets
          Enterprise value ~$115 billion

          Delivering the energy people need, every day

* Includes Napanee (under construction)
Portfolio generates high‐quality, long‐life cash flows
 2018 Comparable EBITDA*
                                                                                                                                     Approximately 95% of
                                              4%                                                                                     Comparable EBITDA from
                                       1%                                                Minimal Variability
                                                                                                                                     regulated assets or long‐term
                                                                                                         Regulated
                                                                                                                                     contracts
                                                                                                         Contracted
                                                                                                         Commodity Risk
                                                                                                                                     High visibility to sustained
                                                                                                         Volumetric Risk
                 32%                                                                                                                 EBITDA well into the next
                                      40%                                                                                            decade
                                                            60%
                                                                                                                                     Currency profile of EBITDA now
                                                                                63%
                                                                                                                                     skewed towards U.S. dollars
                                                                                             Currency Profile
                                                                                                       U.S. Dollar Denominated       Virtually all Mexico revenue
                                                                                                       Canadian Dollar Denominated
                                                                                                                                     streams denominated in U.S.
                                                                                                                                     dollars – peso exposure minimal

* Comparable EBITDA is a non‐GAAP measure. See the non‐GAAP measures slide at the front of this presentation for more information.
Advancing $30 billion secured capital program through 2023
                                                                                                                         Estimated                                     Expected
                                                                          Project                                                              Invested to Date*
                                                                                                                        Capital Cost*                              In‐Service Date*
                                           White Spruce                                                                             0.2                     0.2          2019
                                           Sur de Texas**                                                                        US 1.5                  US 1.4          2019
                                           Napanee                                                                                  1.7                     1.7          2019
                                           NGTL System                                                                              2.8                     2.0          2019
                                           Modernization II                                                                      US 1.1                  US 0.5       2019‐2020
                                           Villa de Reyes                                                                        US 0.8                  US 0.7       2019‐2020
                                           NGTL System                                                                              1.8                     0.3          2020
                                           Tula                                                                                  US 0.7                  US 0.6          2020
                                           Other Liquids Pipelines                                                                  0.1                       ‐          2020
                                           Other U.S. Natural Gas Pipelines                                                      US 0.5                       ‐       2019‐2021
                                           Canadian Natural Gas Pipelines Regulated Maintenance                                     1.6                     0.2       2019‐2021
                                           U.S. Natural Gas Pipelines Regulated Maintenance                                      US 1.8                  US 0.1       2019‐2021
                                           Liquids Pipelines Recoverable Maintenance                                                0.1                       ‐       2019‐2021
                                           Non‐recoverable Maintenance                                                              0.7                     0.1       2019‐2021
                                           NGTL System                                                                              2.6                       ‐          2021
                                           Canadian Mainline                                                                        0.3                     0.1       2019‐2022
                                           NGTL System                                                                              1.4                       ‐         2022+
                                           Bruce Power Life Extension**                                                             2.2                     0.7       2019‐2023
                                           Coastal GasLink                                                                          6.2                     0.2          2023
                                           Foreign Exchange Impact (1.34 exchange rate)                                             2.2                     1.1            ‐
                                           Total Canadian Equivalent                                                                  30.3                   9.9

                       Additional $7 billion of projects expected to be completed by the end of 2019
* Billions of dollars. Certain projects are subject to various conditions including corporate and regulatory approvals. ** Our proportionate share.
Secured capital program drives significant growth
                                                                 Comparable EBITDA* outlook ($Billions)

              ~95% of comparable EBITDA* to come from regulated assets or long‐term contracts
* Comparable EBITDA is a non‐GAAP measure. See the non‐GAAP measures slide at the front of this presentation for more information.
Funding program outlook 2019‐2021
        $Billions
            30                                                                                                                                Numerous levers available to fund
                                                                                                Portfolio mgt., DRP & other
                                                                                                   Hybrid securities
                                                                                                                                              Secured Capital Program
                                                                                               Senior debt, commercial
            25
                                                                                                    paper & cash
                                                                                                                                              • Strong, predictable and growing cash
                         Capital program                   Northern Courier sale                                                                flow from operations
                            (including                       Coolidge sale &
            20          development costs                      DRP declared                                                                   • Dividend Reinvestment Plan
                         & maintenance
                              capital)                                                                                                        • Access to capital markets including:
            15                                                                                                                                     • Senior debt
                                                                    Funds                                                                          • Hybrid securities and preferred
                                                                generated from                                                                        shares
            10                                                    operations
                                                                                                                                              • Portfolio management
                         Dividends & NCI
              5            distributions

              0
                                                            On track to achieve targeted credit metrics
                                                            Moving back to historical self‐funding model
Assumes 25% ownership interest in Coastal GasLink, reflecting expected TC Energy equity cash contribution, accounting treatment may differ from this outlook.                          10
Deleveraging while growing per share earnings
        Times                               Debt/EBITDA                                                            Dollars                 EPS
          8                                                                                                             5

                                                                                                                        4
          6
                                                                                                   Target
                                                                                                ‘high fours’            3

          4

                                                                                                                        2

          2
                                                                                                                        1

          0                                                                                                             0
                      2016                  2017                2018*                 2019E                                  2016   2017         2018   2019E

                                              On track to achieve and maintain targeted credit metrics
EBITDA is a non‐GAAP measure. See the non‐GAAP measures slide at the front of this presentation for more information.
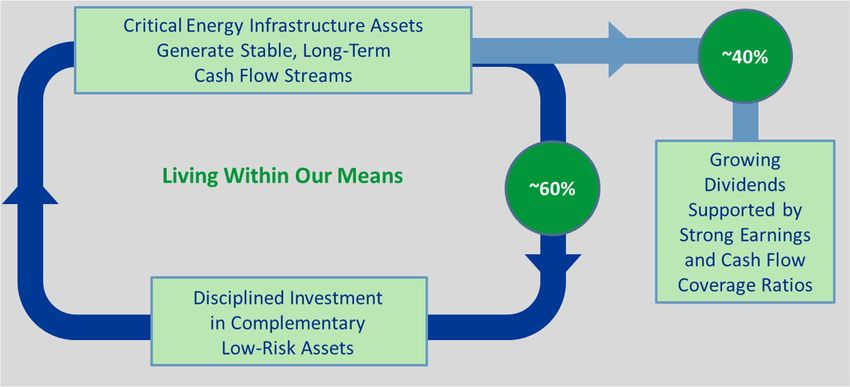
* Using 2018 average foreign exchange rate of 1.30
Long track record of common share dividend growth
          Increased 8.7% in first quarter 2019
          Equivalent to $3.00 per share annually

                                     Supported by expected growth in earnings and cash flow
                                             and continued strong coverage ratios
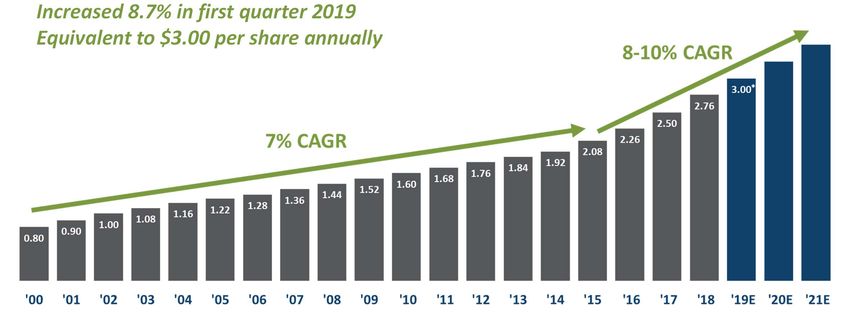
* Annual rate based on most recently declared quarterly dividend of $0.75 per share
Multiple growth platforms that cannot be replicated
             NGTL System                                                      Canadian Mainline
    is uniquely positioned                                                    is a critical conduit to
    over 924 TCF of WCSB                                                      eastern markets
     natural gas resources

                                                                             Bruce Power generates
                                                                             ~30% of Ontario’s power
                  Keystone
corridor provides a direct
    link to world’s largest                                                 Columbia Gas has an
 heavy oil refining market                                                  incumbent position over
                                                                            1,194 TCF of Appalachian
                                                                            natural gas resources

Mexico Natural Gas Pipelines                                            U.S. Natural Gas Pipelines
        forming backbone of                                             connect abundant supply
     country’s infrastructure                                           to key markets

                            Driving $20+ billion of projects under development
                          including Keystone XL and Bruce Power Life Extension
Delivering long‐term shareholder value

      Track                 Visible            Attractive, growing         Strong
      record                growth                  dividend          financial position

14% average annual    $30 billion secured     Dividend raised 8.7%    Numerous levers
 total shareholder         to 2023              in February 2019      available to fund
 return since 2000                                                     future growth
                       Advancing over              4.6% yield
                        $20 billion of                                    Simple,
                     additional projects in   8‐10% expected CAGR      understandable
                        development               through 2021       corporate structure

           Proven resilience through all points of the business cycle
J.P. Morgan Energy Conference
June 18, 2019
Don Marchand, Executive Vice‐President and Chief Financial Officer
You can also read