Look into Alternatives before your clients do - Change your view on Alternativesa - Winston Capital ...

Page created by Tommy Neal
 
CONTINUE READING
Look into Alternatives before your clients do - Change your view on Alternativesa - Winston Capital ...
and you could improve your returns   Change your view on Alternatives

                                                 Look into Alternatives
                                                 before your clients do.
                                                 Financial Adviser Use Only
Look into Alternatives before your clients do - Change your view on Alternativesa - Winston Capital ...
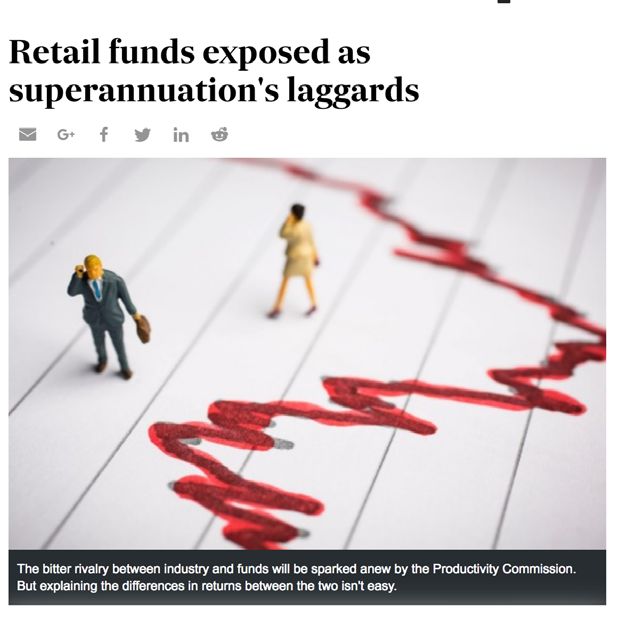
Alternatives aren’t as
alternative as you might think.
                                                                                                                                                                                                        The average Alternative Allocation across

                                                                                                                                                                           30        %
                                                                                      18.1
                                                                                                                                                                                                        Australia’s largest and most popular
 Exhibit 1                                                                                   Sovereign
                                                                                                                                     Fact #1
                                                                                       1.1                                                                                                              Super Funds is more than 30%
 Global alternative assets                                                                   Wealth Funds
 (US$ in trillions) by sector
                                                                                       1.7   Insurers
Who uses alternatives?                                               14.6

                                                                      0.9              2.5   High Net-worth

                                                                      1.5

                                                     10.8             2.0
                                                        0.7
                                                                                       5.6
                                                                                             Mass affluent
                                                        1.2

                                     8.1
                                                        1.5           4.2
                                     0.5                                                                                             Fact #2              More than 10 million Australians have at least 30% of their
                    6.6              1.0                                                                                                                  Superannuation invested in Alternatives
                    0.3
                    0.9              1.1                2.8

                    0.9
                                     1.9
     3.4
     0.1
     0.6
                    1.3
                                                                      6.0
                                                                                       7.2
                                                                                             Pension funds                                                       46%                                      23%                                      37%
     0.4                                                4.5
     0.5                             3.5
                    3.1
     1.7

  2004            2007             2012            2015F            2018F            2020F

Source: Strategy& and PWC - www.strategyand.pwc.com/media/file/Alternative-investments.pdf                   Sources: Rest Annual Report 30 June 2017 https://www.rest.com.au/Document-Library/Publications/Annual-Report/REST-Industry-Super_Annual_Report_2017.pdf
                                                                                                             Australian Super Annual Report 30 June 2017 https://www.australiansuper.com/-/media/australian-super/files/about-us/annual-reports/2017-annual-report.pdf?la=en
                                                                                                             Host Plus Annual Report 30 June 2017 https://hostplus.com.au/-/media/Files/Hostplus/Documents/Annual-Reports/2017/Hostplus-Annual-Report-2017.pdf?la=en

 2    © 2018 Winston Capital Partners and AFSL 469556                                                                                                                                                                          winstoncapital.com.au
Look into Alternatives before your clients do - Change your view on Alternativesa - Winston Capital ...
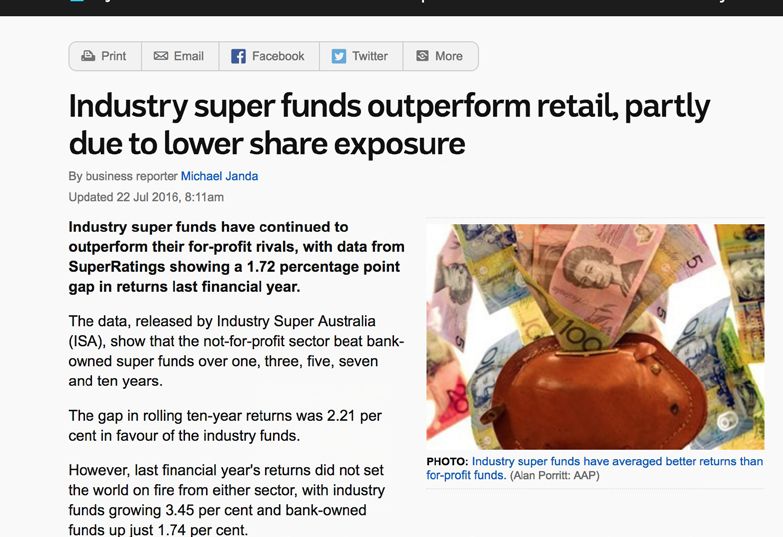
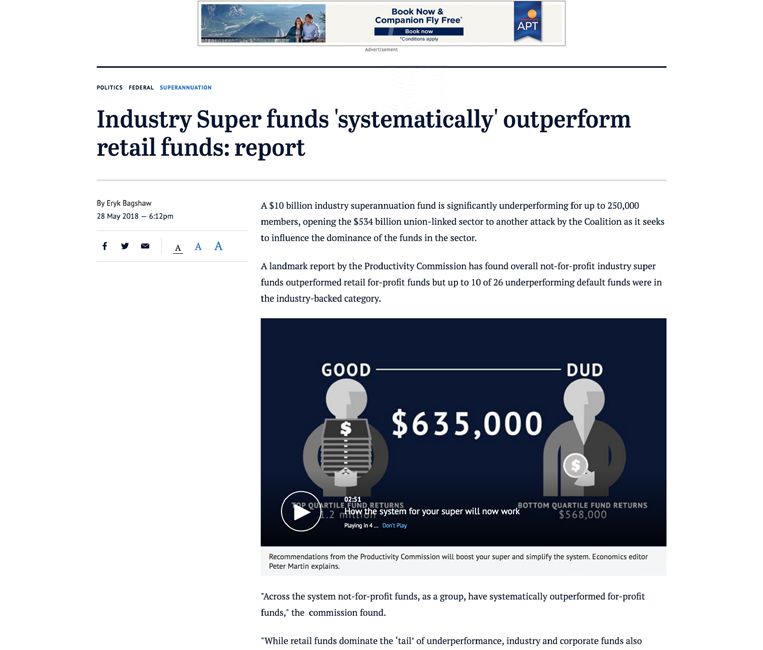
And it has served them well.
Industry funds’ superior diversification has helped them consistently outperform retail funds

Sources: Australian Financial Review http://www.afr.com/personal-finance/superannuation-and-smsfs/retail-funds-exposed-as-superannuations-laggards-20180528-h10m6j
Sydney Morning Herald https://www.smh.com.au/politics/federal/industry-super-funds-systematically-outperform-retail-funds-report-20180528-p4zhy7.html
SuperGuide https://www.superguide.com.au/boost-your-superannuation/industry-funds-retail-funds-performance-comparison
ABC News http://www.abc.net.au/news/2016-07-21/industry-super-funds-outperform-retail-lower-share-exposure/7649306

 3   © 2018 Winston Capital Partners and AFSL 469556                                                                                                                 winstoncapital.com.au
Look into Alternatives before your clients do - Change your view on Alternativesa - Winston Capital ...
The power of true diversification.

                                                                                            Ordinaries TR AUD

                                                                                                                                                      Composite 0+Y TR
                                                                                                                                   Aggregate TR Hdg
                                                                                                                Australia NR AUD

                                                                                                                                                                         Infrastructure TR

                                                                                                                                                                                                           CoreCommodity

                                                                                                                                                                                                                            SG CTA PR USD
                                                                                                                                   BBgBarc Global
                                                                                            S&P/ASX Small

                                                                                                                MSCI World Ex

                                                                                                                                                                                             S&P/ASX 300
                                                                            Ordinaries TR

                                                                                                                                                                                                           CRB TR USD
                                                                            S&P/ASX All

                                                                                                                                                                         S&P Global
                                                                                                                                                      Bloomberg

                                                                                                                                                                                             A-REIT TR

                                                                                                                                                                                                           TReuters/
                                                                                                                                                                         Hdg AUD
                                                                                                                                                      AusBond
                                                                                                                                   AUD

                                                                                                                                                      AUD
 Australian
                          S&P/ASX All Ordinaries TR                          1.00             0.90                0.47                 0.08              -0.31              0.75              0.68            0.08         -0.51
 Equities
                                                                                                                                                                                                                                            •   True Diversification is achieved when
                          S&P/ASX Small Ordinaries TR                                                                                                                                                                                           lowly correlated assets are combined
                                                                             0.90             1.00                0.41                0.09               -0.32              0.72              0.58            0.11         -0.58
                          AUD                                                                                                                                                                                                                   with each other
                                                                                                                                                                                                                                            •   Industry funds have known this
                         MSCI World Ex Australia NR                                                                                                                                                                                             for some time, and their higher
 Global Equities                                                             0.47             0.41                1.00                -0.17              -0.03              0.48              0.44            0.30         0.17
                         AUD
                                                                                                                                                                                                                                                performance is partly explained by
                                                                                                                                                                                                                                                their superior diversification
                         BBgBarc Global Aggregate TR
 Fixed Interest                                                              0.08             0.09               -0.17                1.00                0.60              0.26              0.31           -0.39         0.02             •   Diversification is not achieved when
                         Hdg AUD
                                                                                                                                                                                                                                                large cap Australian equities and are
                                                                                                                                                                                                                                                combined with small cap Australian
                         Bloomberg AusBond Composite                                                                                                                                                                                            equities as the table highlights
                                                                             -0.31           -0.32               -0.03                0.60                1.00             -0.17              0.07           -0.23         0.51
                         0+Y TR AUD
                                                                                                                                                                                                                                            •   Correlations should be judged over
 Property and            S&P Global Infrastructure TR                                                                                                                                                                                           the long term and not over 1 year time
                                                                             0.75             0.72                0.48                0.26               -0.17              1.00              0.65            0.05         -0.49                periods
 Infrastructure          Hdg AUD

                         S&P/ASX 300 A-REIT TR                               0.68             0.58                0.44                0.31                0.07              0.65              1.00            0.08         -0.25

 Commodity
                         TReuters/CoreCommodity CRB
 Index/                                                                      0.08             0.11                0.30                -0.39              -0.23              0.05              0.08            1.00         0.02
                         TR USD
 Commodities

 Managed
                         SG CTA PR USD                                       -0.51           -0.58                0.17                0.02                0.51             -0.49             -0.25            0.02         1.00
 Furtures Index

Source: Morningstar, Foresight Analytics - 10 Year Asset Class Correlations to April 2018

 4    © 2018 Winston Capital Partners and AFSL 469556                                                                                                                                                                                                 winstoncapital.com.au
So, what are Alternatives?
 Exhibit 2                                                                                                                 Alternative investments are those that are
 Global Alternative assets                                                                                                 proven to be lowly correlated with traditional
 (US$ in trillions) by asset class type                                                                                    asset classes like bonds, equities and property
                                                                                                                           over the long term.
How investors are using Alternatives                                                         18.1
                                                                                              0.6    Commodities           They include asset classes such as private equity, commodities, and
                                                                                                     Liquid                precious metals, and alternative investment strategies, where fund
                                                                                              2.1
                                                                                                     Alternatives          managers may invest in traditional assets, but in a different way. For
                                                                                   14.6
                                                                                                                           example, market neutral equities, merger arbitrage, global macro, long
                                                                                                                           term trend following, hedge fund risk premia, momentum and other
                                                                                    0.6       2.4    Institutional Loans   such strategies to generate positive long term returns that are lowly
                                                                                    1.5                                    correlated with traditional assets classes.
                                                                                                                           And the great news for financial advisers is that these strategies are
                                                                10.8                1.8       3.1    Real Estate           now available in liquid forms, that are transparent, and where the fees
                                                                0.5
                                                                                                                           are lower than in the past.
                                                                0.9
                                                                                    2.5                                    When added to a portfolio of traditional assets, alternatives can
                                             8.1                1.1                                                        lower overall portfolio volatility, improve long term returns, lower
                                                                                                                           the drawdowns and smooth the path of returns. These portfolio
                         6.6                0.4
                                            0.6                 1.9                           4.8    Hedge Funds           benefits are important because we know from the behavioural finance
                         0.2                0.7                                                                            literature that if investors experience less volatility, they are more
                         0.3                                                        4.0
                                                                                                                           likely to stay invested during times of market stress, meaning they are
                         0.8                1.4
                                                                                                                           more likely to achieve their long-term investment objectives.
     3.4                 0.7                                    3.2
                                                                                                                           And to be clear, the correlation benefits of adding alternatives,
     0.1                                    2.5
     0.2                 2.1                                                                                               should be measured over the long term – there may be times when
     0.7                                                                                      5.1    Private Equity        correlations rise but this does not diminish their value, as the Industry
     0.3                                                                            4.3
                                                                                                                           Funds’ long term returns can attest too.
     1.1                                                        3.3
                         2.5                2.5
                                                                                                                           The chart on Page 4 shows the 10 year correlations between the
     1.1                                                                                                                   various asset classes, including managed futures, infrastructure and
                                                                                                                           commodities, alongside traditional assets. It is this period in which
     2004              2007               2012                2015F               2018F      2020F                         combining lowly correlated assets should be measured.

Source: Strategy& and PWC - www.strategyand.pwc.com/media/file/Alternative-investments.pdf

 5    © 2018 Winston Capital Partners and AFSL 469556                                                                                                                      winstoncapital.com.au
It’s never been easier for financial
advisers to invest in alternatives.
                                                                                                                                                                                                   WINNER
                                                              CFM has made it simple for financial advisers to access liquid alternative                                                      Alternative Strategies

                                                                                strategies based on empirical data

                                CFM ISTrends – Long Term Trend Following                                                           CFM ISDiversified – Core Alternative Beta Solution

                              Class A                                        Class B                                                       • Volatility – ~6% p.a.     • Daily Priced
                                                                                                                                           • MER 1.30% p.a.            • Multi Strategy
                              •   Volatility – ~10%                          •     Volatility – ~15% p.a.
                                                                                                                                           • 10% Performance Fee       • Multi Asset
                              •   MER 0.80% p.a.                             •     MER 1.425% p.a.
                              •   Performance Fee 10%                        •     Performance Fee 0%
                              •   Daily priced                               •     Daily priced

                                               Long Term Trend Following                                                                         Multi Strategy Alternative Beta

Commodities                         Currencies                 Bonds                       Rates            Equities      Trend                     Equity Market          Alternative                 Universal
• Grains                            • AUD                      • US                        • US             • US          Following 30%             Neutral 30%            Risk Premia 30%             Value 10%
• Base Metals                       • CAD                      • UK                        • Canada         • UK          •   Currencies            •   Value              Universal Carry             • Equities
• Precious Metals                   • CHF                      • Canada                    • Australia      • Canada      •   Bonds                 •   Momentum           • Currencies                • Bonds
• Energy                            • EUR                      • Europe                    • Europe         • Europe      •   Rates                 •   Quality            • Credit                    • Rates
• Softs                             • GBP                      • Australia                 • Japan          • Australia   •   Equities              •   1,500 Stocks       • Equities
• Meats                             • MXP                      • Japan                                      • Japan
                                    • NZD                      • Korea                                      • Korea                                                        Short Volatility
                                    • JPY                                                                   • Hong Kong                                                    • Bonds
                                    • USD                                                                   • Taiwan                                                       • Equities
                                                                                                                                                                           • Currencies
                                                                                                                                                                           • Rates

The above list is provided for information purposes and may change in the future

 6    © 2018 Winston Capital Partners and AFSL 469556                                                                                                                            winstoncapital.com.au
I’d like to know more about what effect
Alternatives could have on my portfolio.
If you have any questions or would like to meet to discuss how advisers are using Alternatives in
their portfolios, please contact any of the relevant Winston Capital BDM’s below:

SA, WA, NT                                                   VIC, TAS                               NSW, ACT, QLD
ANDREW FAIRWEATHER                                           STEPHEN ROBERTSON                      RORY MACINTYRE
Winston Capital Partners                                     Winston Capital Partners               Winston Capital Partners

P +61 401 716 043                                            P +61 418 387 427                      P +61 434 669 524
E andrew@winstoncapital.com.au                               E stephen@winstoncapital.com.au        E rory@winstoncapital.com.au

Look into Alternatives
before your clients do.
Disclaimers

© 2018 FE Money Management. all rights reserved. the information, data, analyses, and opinions contained herein (1) include the                   CFM ISDiversified APIR Code PIM0034AU
proprietary information of FE Money Management and Lonsec (2) may not be copied or redistributed (3) do not constitute investment
advice offered by FE Money Management or Lonsec (4) are provided solely for informational purposes and therefore are not an offer                  The Lonsec Rating (1/6/2017) presented in this document is published by Lonsec Research Pty Ltd ABN 11 151 658 561 AFSL 421
to buy or sell a security (5) are not warranted to be correct, complete, or accurate. FE Money Management and Lonsec shall not be                 445. The Rating is limited to “General Advice” (as defined in the Corporations Act 2001 (Cth)) and based solely on consideration of the
responsible for any trading decisions, damages, or other losses resulting from, or related to, this information, data, analyses, or opinions or   investment merits of the financial product(s). Past performance information is for illustrative purposes only and is not indicative of future
their use. FE Money Management and Lonsec does not guarantee that a fund will perform in line with its Fund Manager of the Year award             performance. It is not a recommendation to purchase, sell or hold Capital Funds Management (CFM), and you should seek independent
as it reflects past performance only. Likewise, the Fund Manager of the Year award should not be any sort of guarantee or assessment of           financial advice before investing in this product(s). The Rating is subject to change without notice and Lonsec assumes no obligation to
the creditworthiness of a fund or of its underlying securities and should not be used as the sole basis for making any investment decision.       update the relevant document(s) following publication. Lonsec receives a fee from the Fund Manager for researching the product(s) using
                                                                                                                                                  comprehensive and objective criteria. For further information regarding Lonsec’s Ratings methodology, please refer to our website at:
                                                                                                                                                  http://www.beyond.lonsec.com.au/intelligence/lonsec-ratings
The Trust Company (RE Services) Limited ABN 45 003 278 831, AFSL 235 150 (“Perpetual”) is the Responsible Entity of, and issuer of
units in, the CFM Institutional Systematic Diversified Trust, and Capital Fund Management LLP (CFM) is the investment manager of the              The Zenith Investment Partners (“Zenith”) Australian Financial Services License No. 226872 rating (assigned 12 Dec 2017) referred to in
fund. This publication is intended only to provide a summary of the subject matter covered. It does not purport to be comprehensive or to         this document is limited to “General Advice” (s766B Corporations Act 2001) for Wholesale clients only. This advice has been prepared
provide legal, taxation or other advice on the subject matter. No reader should act on the basis of any matter contained in this publication      without taking into account the objectives, financial situation or needs of any individual and is subject to change at any time without prior
without first obtaining specific professional advice. The information on this website is general information only and does not constitute         notice. It is not a specific recommendation to purchase, sell or hold the relevant product(s). Investors should seek independent financial
investment or other advice. The content of this website does not constitute an offer or solicitation to subscribe for units in the Fund.          advice before making an investment decision and should consider the appropriateness of this advice in light of their own objectives,
CFM accepts no liability for any inaccurate, incomplete or omitted information of any kind or losses caused by using this information. A          financial situation and needs. Investors should obtain a copy of, and consider the PDS or offer document before making any decision and
product disclosure statement (PDS) for the Fund is available free of charge from www.cfmaltbeta.com.au . The PDS should be considered             refer to the full Zenith Product Assessment available on the Zenith website. Past performance is not an indication of futur performance.
before deciding to acquire, or continue to hold and investment in the Fund. Applications can only be made on the basis of an application          Zenith usually charges the product issuer, fund manager or related party to conduct Product Assessments. Full details regarding Zenith’s
form attached to the current PDS. Figures include GST unless stated otherwise performance figures are after fees and expenses and                 methodology, ratings definitions and regulatory compliance are available on our Product Assessments and at www.zenithpartners.com.
assume reinvestment of income. Past performance is not a reliable indicator of future performance. Neither CFM or Perpetual guarantee             au/RegulatoryGuidelines
repayment of capital or any particular rate of return from the Fund. Neither CFM or Perpetual given any representation or warranty as to
the reliability or accuracy of the information contained on this website. All opinions and estimates including on this website constitute
judgments of CFM and are subject to change without notice. This communication is for wholesale clients use only. Not for retail clients
use or distribution.                                                                                                                              CFM ISTrends APIR Code PIM1966AU

                                                                                                                                                   The Lonsec Rating (11/08/2017) presented in this document is published by Lonsec Research Pty Ltd ABN 11 151 658 561 AFSL 421
                                                                                                                                                  445. The Rating is limited to “General Advice” (as defined in the Corporations Act 2001 (Cth)) and based solely on consideration of the
                                                                                                                                                  investment merits of the financial product(s). Past performance information is for illustrative purposes only and is not indicative of future
                                                                                                                                                  performance. It is not a recommendation to purchase, sell or hold Capital Funds Management (CFM), and you should seek independent
                                                                                                                                                  financial advice before investing in this product(s). The Rating is subject to change without notice and Lonsec assumes no obligation to
                                                                                                                                                  update the relevant document(s) following publication. Lonsec receives a fee from the Fund Manager for researching the product(s) using
                                                                                                                                                  comprehensive and objective criteria. For further information regarding Lonsec’s Ratings methodology, please refer to our website at:
                                                                                                                                                  http://www.beyond.lonsec.com.au/intelligence/lonsec-ratings

                                                                                                                                                  Zenith Disclaimer

                                                                                                                                                  The Zenith Investment Partners (“Zenith”) Australian Financial Services License No. 226872 rating (assigned 06/12/2017) referred to in
                                                                                                                                                  this document is limited to “General Advice” (s766B Corporations Act 2001) for Wholesale clients only. This advice has been prepared
                                                                                                                                                  without taking into account the objectives, financial situation or needs of any individual and is subject to change at any time without prior
                                                                                                                                                  notice. It is not a specific recommendation to purchase, sell or hold the relevant product(s). Investors should seek independent financial
                                                                                                                                                  advice before making an investment decision and should consider the appropriateness of this advice in light of their own objectives,
                                                                                                                                                  financial situation and needs. Investors should obtain a copy of, and consider the PDS or offer document before making any decision and
                                                                                                                                                  refer to the full Zenith Product Assessment available on the Zenith website. Past performance is not an indication of futur performance.
                                                                                                                                                  Zenith usually charges the product issuer, fund manager or related party to conduct Product Assessments. Full details regarding Zenith’s
                                                                                                                                                  methodology, ratings definitions and regulatory compliance are available on our Product Assessments and at www.zenithpartners.com.
                                                                                                                                                  au/RegulatoryGuidelines

Look into Alternatives
before your clients do.
You can also read