Economic development - a flutter on the horses? - Te Waka
←
→
Page content transcription
If your browser does not render page correctly, please read the page content below

Quarterly Economic
               Update Q1 : 2019

                                                                  Blair Keenan
Economic development - a flutter on
                                                                  PRINCIPAL ECONOMIST,
the horses?                                                       WAIKATO REGIONAL
                                                                  COUNCIL & ECONOMIC
                                                                  ADVISOR TO TE WAKA
How do you pick a winner? Is there a
system, or is it just plain luck? Who
amongst us would risk other peoples’                              Blair Keenan has an
money to back the last placed horse                               undergraduate degree
in this picture?                                                  from the University of
                                                                  Otago. Keenan worked at
In many ways, ‘picking winners’ has                               ANZ as a macro-economist
been officially out of fashion since the                          and industry analyst for
1980s, but we all still make choices                              five years before heading
that effectively pick winners – even if                           overseas as a researcher
we don’t like to call it that. Whether it                         for Japan’s External
was think-big, ‘catching the knowledge                            Trade Organisation in
wave’, biotechnology, cycle trails,                               the UK. While in the
tourism or minerals – successive                                  UK, he also received his
governments in New Zealand have all                               Master’s degree in applied
succumbed to picking winners to some                              environmental economics
extent. And if you’re in the business of    How do you know       from the University of
an economic development agency,
how do you know where to direct your        where the best        London and was an
                                                                  economist at the National
attention? How do you know where
the best return is going to be made?
                                            return is going to    Farmers Union of England
                                                                  and Wales.
Are some industries worthy of more
attention than others? And what is the
                                            be made?
                                                                  Back in New Zealand, he
best indicator of likely success?
                                            Are some              held several policy roles
                                                                  at Landcare Research,
IS BIGGER BETTER?
                                            industries worthy     Department of Internal
                                                                  Affairs and Housing New
Large industries have often gotten to
be that way because of some inherent
                                            of more attention     Zealand before his current
                                                                  role as principal economist
advantage that they may have. For           than others?          at Waikato Regional
example, they may be built on some                                Council. He also continues
local comparative advantage; the
largest industry in the Waikato region,
                                            What is the best      to collaborate on projects
                                                                  with the University of
as measured by value-added – is dairy
cattle farming. This reflects, among
                                            indicator of likely   Waikato, CRIs, central and
                                                                  local government, and a
other things, the plentiful supply of       success?              variety of industry groups.
suitable land and a moderate climate.

                                                                                        PAGE 1

   www.tewaka.nz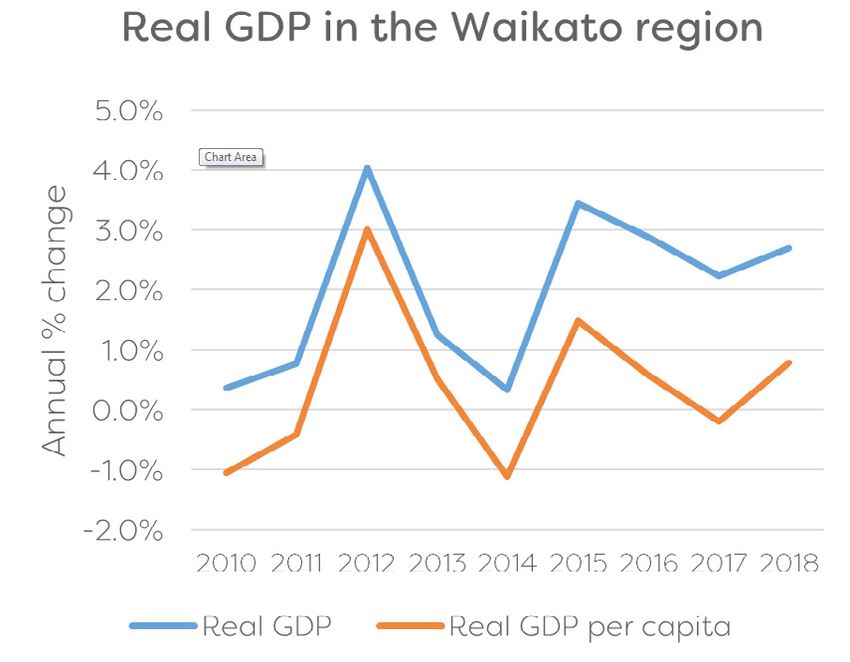
Quarterly Economic Update
Q1 : 2019
So if, up to this point, the size of an industry reflects such It is striking that only four
advantages, might we expect that to be a good predictor
of future success? Table 1 provides a list of the 20 largest of the largest industries
industries in the Waikato region, ranked by their respective
total value added.
appear in the list of the top
Collectively, these 20 industries make up about two-thirds
20 most productive
of Waikato’s gross domestic product. This is certainly not
the only way to measure the ‘size’ of an industry. Another
approach is to look at those that create the most jobs. productivity is an important driver of economic wellbeing
A list based on this measure would have largely the same and potential economic growth (and, indeed, the more
industries – 16 out of the 20 (highlighted green in Table efficient use of resources), perhaps we should consider which
1) would appear in both lists. It is worth noting too, that industries tend to be categorised by higher productivity. The
employment is even more concentrated in these industries – top 20 most productive industries in the Waikato are shown
with the top 20 making up four out of every five jobs in the in Table 2.
region.
Industries that are reliant on capital rather than labour –
GETTING MORE FOR LESS such as mining and utilities – will rank highly by this measure.
Even so, it is striking that only four (highlighted green in
If you combine the two measures of size, you get value Table 2) of the largest industries in the Waikato appear in
added per worker – a measure of productivity. Given the list of the top 20 most productive.
Table 1 Table 2
Waikato top 20 industries by ‘value added’ Waikato top 20 industries by productivity
1. Dairy cattle farming 1. Electricity & gas supply
2. Health care & social assistance 2. Mining
3. Property operators and real estate services 3. Property operators and real estate services
4. Professional, scientific & tech services 4. Beverage & tobacco product manufacture
5. Electricity & gas supply 5. Telecoms, internet & library services
6. Education & training 6. Forestry & logging
7. Wholesale trade 7. Finance
8. Construction services 8. Insurance & superannuation funds
9. Mining 9. Basic chemical & chemical product manufacture
10. Other store & non-store retailing 10. Rental & hiring services
11. Central gov admin, defence & safety 11. Water, sewerage & waste services
12. Accommodation & food services 12. Pulp & paper product manufacture
13. Dairy product manufacturing 13. Dairy cattle farming
14. Heavy & civil engineering construction 14. Primary metal & metal product manufacture
15. Sheep, beef cattle & grain farming 15. Non-metallic mineral product manufacture
16. Road transport 16. Polymer product & rubber product manufacture
17. Other services 17. Heavy & civil engineering construction
18. Finance 18. Sheep, beef cattle & grain farming
19. Machinery & other equipment manufacture 19. Postal, courier & warehousing services
20. Supermarket & specialised food retailing 20. Dairy product manufacture
Source: Infometrics Source: Infometrics
PAGE 2
www.tewaka.nz
Quarterly Economic Update
Q1 : 2019
Given that size and productivity seem to be so different, it
Only four of the most
is worth looking directly at which industries are growing the productive industries are
fastest. These are shown, for the period 2013-18, in Table 3.
among the fastest growing
This list has a lot more in common with the size rankings
than with productivity – 15 of the largest industries also
feature in the fastest growing list, but only four of the most
productive industries are among the fastest growing. Only
Given the strong growth in population in the Waikato
two industries appear on all three lists – property operators
region over the past five years (averaging around 2 percent
& real estate services and dairy product manufacturing
per annum), it should be no surprise that industries driven
(highlighted green in Table 3).
by local consumption have also been growing. But, if
the economic growth is simply a product of a growing
This suggests that the fastest growing industries in the
population, are we really any better off?
Waikato are not necessarily being driven by improving
productivity. Looking at the industries in Table 3, many of
Measuring gross domestic product per capita provides
them – such as property-related or service industries are
a better indication of this and highlights rather modest
strongly linked to population.
performance. Figure 1 shows growth in real GDP, averaging
2.3 percent per year over 2013-2018, and growth in real GDP
per capita, which has averaged just 0.3 percent per year
Table 3 over the same period. That is, over the last five years, nearly
90 percent of GDP growth in the Waikato has been the
Waikato top 20 industries by growth result of more people, rather than improving productivity or
1. Construction services rising real incomes.
2. Health care & social assistance
This is issue is not limited to the Waikato – it can be seen
3. Professional, scientific & tech services across New Zealand as a whole, and indeed, across much of
4. Property operators & real estate services the developed world.
5. Other store & non-store retailing
6. Dairy product manufacturing
7. Accommodation & food services Figure 1
8. Building construction
9. Telecoms, internet & library services
10. Wholesale trade
11. Road transport
12. Central government admin, defence & safety
13. Supermarket & specialised food retailing
14. Machinery & other equipment manufacture
15. Administrative & support services
16. Transport equipment manufacture
17. Motor vehicle, parts & fuel retailing
18. Other services
19. Polymer product & rubber product manufacture
20. Wood product manufacture Source: Infometrics
Source: Infometrics
PAGE 3
www.tewaka.nzQuarterly Economic Update
Q1 : 2019
OUT WITH THE OLD… At the very least, it would be useful to consider whether
there are barriers to entry for high productivity industries;
In the 1950s, the economist Joseph Schumpeter popularised barriers to exit in low productivity industries; and whether
the concept of ‘creative destruction’, whereby new firms, there are institutional arrangements that mask the
technologies, processes or industries emerge and replace incentives created by technology and productivity.
existing ones. This process, which Schumpeter described as
“…the essential fact about capitalism…” is happening all The late Sir Paul Callaghan noted:
the time, with a steady procession of businesses starting up
and closing down. In the Waikato region, for example, there “Our brilliance has been in the
is a ‘churn’ of about 10 percent of firms with a moderate
‘weird stuff’ that the big players
increase over time. On average, new business units make up
about 10% of the population, while closures are about 9%. don’t think to exploit. What we
are good at is a result of brilliant
If we look at the industries in the Waikato region from our
tables above, we might then expect that those with higher entrepreneurship and business
productivity to have more start-ups, while those with lower expertise. Such genius does not
productivity might have more closures. However, we don’t
really see that in the data for the Waikato region, where
follow politicians’ prescriptions.”
there is only a weak relationship between productivity and
start-up/failure rates. So, do we really know what the Waikato’s high productivity
‘weird stuff’ actually is? Who are the high productivity,
There are many confounding factors which might knowledge-based entrepreneurs, firms, sectors and clusters,
influence his analysis – maybe there is indeed a creative big or small, which might be worth our attention and indeed
destruction process going on, we just can’t see it in this our support – if that’s needed?
data. Alternatively, it might well be that the market and/or
institutional arrangements in the Waikato are resulting in a SO, WHAT’S THIS GOT TO DO WITH HORSE
misallocation of resources, with the result that productivity RACING?
and real economic growth is stagnant. Reading these tea-
leaves and deciding (a) whether it matters and (b) what In case you’re still trying to work out which horse you’d back
action to take, if any, is not easy. from the picture at the beginning, here’s a clue: It’s a snap
of the 1983 Melbourne Cup, and the caller at that moment
HORSES FOR COURSES was saying “…and last of all, Kiwi”. But Kiwi was, of course, an
unconventionally trained stayer – and was just the horse for
The moral of the story is that we should be careful about the long Flemington course that day. •
picking winners based on simple high-level indicators of size,
past growth performance, or even relative productivity, and
we need to carefully judge each prospect on its merits. We
need to make sure that whatever scarce public resources
and support we have available, is targeted towards
improving producitivity and value-add per worker. And even
then we should only do this where and when the market is
unable to provide the required rsources itself. Every time we
support/subsidise something which does not achieve this,
or we block resouces from being used for a more productive
use – we prevent creative (destruction) processes from
properly working – and we all become a little bit poorer.
7-021019
PAGE 4
www.tewaka.nzYou can also read