GILAT SATELLITE NETWORKS COMPANY OVERVIEW - NASDAQ, TASE: GILT November 2018 - Leader

Page created by Kathryn Duran
 
CONTINUE READING
GILAT SATELLITE NETWORKS COMPANY OVERVIEW - NASDAQ, TASE: GILT November 2018 - Leader
GILAT SATELLITE NETWORKS
COMPANY OVERVIEW
November 2018

NASDAQ, TASE: GILT
GILAT SATELLITE NETWORKS COMPANY OVERVIEW - NASDAQ, TASE: GILT November 2018 - Leader
FORWARD LOOKING STATEMENTS DISCLAIMER

  Certain statements made in this presentation that are not historical are forward-looking within the meaning of the Private Securities Litigation
  Reform Act of 1995. The words "estimate", "project", "intend", "expect", "believe" and similar expressions are intended to identify forward-
  looking statements. These forward-looking statements involve known and unknown risks and uncertainties. Many factors could cause the
  actual results, performance or achievements of Gilat to be materially different from any future results, performance or achievements that may
  be expressed or implied by such forward-looking statements, including, among others, changes in general economic and business
  conditions, inability to maintain market acceptance to Gilat's products, inability to obtain financing and/or timely develop and introduce new
  technologies, products and applications, rapid changes in the market for Gilat's products, loss of market share and pressure on prices
  resulting from competition, introduction of competing products by other companies, inability to manage growth and expansion, loss of key
  OEM partners, inability to attract and retain qualified personnel, inability to protect the Company's proprietary technology and risks
  associated with Gilat's international operations and its location in Israel. Gilat undertakes no obligation to update or revise any forward-
  looking statements for any reason. For additional information regarding these and other risks and uncertainties associated with Gilat's
  business, reference is made to Gilat's reports filed from time to time with the Securities and Exchange Commission.

  Unaudited/Non-GAAP Financial Measures
  This presentation includes financial data that is not audited and financial data that was not prepared in accordance with U.S. Generally
  Accepted Accounting Principles (GAAP). Non-GAAP financial measures appearing in this presentation consist of GAAP financial measures
  adjusted to exclude, non cash share-based compensation expenses, impairment of goodwill and long lived assets, amortization of acquired
  intangible assets, restructuring, trade secrets litigation expenses, tax expenses under amnesty program, deferred tax benefit that was
  recorded for the first time and other non-recurring expenses and net income or loss from discontinued operations. Gilat believes these non-
  GAAP financial measures provide consistent and comparable measures to help investors understand Gilat’s current and future operating
  performance. However, our non-GAAP financial measures are not meant to be considered in isolation or as a substitute for comparable
  GAAP measures, and should be read in conjunction with Gilat’s consolidated financial statements prepared in accordance with GAAP.
  Additionally, these non-GAAP financial measures may differ materially from the non-GAAP financial measures used by other companies.

2 | Proprietary and Confidential
GILAT SATELLITE NETWORKS COMPANY OVERVIEW - NASDAQ, TASE: GILT November 2018 - Leader
GILAT – BOUNDLESS COMMUNICATIONS

             4G/5G                    2G/3G           Air                Sea                 Land   Consumer              Enterprise

                           MOBILE                                   MOBILITY                         RURAL BROADBAND

       MOST ADVANCED TECHNOLOGY                             END-TO-END SERVICE                      GLOBAL PRESENCE
                  Terrestrial-grade user experience          Most stringent service levels             20 sales offices

                          Established 1987                  NASDAQ / TASE: GILT                      ~1,100 employees

3 | Proprietary and Confidential
GILAT SATELLITE NETWORKS COMPANY OVERVIEW - NASDAQ, TASE: GILT November 2018 - Leader
BOOMING CAPACITY – GEO + LEO/MEO
             Global HTS Bandwidth Supply, Demand and Price per Mbps
$/Mbps/Month                                                                                     Gbps
     1,000                                                                                       10,000
                                                                                                 20,000

       900                                                                                       18,000
                                                                                                 9,000
                                    ~16 times today
       800                                                                                       16,000
                                                                                                 8,000

       700                                                                                       14,000
                                                                                                 7,000

       600                                                                                       12,000
                                                                                                 6,000
                                                                                                           ABUNDANCE
       500                                                                                       10,000
                                                                                                 5,000
                                                                                                           OF CAPACITY
       400                                                                                       8,000
                                                                                                 4,000      UNLOCKS
       300                                                                                       6,000
                                                                                                 3,000
                                                                                                          NEW MARKETS
       200                                                                                       4,000
                                                                                                 2,000

       100                                                                                       2,000
                                                                                                 1,000

         -                                                                                       0
               2011 2012 2013 2014 2015 2016 2017 2018 2019 2020 2021 2022 2023 2024 2025

                          GEO-HTS
                 GEO-HTS Global    Global Demand
                                Demand                      GEO-HTS Global
                                            GEO-HTS Global Supply          Supply
                                                                     Weighted Avarage GEO-HTS Price
                              Non-GEO HTS Global Supply     Weighted Avarage GEO-HTS Price

  Source: Euroconsult, NSR, 2017

 4 | Proprietary and Confidential
GILAT SATELLITE NETWORKS COMPANY OVERVIEW - NASDAQ, TASE: GILT November 2018 - Leader
AFFORDABLE INTERNET EVERYWHERE
  IS BECOMING A “BIRTH RIGHT”

                  WE ALL WANT BROADBAND     WE ALL WANT BROADBAND             SATELLITE DELIVERS
                 Everywhere. Anytime. Affordable.
                                          Everywhere. Anytime.Affordable,
                                                               Affordable.Plentiful, Terrestrial-grade User Experience

                                                                      Mobile            Mobility         Broadband

5 | Proprietary and Confidential
GILAT SATELLITE NETWORKS COMPANY OVERVIEW - NASDAQ, TASE: GILT November 2018 - Leader
ACCELERATING CONNECTIVITY – GROWTH AREAS

                         Mobile                Mobility                      Broadband

       Cellular Backhaul,                                                   Broadband to the
                                    In the Air, at Sea, on the Ground
Network Resilience, Public Safety                                       Unserved and Underserved

6 | Proprietary and Confidential
GILAT SATELLITE NETWORKS COMPANY OVERVIEW - NASDAQ, TASE: GILT November 2018 - Leader
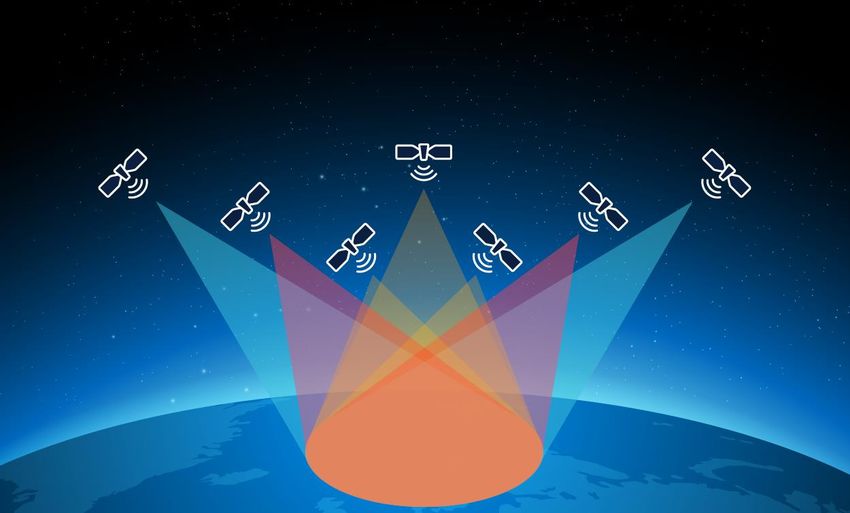
LEADING THE FAST GROWING SATELLITE BACKHAUL MARKET

             Satellite Backhaul Market

                            $3,300M         “Gilat continues to unlock new opportunities
                                   (2027)    and capture a bigger share of the pie…”

                                             Source: NSR, April 2018

                               $790M
                                   (2017)

7 | Proprietary and Confidential
GILAT SATELLITE NETWORKS COMPANY OVERVIEW - NASDAQ, TASE: GILT November 2018 - Leader
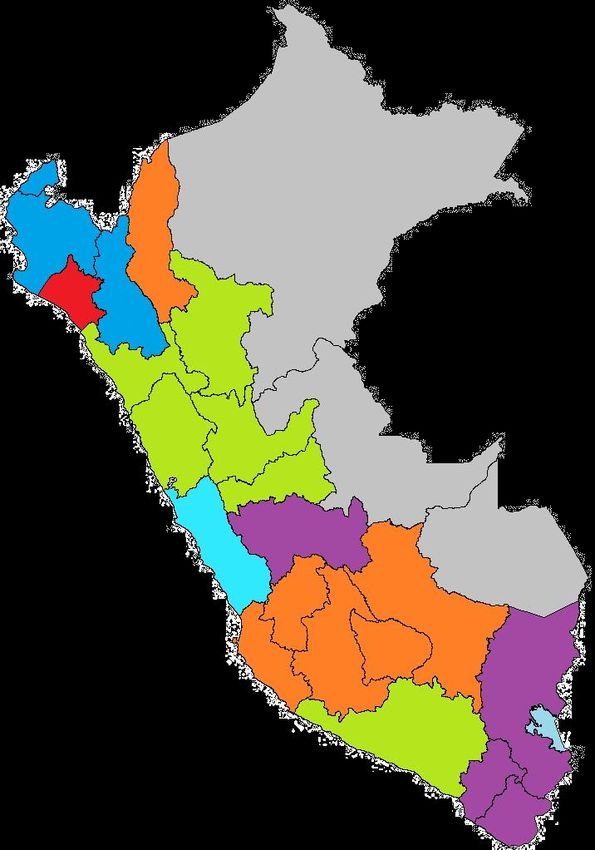
MOBILE / BACKHAUL HIGHLIGHTS

      Focus on developed markets
      o North America, Japan, Australia, Europe

      Above average gross margin

      Long term deals
      o Providing recurring revenues

8 | Proprietary and Confidential
GILAT SATELLITE NETWORKS COMPANY OVERVIEW - NASDAQ, TASE: GILT November 2018 - Leader
METRO AREA - A LIVE EXMPLE

9 | Proprietary and Confidential
GILAT SATELLITE NETWORKS COMPANY OVERVIEW - NASDAQ, TASE: GILT November 2018 - Leader
MOBILITY – SUPERIOR PASSENGER EXPERIENCE DRIVES DEMAND
                                                           Satellite Broadband Connected Aircrafts

                                         Commercial Aircrafts                                    Business Aircrafts

                                              27,800                                                  8,800
                                               (2027)                                                  (2027)

                                              5,200                                                    500
                                               (2017)                                                  (2017)
Source: EuroConsult, July 2018                                                                                  Source: EuroConsult, July 2018

     10 | Proprietary and Confidential
Expanding to IFC antennas with Leading
                                     Performance Solutions

                             Dual Band                          400Mbps
                             Ku/Ka Antenna                      Modem
                             ESA/PAA

                             Ku and Ka
                             Transceivers

11 | Proprietary and Confidential
MOBILITY / IFC HIGHLIGHTS

         While we continue to grow with Gogo:
         o Growing backlog, now >2,200 airplanes to be connected with Gilat

         Dual-band Ku/Ka terminal
         o Passed DO-160
         o Commercially available

         ARE
         o Making progress with domestic airlines in China
         o Based on Gilat’s dual-band Ku/Ka terminal

         Business Aviation
         o A significant opportunity – over 35,000 airplanes
         o Complete offering – modem, antenna and transceiver

12 | Proprietary and Confidential
BROADBAND / HTS HIGHLIGHTS

         Gazprom
         o Providing broadband connectivity across Russia over new satellite (Yamal 601 Ka)
         o Current phase: ~ $18M for activating third of the satellite capacity

          CS-18
          o Extending satellite coverage throughout China with new satellite – CS-18
          o Gilat is the sole solution to China’s HTS Ka (CS-16 & CS-18)

          Hispasat
          o Extending agreement to include Brazil on top of Mexico
          o Over Amazonas 3 and 5 Ka-band HTS

          JSAT
          o Delivering wide range of mobility and fixed broadband applications in Japan

         NBN progress
         o Connecting nationwide businesses and enterprises in regional and rural Australia
13 | Proprietary and Confidential
NGSO IS MATERIALIZING

                                                                                    O3b mPOWER

         882 LEO satellites          292 LEO satellites    >10,000 LEO satellites   7 MEO satellites

                                                                                                            GEO
                                    GEO                                                                35,786 km
                                            MEO                                                          MEO
                                                                                              2,000-10,000 km
                                                          LEO
                                                                                                         LEO
                                                                                                 500-2,000 km

14 | Proprietary and Confidential
NGSO IS MATERIALIZING

         Several constellations in advanced stages: SpaceX, OneWeb, Telesat, mPower

         Gilat involved in a number of them

         Opportunity is both baseband as well as ESA antennas
         o Telesat/GEE IFC demo

15 | Proprietary and Confidential
SECURING TECHNOLOGY LEADERSHIP IN THE LONG RUN

            >$30M/year R&D budget (above sector average)

            Over 300 engineers

            Over 100 Patents

            5 R&D centers (Israel, USA, Bulgaria, Moldova, Singapore)

                                          Pioneering Next Generation Solutions

                 GEO
                           MEO
                                    LEO

           GEO/MEO/LEO Networks                       Satellite for 5G   Electronically Steered Antennas
16 | Proprietary and Confidential
BROADBAND / PERU HIGHLIGHTS

         Reduced 2018 projections due to
         slower than expected progress

         Our main interest is not the construction but
         recurring maintenance revenue

         Plan is to complete first 4 regions in 2019
         and move to operations

         Target is profitable recurring revenues run rate
         of >$50M/year from 2020

17 | Proprietary and Confidential
FINANCIAL
   INDICATORS
   AND ANALYSIS

18 | Proprietary and Confidential
2018 UPDATED GUIDELINES AND OUTLOOK – INCREASED PROFITABILITY
  US$ MILLIONS

                                                                  Revenues
                                                         w/o Terrestrial Infrastructure
                                      Revenues              $242M-$248M ($204.5M)
                                                                18%-21% YoY
                       $265M-$275M ($282.8M)
                                                         Mobility Solutions Revenues
                                    (3%)-(6%) YoY
                                                                  Mainly IFC

                                                             $98M-$100M ($88.4M)
                                                                11%-13% YoY

                                    Adjusted EBITDA            Operating Profit

                                    $35M-$37M ($26.2M)      GAAP $22M-$24M ($10.9M)
                                       34%-41% YoY        Non GAAP $26M-$28M ($18.5M )

19 | Proprietary and Confidential
EXECUTING PROFITABLE GROWTH STRATEGY
   Updated 2018 Management Objectives (US$ millions)

                         Annual Revenues                            Adjusted EBITDA         GAAP Operating Profit

                   279.6            282.8   265-275                               35-37
                                                                                                              22-24
                                                                         26.2
                                                             19.2
                                                                                                     10.9

                                                                                            0.8

                  2016              2017    2018E            2016        2017    2018E     2016     2017     2018E

                                                          Revenues: $265M - $275M

                                                      GAAP Operating Profit: $22M - $24M

                                                        Adjusted EBITDA: $35M - $37M
20 | Proprietary and Confidential
GILAT REVENUES & TERRESTRIAL INFRASTRUCTURE BREAKDOWN
   US$ millions

                                    $280M               $283M
                                                                              $265M-$275M
                                                                               $23M-$27M
                                                        $78M
                                    $92M

                                                                              $242M-$248M
                                    $188M               $205M

                                    2016                2017                     2018E

                                            Satellite    Terrestrial Infra.

21 | Proprietary and Confidential
YEARLY REVENUE PER SEGMENT
   US$ millions

                                    $280M               $283M
                                                                                      $265M-$275M
                                                                                       $23M-$27M
                                                         $78M
                                    $92M

                                                                                      $98M-$100M

                                    $63M                 $88M

                                                                                      $144M-$148M
                                    $125M               $116M

                                     2016                 2017                           2018E

                                            Fixed   Mobility     Terrestrial Infra.

22 | Proprietary and Confidential
Q3 2018 PROFIT AND LOSS HIGHLIGHTS
      US$ MILLIONS
                                                             Revenues                         Gross Profit
                                                    w/o Terrestrial Infrastructure            GAAP 39% (29%)
                                                          $56.8M ($48.5M)                   Non GAAP 39% (31%)
                                                              17% YoY
                               Revenues                                                           OPEX
                                                                                           GAAP $18.2M ($17.0M)
                                                      Fixed Networks Revenues             Non GAAP $18.0M ($16.7M)
                        $62.8M ($69.9M)                    $34.9M ($29.6M)
                           (10%) YoY                           18% YoY                      Operating Profit
                                                                                            GAAP $6.0M ($3.3M)
                                                    Mobility Solutions Revenues            Non GAAP $6.5M ($4.9M)
                                                             Mainly IFC                    Operating Margin
                                                          $21.8M ($18.9M)                      GAAP 10% (5%)
                                                              16% YoY                        Non GAAP 10% (7%)

                                       Net Profit
                                                                                     Adjusted EBITDA
                                 GAAP $8.7M ($2.1M)
                                                                                      $9.1M ($7.1M)
                                Non GAAP $5.1M ($3.6M)

*) Q3-18 (Q3-17)
   23 | Proprietary and Confidential
QUARTERLY PROFIT AND LOSS HIGHLIGHTS
   US$ MILLIONS, EXCEPT PER SHARE DATA
   GAAP                                                                                                                       Q3 17                            Q4 17                         Q1 18   Q2 18   Q3 18
   Revenues                                                                                                                      69.9                            82.7                        67.4    66.5    62.8
   Gross Profit                                                                                                                  20.3                            25.2                        21.4    22.4    24.2
   Gross Margin                                                                                                                  29%                             31%                         32%     34%     39%
   R&D net                                                                                                                        6.9                              8.2                        8.0     7.9     8.2
   S&M                                                                                                                            5.8                              6.6                        5.4     6.3     5.5
   G&A                                                                                                                            4.3                              5.0                        4.3     4.1     4.6
   Other expenses (income)*                                                                                                          -                           (0.2)                         -       -       -
   Operating income                                                                                                               3.3                              5.6                        3.7     4.1     6.0
   Net income (loss)                                                                                                              2.1                              3.4                        2.3     2.2     8.7
   Diluted EPS                                                                                                                   0.04                            0.06                        0.04    0.04    0.16
   Non-GAAP**
   Gross Margin                                                                                                                  31%                             32%                         34%     36%     39%
   Operating Income                                                                                                               4.9                              7.0                        5.1     5.7     6.5
   Net income                                                                                                                     3.6                              4.7                        3.8     3.7     5.1
   Adjusted EBITDA                                                                                                                7.1                              9.0                        7.5     8.1     9.1
    * Include tax amnesty and trade secrets litigation expenses
   ** Adjustments reflect the effect of non-cash stock based compensation as per ASC 718, amortization of intangible assets related to shares
       acquisition transactions, impairments, restructuring costs, trade secrets litigation expenses, tax expense under amnesty program and first time recognition of deferred tax benefit
24 | Proprietary and Confidential
BALANCE SHEET HIGHLIGHTS
    US$ MILLIONS

               Cash and equivalents1                                                               DSO2              Total Assets
                  $103.3 ($95.8)                                                              73 days (64 days)     $391.3 ($371.8)

                Cash From Operation
                                                                                                 Total Debt       Shareholders equity
                   $9.6M increase
                                                                                                $12.7 ($12.8)      $233.5M ($223.1M)
                  ($7.6M decrease)

 1) Including cash and cash equivalents, restricted cash and net of short term bank credits
 2) DSO calculation excludes Terrestrial Infrastructure Projects Segment
 3) Q3-18 (Q2-18)

25 | Proprietary and Confidential
IN SUMMARY – UNIQUELY POSITIONED FOR UNLOCKING OPPORTUNITIES

                          Oversupply of capacity unlocks new markets

                                    Demand for plentiful affordable broadband,
                                    anywhere anytime, is soaring

                                         Leading in the main growth areas –
                                         Mobile Backhaul & IFC Mobility

                                              Product leadership and innovation

                                                   Focused on strategy execution and profitability

26 | Proprietary and Confidential
THANK YOU
Gilat Satellite Networks | info@gilat.com | www.gilat.com
You can also read