Golden Agri-Resources Ltd (GAR) - Interim Performance Presentation Half year ended 30 June 2021
←
→
Page content transcription
If your browser does not render page correctly, please read the page content below
www.goldenagri.com.sg

Golden Agri-Resources Ltd (GAR)
Interim Performance Presentation
Half year ended 30 June 2021
13 August 2021
Disclaimer

This presentation has been prepared by Golden Agri-Resources Ltd. (“GAR” or “Company”) for informational purposes, and
may contain projections and forward looking statements that reflect the Company’s current views with respect to future
events and financial performance. These views are based on current assumptions which are subject to various risks and
which may change over time. No assurance can be given that future events will occur, that projections will be achieved, or
that the Company’s assumptions are correct. Actual results may differ materially from those projected. A prospective investor
must make its own independent decision regarding investment in securities.
Opinions expressed herein reflect the judgement of the Company as of the date of this presentation and may be subject to
change without notice if the Company becomes aware of any information, whether specific to the Company, its business, or
in general, which may have a material impact on any such opinions.
The information is current only as of its date and shall not, under any circumstances, create any implication that the
information contained therein is correct as of any time subsequent to the date thereof or that there has been no change in
the financial condition or affairs of GAR since such date. This presentation may be updated from time to time and there is no
undertaking by GAR to post any such amendments or supplements on this presentation.
The Company will not be responsible for any consequences resulting from the use of this presentation as well as the reliance
upon any opinion or statement contained herein or for any omission.

© Golden Agri-Resources Ltd. All rights reserved.
                                                                                                                                2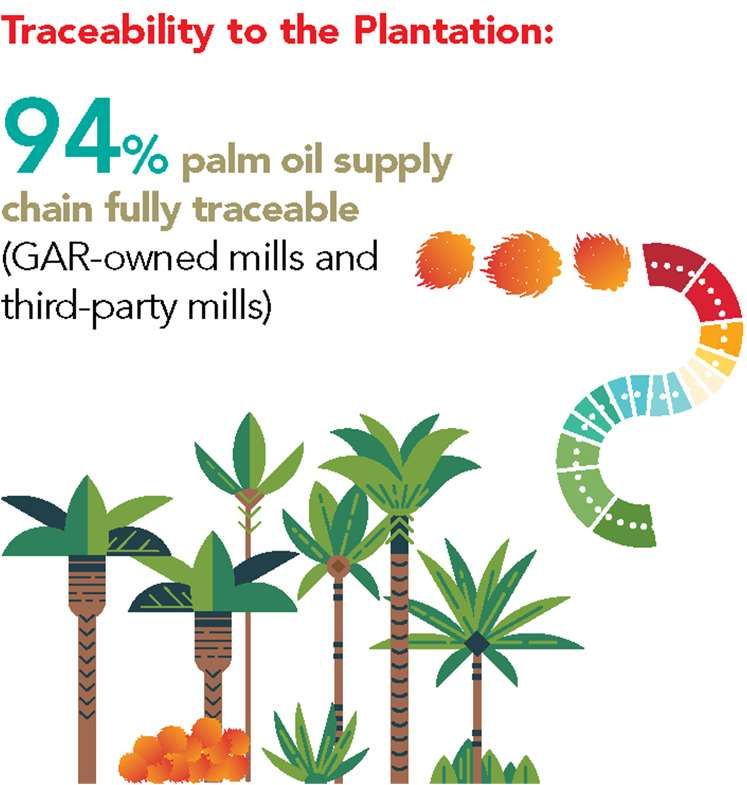
Executive Summary

GAR continued its robust performance in second quarter 2021                                                                            EBITDA (in US$ million)
contributed from both upstream and downstream businesses
                                                                                                                                       523
• 1H 2021 Financial Performance
                                                                                                                                       158
                 Revenue                                EBITDA                        Underlying         Profit1
            US$4.45 bn                            US$523 mn                              US$246 mn
              +31%                                 +176%                                    n.m
                                                                                                                                                           189
• 2Q 2021 Financial Performance (QoQ)                                                                                                  365
                                                                                                                                                            58
                 Revenue                                EBITDA                        Underlying Profit1
                                                                                                                                                           132
            US$2.41 bn                            US$291 mn                              US$147 mn
              +17%                                  +26%                                   +48%                                       1H21                1H20

                                                                                                                                      Palm, laurics and others
Note:
1. Net profit attributable to owners of the Company, excluding net effect of net gain/loss from changes in fair value of biological   Plantation and palm oil mills
   assets, depreciation of bearer plants, exceptional items, foreign exchange gain/loss, and deferred tax income/expense

                                                                                                                                                                      3
Financial Highlights
Financial Performance

   US$ million                                                           1H 2021           1H 2020              YoY           2Q 2021               1Q 2021               QoQ
   Revenue                                                                   4,454             3,391            31%                2,406                 2,048            17%
   Gross Profit                                                              1,061                389         173%                    576                   485           19%
   EBITDA1                                                                      523               189         176%                    291                   232           26%
   Underlying Profit/(Loss)2                                                    246               -11            n.m                  147                     99          48%
     Net gain/(loss) from changes in fair value of
     biological assets3                                                            2                -4           n.m                     2                   0.2         920%
     Depreciation of bearer plants3                                              -60               -59           1%                    -31                   -29           7%
     Foreign exchange gain/(loss)3                                                -8               -45         -83%                      8                   -15           n.m
     Deferred tax expense3                                                       -27               -31         -14%                    -13                   -14          -9%
     Exceptional item3                                                             -                -5        -100%                      -                     -              -
   Net profit/(loss) attributable to owners of
   the Company                                                                  153             -157             n.m                  112                     41        176%
• Strong performance on the back of CPO price appreciation and plantation output growth, partly offset by higher export levy
  and tax
• Healthier downstream business environment after supply chain disruptions in first half 2020
Notes:
1. EBITDA includes net fair value gain/(loss) on financial   2. Net profit/loss attributable to owners of the Company, excluding net effect of net gain/loss from changes in fair value of
   assets in accordance with IFRS 9 of US$11 million,           biological assets, depreciation of bearer plants, exceptional items, foreign exchange gain/loss, and deferred tax expense
   US$-14 million, US$13 million and US$-2 million in 1H     3. Net of tax and/or non-controlling interests
   2021, 1H 2020, 2Q 2021 and 1Q 2021, respectively.                                                                                                                                         5
Financial Position

Lower leverage and strengthened liquidity position amidst the COVID-19 pandemic

 US$ million                                                                                      30-Jun-21                 31-Dec-20               Change

 Total Assets                                                                                           9,240                      9,126                    1%
  Cash and short-term investments                                                                      1,041                       1,097                  -5%
  Fixed assets1                                                                                        4,017                       4,127                  -3%
 Total Liabilities                                                                                      4,615                      4,695                  -2%
 Net Debt2                                                                                                747                      1,108                -32%
  Interest bearing debt                                                                                3,060                       3,145                  -3%
  Cash, short-term investments and liquid working capital3                                             2,313                       2,037                  14%
 Total Equity                                                                                           4,625                      4,432                    4%
 Net Debt2/Total Equity                                                                                 0.16x                      0.25x
 Net Debt2/Total Assets                                                                                 0.08x                      0.12x
 Net Debt2/EBITDA4                                                                                      0.75x                      1.66x
 EBITDA/Interest4                                                                                       6.67x                      4.83x

Notes:
1. Includes Property, Plant and Equipment, Bearer Plants, Right-of-use Assets and Investment Properties
2. Interest bearing debt less cash, short-term investments and liquid working capital
3. Liquid working capital is trade receivables, inventories (excluding consumables), deposits and advances to suppliers less trade payables and advances from customers
4. Calculated based on the last four quarters figures                                                                                                                     6
Interim Dividend

Considering GAR’s robust performance during first half 2021, the Board declares interim
dividend of 0.528 Singapore cents per share

 Cash Dividend                                                       2016              2017               2018            2019              2020             1H 2021

 Dividend per share (in S$ cents)                                   0.635             0.809              0.580             0.580              0.480             0.528
 Total Dividend (in S$ million)                                     80.86            103.02              73.86             73.86              60.92             67.01
 Underlying Profit1 (in US$ million)                              186.28             253.84            180.72            271.82             230.19            245.96
 % to underlying profit                                              31%                30%               30%                20%               20%               20%

The Company’s dividend policy is to distribute up to 30% of underlying profit, after considering:
 • results of operations, cash flows and financial condition;
 • working capital requirements;
 • the dividend payment from subsidiaries; and
 • other factors deemed relevant by the Board of Directors and shareholders.

Note:
1. Net profit attributable to owners of the Company, excluding net effect of net gain/loss from changes in fair value of biological assets, depreciation of bearer plants,
   exceptional items, foreign exchange gain/loss, and deferred tax income/expense
                                                                                                                                                                             7
Segmental Performance
Segmental Results
Plantations and Palm Oil Mills

Higher margins supported by sustained strength in CPO prices and production recovery

                                                                                              1H 2021            1H 2020                 YoY
                           Revenue (US$ million)                                                 1,043                  625              67%
                           EBITDA (US$ million)                                                     365                 132             177%
                             EBITDA margin                                                         35%                 21%               14%
                           CPO FOB Price (US$/MT)                                                1,088                  616              77%

                           FFB Production (‘000 tonnes)                                          5,183               4,084               27%
                              Nucleus                                                             4,060               3,215               26%
                              Plasma                                                              1,123                 870               29%
                           FFB Yield (tonnes/ha)                                                   10.4                  8.8             18%

                           Palm Product Output (‘000 tonnes)                                     1,598               1,219               31%
                              CPO                                                                 1,273                  973              31%
                              PK                                                                    325                  246              32%
                           Oil Extraction Rate                                                  21.6%               21.6%                   -
                           Kernel Extraction Rate                                                5.5%                5.5%                   -
                           Palm Product Yield (tonnes/ha)                                          2.8                 2.4               19%

Note: EBITDA includes allocated net fair value gain/(loss) on financial assets (IFRS 9) of US$5 million and US$-3 million in 1H 2021 and 1H 2020, respectively
                                                                                                                                                                 9
Oil Palm Plantations
Continued long-term productivity growth through replanting and technological innovation
Mature Area (in ha) Planted Area (in ha) Age Profile as of 30 June 2021
536,877 535,923 20% 7%
497,415 484,947
112,588 111,216 39,462 8%
106,867 105,781 41,001
106,964
390,548 379,166 424,289 424,707
108,721 240,729
20% 45%
30-Jun-21 31-Dec-20 30-Jun-21 31-Dec-20
Nucleus Plasma Immature (0-3 years) Young (4-6 years)
Prime 1 (7-18 years) Prime 2 (19-25 years)
• Immature and young estates use next-generation, higher- Old (>25 years)
yielding seeds for continued long-term production growth
• Our high-quality estates continue to produce superior CPO Notes:
yields, even at over 25 years 1. Including plasma
2. Average age of plantations, including plasma, is 17 years
• Replanting achieved at around 8,700 ha in 1H 2021
10Managed Age Profile Provides Continued High Yields
GAR sustains its high yields despite higher average age
GAR’s best-in-class plantations consistently deliver above- Our high-quality estates continue to produce superior CPO
industry CPO yields yields, even at over 25 years
MT/ha MT/ha
5.5 5.0 5.3
5.1
4.9 4.9 4.9 4.8
4.7 4.6
5.0 4.0 4.4 4.3 4.3 4.4
4.5 3.0
2.6
4.0 2.0 2.4
2.2
3.5 1.0
3.0 -
2018 2019 2020
2011 2012 2013 2014 2015 2016 2017 2018 2019 2020
Young (4-6 years) Prime 1 (7-18 years) Prime 2 (19-25 years)
GAR Indonesia Malaysia
Old (>25 years) Nucleus Average Yield
Our yields will continue to increase through replanting with next-generation higher-yielding
seeds and increased mechanisation
11Segmental Results
Palm, Laurics and Others
Strong margin recovery after impact from the COVID-19 outbreak in early 2020
1H 2021 1H 2020 YoY
Revenue (US$ million) 4,433 3,382 31%
Sales Volume (‘000 tonnes) 4,778 4,971 -4%
EBITDA (US$ million) 158 58 172%
EBITDA margin 3.6% 1.7% 1.9%
• Lower sales volume in first half 2021 due to timing of delivery resulting to higher inventory at end of the period
• Indonesia B30 biodiesel programme is a major catalyst to the industry with strong support from the Government and
industry players
Notes:
1. This segment refers to processing and merchandising of palm and oilseed based products i.e. bulk, branded, oleo-chemicals and other vegetable oils, as well as production
and distribution of other consumer products mainly food and beverages
2. EBITDA includes allocated net fair value gain/(loss) on financial assets (IFRS 9) of US$6 million and US$-11 million in 1H 2021 and 1H 2020, respectively
12Strategy and Outlook
Strategic Outlook

Strategic Focus
• Continue to develop capability in serving growing global demand of health-friendly and
  sustainably-produced products, leveraging the strengths as a leading soil-to-table
  agribusiness
• Budgeted capital expenditure of US$150 million in 2021 mainly for replanting, biodiesel
  capacity expansion, and enhancing capability to produce higher-value products
• Gemini Edibles & Fats India, a 56.27% subsidiary of GAR has initiated the process for its
  proposed listing on the BSE and the National Stock Exchange of India1

Industry Outlook
• Fundamental supply and demand balance is expected to remain tight
• Long-term outlook of the industry continue to be positive supported by palm
  oil’s competitive advantages in serving growing population and income per
  capita

Note:
1 For further details, kindly refer to GAR’s announcement regarding Gemini Edibles & Fats India Limited, released on 8 August 2021. As there is no assurance that the Proposed IPO
   will proceed, and the terms thereof have not been finalised, shareholders and potential investors are advised to exercise caution when dealing with the Company's securities, and
   to refrain from taking any action in respect of their securities which may be prejudicial to their interests
                                                                                                                                                                                       14
Towards Responsible Palm Oil Production
TTP for palm supply chain
• To date, 94% of palm supply chain is fully traceable to the
plantation
• Aim to go beyond 100% TTP to reflect entire supply shed and
maintain full traceability
• This is because supply chain fluctuates every year due to suppliers
joining or leaving
GAR scores strongly on ESG
• Continues to be part of FTSE4Good with score 3.3/5 and 59
percentile rank
• Ranks 10/100 on the SPOTT ESG policy transparency assessment
• Ranks 38/519 on the Singapore Governance and Transparency Index
2021
Expanding deforestation monitoring
• Near real-time satellite monitoring of deforestation
• Covers palm oil concessions and supply chain across all of Indonesia
15Appendix
Age Profile

Immature and younger estates use newer-generation higher-yielding planting materials that
will further boost production growth in the future

                       Immature          Young        Prime 1         Prime 2           Old     Total
 hectares             (0-3 years)   (4-6 years)   (7-18 years)   (19-25 years)   (>25 years)

 30 June 2021
 Nucleus                  33,741         37,525       213,195          74,853        64,975    424,289
 Plasma                    5,721          3,476        27,534          33,868        41,989    112,588
 Total Planted Area       39,462         41,001       240,729         108,721       106,964    536,877
 % of total                  7%             8%            45%            20%           20%      100%

 31 December 2020
 Nucleus                  45,541         34,386        204,735        100,165        39,880    424,707
 Plasma                    5,435          2,069         27,917         45,890        29,905    111,216
 Total Planted Area       50,976         36,455        232,652        146,055        69,785    535,923
 % of total                 10%             7%            43%            27%           13%      100%

                                                                                                         17
If you need further information, please contact: Golden Agri-Resources Ltd c/o 108 Pasir Panjang Road #06-00 Golden Agri Plaza Singapore 118535 Tel: +65 6590 0800 Fax: +65 6590 0887 www.goldenagri.com.sg Richard Fung - Director, Investor Relations richard@goldenagri.com.sg golden-agri-resources-ltd @GAR_Sinarmas @sinarmas_agri @GARSinarmasagri Sinar Mas Agribusiness and Food
You can also read