Analyst Briefing Pack - Interim results presentation Six months to 30 June 2020 - Unaudited
←
→
Page content transcription
If your browser does not render page correctly, please read the page content below
Analyst Briefing Pack
Interim results presentation
Six months to 30 June 2020 - Unaudited
Agenda

1   H1 FY20 highlights

2   Capital management

3   Operating segments performance

                                     2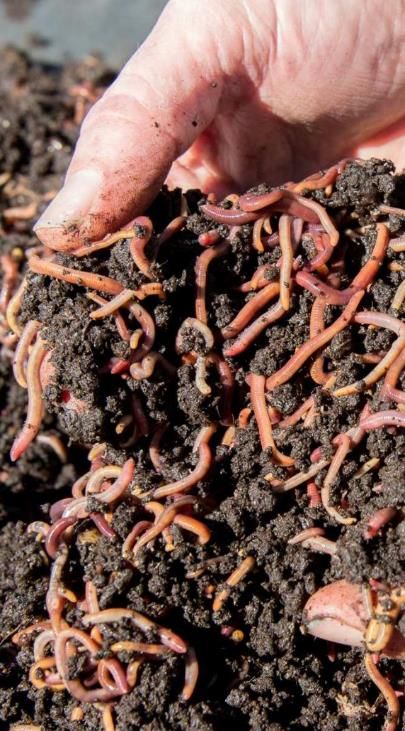
H1 FY20 Highlights
FY20 Six Month Highlights
Focus on achieving excellence
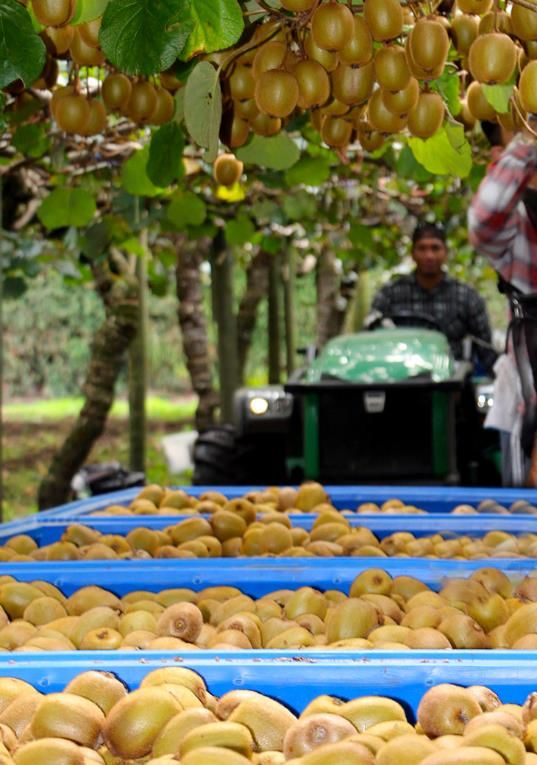
Successfully completed 2020 kiwifruit harvest in Level 4 lockdown
1 − 33.4m trays from our New Zealand growers
− 600k trays from Seeka’s Australian orchards
2 $18.4m NPAT, up 54.9%
− Reflecting the effect of tax deductibility on buildings on deferred tax
3 $30.4m EBITDA, up 9.1%
− After incurring an estimated $5.3m impact from Covid-19
− Includes a $2.5m gain on sale of orchard assets
4 $129.3m closing net debt, down $18.8m
− $15.3m received from orchard sales
5 AU$26.5m conditional sale and lease back of Australian kiwifruit orchards
− Debt to be further reduced, lease secures supply to Seeka, additional water also leased
6 Revitalised performance from Seeka Australia and NZ retail service
Comparisons are to the previous corresponding period to 30 June 2019 (pcp) 4
Covid-19 update – Seeka completes successful harvests
Early planning and action delivered timely harvests

Seeka was an essential business in NZ and Australia            Estimated $5.3m impact on the business
− Safety paramount                                             − Direct cost of Covid-19 measures, lost volumes and margins
− Fruit harvested under level 4 lockdown                       − No wage subsidy received, displaced and vulnerable
                                                                 workers supported by $27,800
− Successfully picked and packed NZ and Australia crops
                                                               − Seeka paid $12.2m in direct salary and wages, and $3.0m to
                                                                 picking contractors during the lockdown period
Proactive safety steps
− Rehoused RSE workers
− Screens, temporary cafeterias, packhouse bubbles, cleaning
− Remote work

Severe labour shortage
− More than 800 people short
− Collaborated with other industries to source people
− Access to labour remains a significant challenge

                                                                                                                         5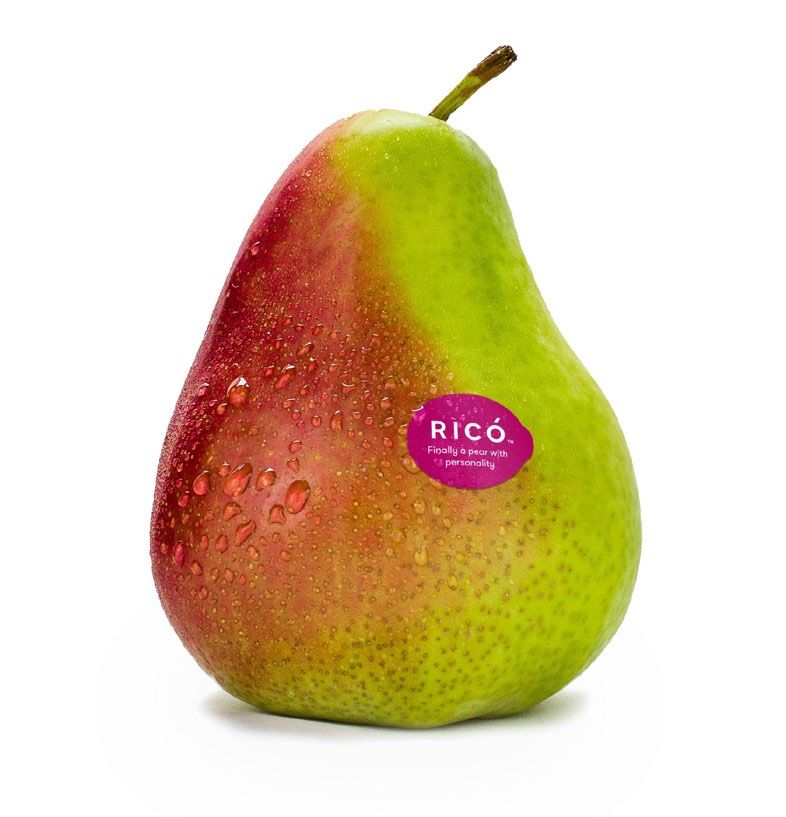
Group financial performance

                                                                                                                                                              H1 FY20       H1FY19                     FY19
$178.7m revenue                                                                                                         $ Millions                            Unaudited     Unaudited       Growth     Audited

Up 5% on H1 FY19                                                                                                        Revenue                                   178.7          169.9        5%          236.9
                                                                                                                        Cost of sales                             124.5          118.9        5%          190.1

$30.4m EBITDA                                                                                                           Change fair value biological assets        16.5            16.5         -         ( 0.7)
                                                                                                                        Gross profit                               37.7            34.5       9%           47.5
Up 9% on H1 FY19 (pcp: $27.9m)
− Includes $5.3m impact of Covid-19                                                                                     EBITDA                                     30.4            27.9       9%           34.5

− Includes $2.5m gain on orchard sales                                                                                  EBIT                                       21.4            20.3       5%           17.6
                                                                                                                        Net profit after tax                       18.4            11.9      55%            6.9

$18.4m Net profit after tax
                                                                                                           Revenue                                            EBITDA
Up 55% on H1 FY19 (pcp: $11.9m)                                                                            To 30 June                  $169.9m
                                                                                                                                                 $178.7m      To 30 June                               $30.4m
                                                                                                                                                                                              $27.9m
− Includes $5.6m one-off deferred tax gain                                                                 $134.2m $134.0m
                                                                                                                             $145.4m                                                $25.7m
                                                                                                                                                                          $21.9m

                                                                                                                                                               $15.8m
Seeka operates a seasonal business
− H1 is the main operating period for our core
  kiwifruit business
                                                                                                                                                                                                                   6
NZ IFRS 16 Leases applies to this report, apart from the 2016 and 2017 EBITDA comparatives on this page.    2016    2017       2018     2019      2020          2016      2017       2018      2019     2020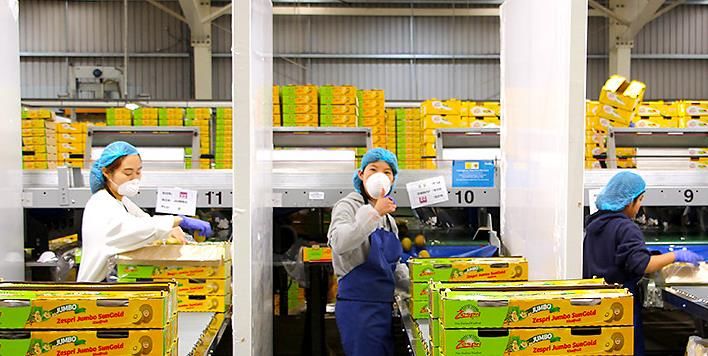
Balance sheet
Net debt at June 30 2020
                                                                                                  H1 FY20     H1 FY19                FY19
                                                           $ Millions                             Unaudited   Unaudited   Growth    Audited

$129.4m net debt at H1 FY20, down $18.8m on pcp            Cash and tax receivable                     3.6         4.0      ( 9%)       2.8
                                                           Trade, other receivables & inventory      101.5        89.2       14%       33.7
                                                           Biological assets - crop                    2.3         1.6       45%       19.5
− Cash flow from operations and orchard sales              Assets classified as held for sale         19.5        37.5     ( 48%)      27.1
                                                           Total current assets                      126.9       132.3      ( 4%)      83.1

− Limited capital expenditure Northland packhouse          Property, plant and equipment             226.1       220.0        3%      220.4
                                                           Intangibles                                18.6        23.0     ( 19%)      18.7
                                                           Right-of-use lease                         43.2        27.4       57%       44.7
− $21.14m of advances to Seeka Growers                     Other                                       1.6         3.2     ( 51%)       1.3
                                                           Total non-current assets                  289.4       273.6        6%      285.1
  − Largely repaid in July 2020                            Total assets                              416.3       405.9        3%      368.2

                                                           Current tax liability                          -           -                 1.7
− Debt programmed to reduce in 2020 with the conditional   Trade and other payables                   43.3        42.0        3%       22.9

  Australian sale                                          Current lease liabilities                   5.6         4.0       42%        5.2
                                                           Interest bearing liabilities               34.8        65.4     ( 47%)      21.9
                                                           Total current liabilities                  83.7       111.4     ( 25%)      51.7

                                                           Interest bearing liabilities               96.4        85.0       13%       97.8
                                                           Right-of-use lease liabilities             43.7        27.8       57%       45.3
                                                           Derivative financial instruments            1.1         1.0       13%        0.8
                                                           Deferred tax liabilities                   17.8        21.7     ( 18%)      17.8
                                                           Total non current liabilities             159.0       135.6       17%      161.6
                                                           Total liabilities                         242.7       246.9      ( 2%)     213.3

                                                           Net assets                                173.6       158.9        9%      154.9
                                                                                                                                              7
Conditional sale of Australian kiwifruit orchards
With long-term leaseback to Seeka
Three Australian kiwifruit orchards conditionally sold
− AU$26.5m sale price
− Realise gain on sale
− Repay debt and fund new kiwifruit orchard developments
Long term leaseback to Seeka
− Initial term of 10 years, plus a 10 year renewal and two
further terms of 5 years
− Secured supply for Seeka
Secured additional water rights
− Part of the agreement
Awaiting approval of the Australian Foreign Investment
Review Board
− Expected by 29 August 2020
8Improved financial performances
Delivering performance from Seeka’s orchard-to-market services
Australian turnaround Retail services turnaround
$1.89m EBITDA Seeka Australia $1.31m EBITDA New Zealand retail services
− Turnaround from pcp loss of $151k − Significant lift from pcp of $760k
− Achieved in spite of lockdown
Profitable kiwifruit business
− Despite hot dry summer impacting volumes New customers driving demand
− Attracting more quality supply from grower community
Green nashi sales return to profitability
− Seeka balanced supply to demand
Developments to add new revenue streams
− 70 hectares of new kiwifruit orchards
in development
− 17 hectares of Ricó club pears ready
for harvest 2021
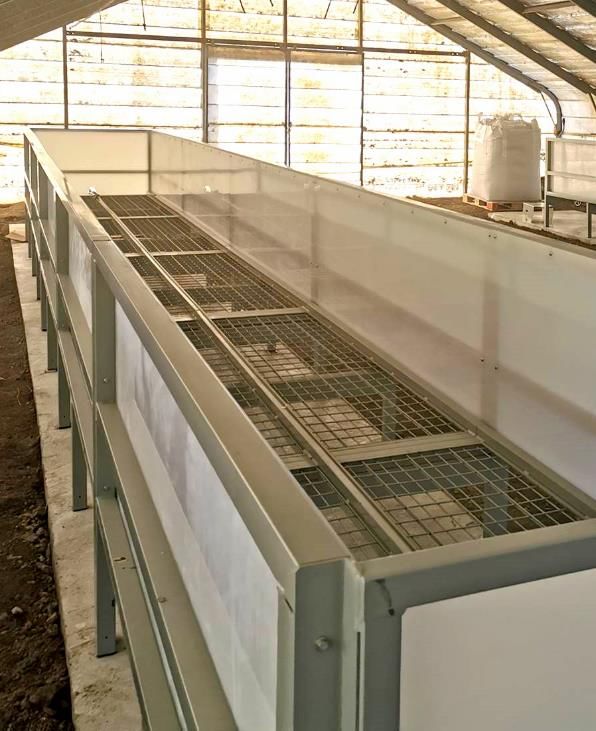
9Seeka’s sustainability culture delivers first win
Seeka worm farm delivers commercial-sized waste-recovery
Board Sustainability Committee created
− To work with management as it gains momentum in its
“Growing Futures” initiative
Sustainability action points
− Calculating Seeka’s carbon footprint
− Waste audits and packaging review
− Coolstore power consumption and load shedding
− Advancing paperless systems
− Biodegradable options, plastic recycling
− Hybrid vehicles
Worm farm recycling waste an early win
− Input waste fruit, leaves and dust from post harvest
− Recovering vermicompost organic fertiliser
− Circular regenerative horticulture
− Catalytic bioreactor to be installed
10Earnings per share and dividends
57 cents earnings per share H1 FY20 H1FY19 FY19
$ Millions Unaudited Unaudited Growth Audited
− Earnings impacted by lower Hayward yields
− $5.3m cost of Covid-19 Net profit ($m) 18.4 11.9 55% 6.9
− 16.5 cents per share Shares on issue (m) 32.1 32.1 32.1
Earnings per share $ 0.57 $ 0.39 46% $ 0.22
Board cancelled April dividend due to Covid-19
Net tangible assets 1 ($m) 164.7 144.5 14% 146.0
Dividend reinstated for September 2020 Net tangible assets per share $ 5.13 $ 4.50 14% $ 4.55
− 10 cents per share fully imputed
− Record date 4 September, payment 30 September
− DRP applies with 2% discount
$5.13 net tangible assets per share
− Up 14% on H1 FY19
1. Net tangible assets is the Group’s net assets less goodwill, divided by the total shares on issue at the end of the period. 11FY20 full year guidance
Seeka updates May 2020 guidance
Forecasting full-year net profit before tax between FY20 FY20 FY19
$9m and $12m Guidance Guidance Full year
$ Millions Lower range Upper range Actuals
Guidance updated despite
Net profit before tax 9.0 12.0 9.9
− $5.3m impact of Covid-19 from higher costs and lost sales Change on FY19 ( 9%) + 22%
− Lower Hayward kiwifruit volumes in NZ and Australia from
dry summer
− Includes expected and realised gain on sales
12Operating segment performance
Orchard operations
Growing kiwifruit, avocado and kiwiberry for New Zealand orchard owners

$47.4m revenue – in line with H1 FY19                                                            H1 FY20     H1FY19            FY19
                                                           $ Millions                            Unaudited   Unaudited         Audited
− Second year of low Hayward yields from dry summer
− SunGold volumes and yields up as orchards enter full     Revenue                                    47.4        48.3             72.4
  production, with growth set to continue                  EBITDA                                      4.2         4.2              5.0
                                                           EBIT                                        3.3         3.6              3.7

$78.9m of assets
                                                           Segment assets                             78.9        61.5             54.2

Investing in new orchards on long term leased land         Crop grown - class 1 trays             H1 FY20     H1FY19 Growth

− 44 hectares of kiwifruit
                                                           Total kiwifruit - all varieties (m)        13.0        11.4   13%
− 20 hectares of Hass and Gem avocados                     Hayward (m)                                 7.6         7.1   6%
− Long-term partnerships with land owners                   Trays per hectare                       10,200       9,800

− Generate new income streams from 2021                    SunGold (m)                                 5.1         3.9   26%
                                                            Trays per hectare                       14,000      13,390

                                                           Other trays (m)                             0.3         0.4

                                                                                                                                          14
Post harvest operations
Packing, coolstoring and shipping kiwifruit, avocado and kiwiberry for New Zealand orchard owners
$108.1m revenue – in line with H1 FY19 H1 FY20 H1FY19 FY19
$ Millions Unaudited Unaudited Audited
− Rise in SunGold volumes
− Offset by dry summer’s impact on Hayward yields and Revenue 108.1 105.3 140.1
volumes experienced across the industry EBITDA 30.3 29.8 41.0
EBIT 24.2 24.9 29.4
$5.3m EBITDA impact of Covid-19
Segment assets 244.7 228.9 222.9
− Direct costs and productivity constraints
Kiwifruit packed - trays (m) H1 FY20 H1FY19 Growth
Assets developed to handle 2021 volumes
Total kiwifruit - all varieties 33.4 33.5
− Capacity to handle SunGold volume growth from new
Hayward - class 1 15.7 17.4 ( 10%)
plantings, and normalisation of Hayward yields
SunGold - class 1 16.1 14.5 11%
Other varieties and class 2 1.6 1.5
15Retail services operations
Marketing fruit from post harvest operations, retail and ripening imported fruit, and Kiwi Crush production
H1 FY20 H1FY19 FY19
$9.7m revenue – up 100% on H1 FY19 $ Millions Unaudited Unaudited Audited
− High volumes of NZ avocado direct to Australian retail
− Improved kiwiberry volumes and returns Revenue 9.7 4.8 8.6
EBITDA 1.3 0.8 1.7
− Wholesale markets in NZ and Australia impacted by
EBIT 0.9 0.4 1.1
Covid-19 lockdowns
Segment assets 18.2 15.8 11.2
$1.3m EBITDA – up 73% on H1 FY19
Business revitalised
− Significant trading turnaround
− Improved service delivery from Christchurch site
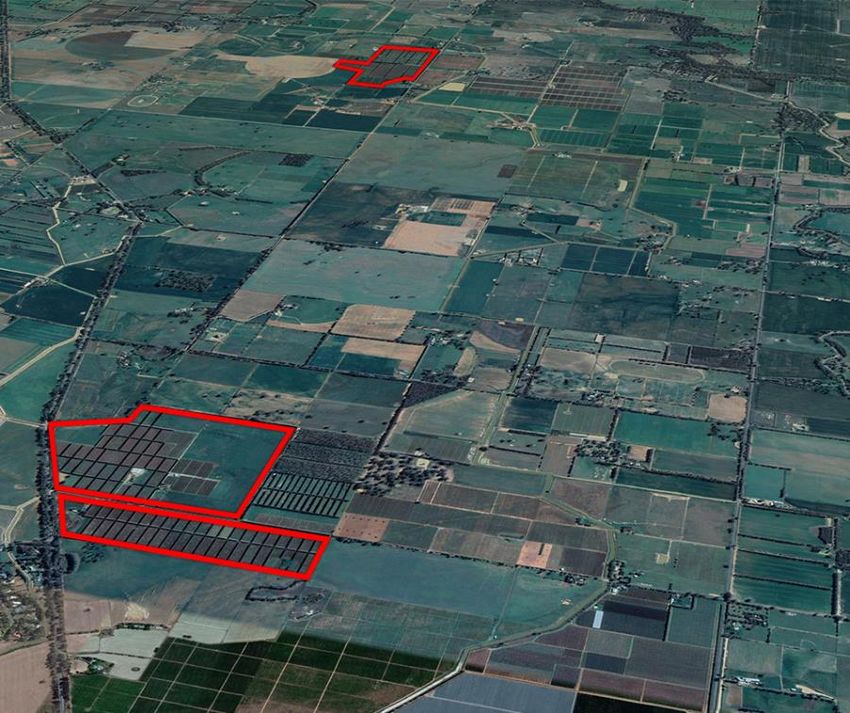
16Australian operations
Growing, packing and retailing kiwifruit, nashi pears, and European pears on owned orchards
$13.3m revenue – up 17% on H1 FY20 H1 FY20 H1FY19 FY19
$ Millions Unaudited Unaudited Audited
− Business reset returns Australian operations to profit
− Hot, dry growing conditions impact kiwifruit yields Revenue 13.3 11.4 11.6
EBITDA 1.9 ( 0.2) ( 0.6)
EBIT 1.4 ( 0.7) ( 2.1)
Planted pear areas balanced to market opportunities
− Investing in new Club pear varieties – Ricó and Lanya Segment assets 55.5 48.8 52.2
− Establishing other new categories
Crop packed - tonnes H1 FY20 H1FY19 Growth
Kiwifruit orchards conditionally sold Total fruit - all produce 4,380 4,190 5%
− Subject to approval of Australian Foreign Investment Kiwifruit 2,153 1,806 19%
Review Board Nashi 791 988 ( 20%)
− 199 hectares total land area Corella 165 284 ( 42%)
Packham 878 984 ( 11%)
− Includes term supply commitment
Other pears and fruit 393 128 207%
− Access to additional water
17Contact
For more information see www.seeka.co.nz or please call
Michael Franks Stuart McKinstry
Chief executive Chief financial officer
+64 21 356 516 +64 21 221 5583
18seeka.co.nz
You can also read