Gurit FY 2016 Results - Zurich, March 8, 2017
←
→
Page content transcription
If your browser does not render page correctly, please read the page content below
Gurit
FY 2016 Results

Zurich, March 8, 2017
This presentation may include forward-looking statements that reflect the
 intentions, beliefs or current expectations and projections of Gurit Holding
 AG about the future results of operations, financial condition, liquidity,
 performance and similar circumstances.

 Such statements are made on the basis of assumptions and expectations
 which may prove to be erroneous, although Gurit Holding AG believes
 them to be reasonable at this time.

Slide 2                                                                         Corporate
Gurit Strategy 2020
Gurit Strategy 2020
Sales Growth ambition by 2020 at ca. CHF 500 million
Organic – ca. CHF450 million
Acquisitive – target CHF 50-100 million
Operating Profitability ambition by 2020 is to maintain 8-10% RoS
Key Markets for Gurit Advanced Composites
Wind, Aerospace and Automotive – 3 key strategic growth markets
Marine and Industrial – 2 key niche markets
Shareholder Dividend pay-out ratio
Pay-out ratio of 30-40% of NIAT per annum
Slide 4 Corporate
Gurit Strategy 2020 – Key Stepping Stones Innovation: New product properties and efficiency initiatives (Growth and cost reduction effects) Aero: US OEM Qualification (Growth and profitability effect 2017 - 2020) Europe: Underutilized site consolidations (Cost reduction 2018+) Tooling: New Tooling Europe site growth (Growth and profitability effect 2017+) Automotive material and component business growth (2017+) Acquisitions: Growth acceleration (2017+) depending on suitable opportunities Slide 5 Corporate
Gurit FY 2016 Business Update

Key Business Notes FY 2016
Profitability & Growth:
Best operating profit margin in more than 15 years, profitability target range
substantiated for the second consecutive year
Stable net sales generation in a challenging market environment
Wind market decline by -14% globally, Gurit wind material sales drop
by -4.1%
Tooling with another record year, mainly from Non-Chinese customers
Aero business growing double-digit for the first time and ahead of US sales
opportunities
Marine and Industrial EMEA hurt by weak demand
M&A:
PET acquisition in Europe complements capacity & technology base
Slide 7 Corporate
Key Financial Notes FY 2016
Growth: +0.3% (-2.1% in reported CHF) to CHF 352.0 m (2015: CHF 359.4 m)
Op. Profit and RoS: CHF 36.8 m (2015: CHF 33.0 m) and 10.5% (2015: 9.2%) -
best operating profit margin in more than 15 years
Investment on lower level than 2015:
Capex of CHF 10.5 m (2015: CHF 16.7 m): mainly Tooling and Balsa
R&D investment raised to 1.9% of net sales (2016: 1.8%)
Balance Sheet and Cash Flow KPI:
Operating Cash Flow of CHF 37.9 m (2015: CHF 37.2 m)
Net Cash Position of 37.2 m (2015: CHF 20.4 m)
Equity Ratio solid at 76.6% (2015: 71.4%)
Slide 8 Corporate
Development by Key Markets
Wind Energy – Market Environment
GWEC Projected Global Annual Capacity*
100
80 72 75.5 79.5
63 68
Americas
60 52 54.6
40 Asia /
Pacific
20
0 EMEA
2014 2015 2016 2017 2018 2019 2020
* Source: GWEC Global Wind Statistics April 22, 2016, and
GWEC Global Wind Statistics February 10, 2017
2016 saw a correction from the 2015 record year
Drop in newly installed capacity in China was steeper than anticipated
Single digit growth expected for 2017, Gurit estimation for newly installed wind capacity
globally in 2017 is some 57 GW
Slide 10 CorporateWind Energy Materials – Results & Outlook
Results & Achievements FY 2016
Net sales: CHF 149.0 m (FY 2015: CHF 155.4 m)
Decline by 4 % due to weaker Chinese market (-24%)
Offset in India and US/EU overall not sufficient for
Gurit to grow
Operations: Balsa capacity expansion in Ecuador
and China completed
Sourcing: Attractive (oil-driven) commodity prices, MCHF Wind Energy: Quarterly Net Sales
Balsa wood sourcing in APAC in place 50
39.8 40.8 39.1 39.8 39.1
40 35.8 33.7 36.4
Focus 2017: 30
Utilization of new Balsa capacity 20
Implementation of product innovation plans for 10
SAN/PET/PVC for 2017+ 0
Q1 Q2 Q3 Q4 Q1 Q2 Q3 Q4
2015 2016
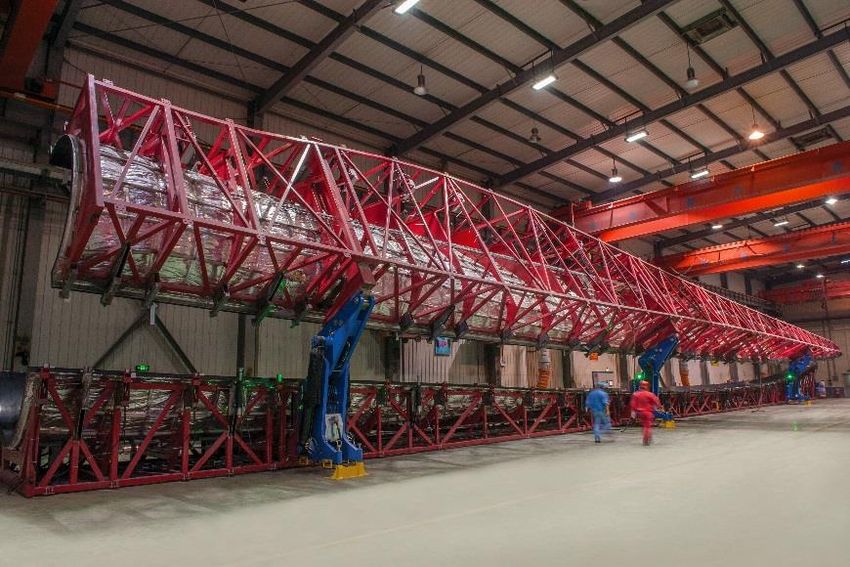
Slide 11 CorporateTooling – Results & Outlook
Results & Achievements FY 2016
Net sales: CHF 69.0 m (FY 2015: CHF 59.0 m)
Increase by 16.9%, less prone to newly installed
capacity due to pre-investments into longer wind
blade moulds
Operations:
Completion of factory expansion in China
Set-up of production facility in Poland
MCHF Tooling: Quarterly Net Sales
Focus FY 2017 30
Set-up of another, larger production hall at the 20.5
18
20 16.8 15.9 16.3
existing premises for larger moulds planned 14.5 14.2
11.8
Gain additional mould orders for the 10
European production site and expand
Win 1-2 additional new major European-based 0
clients in 2017 Q1 Q2 Q3 Q4 Q1 Q2 Q3 Q4
2015 2016
Slide 12 CorporateAerospace – Market Environment
Aircraft Deliveries by Type*
750 688
629 635 A380
500 A350
A330
250
Single
aisle
0
2014 2015 2016
* Source: Airbus Order Book
Commercial aerospace market expected to continue to grow at a CAGR of 4.6% to 2020
according to DTTL / Deloitte Global
Use of advanced composite materials per aircraft increasing steadily
Combined Airbus & Boeing order books at the end of 2016 show backlog of >12.000
aircraft, equivalent to 8-9 years of production
Slide 13 CorporateAerospace – Results & Outlook
Results & Achievements FY 2016
Net sales: CHF 47.6 m (FY 2015: CHF 42.8 m)
Increase by 11.1% due to stronger build rates and
demand situation in Europe
Operations: new prepreg tower in Kassel successfully
brought into operation
New product development with better
price/performance ratio bearing fruit MCHF Aerospace: Quarterly Net Sales
20
Focus 2017: 12.6 11.7 12.7
12 11.5
Completion of US OEM qualification program 10.2 10.6
9.2
10
Further enhancement and broadening of product
offering
0
Q1 Q2 Q3 Q4 Q1 Q2 Q3 Q4
2015 2016
Slide 14 CorporateOther Material Markets – Market Environment
Market demand
European Marine luxury and leisure markets show continued low build rates.
Ongoing positive Automotive material qualifications, market growth yet lower than
expected.
Other material markets (construction and industrial): project-driven business hit by
liquidity crunch in the MEA region
Slide 15 CorporateOther Material Markets – Results & Outlook
Results & Achievements FY 2016
Net sales: CHF 69.0 m (FY 2015: CHF 75.7 m)
Decrease by 1.8% due to Marine project delays in
Europe and slower than expected technology adoption
in automotive materials
Positive sales development in other industrial markets
Focus 2017:
Automotive materials: keep pushing for new MCHF Other Material Markets:
customers and projects 30 Quarterly Net Sales
Construction & Industrial: recovery in the MEA 19.5 19.4 20.4 20.1
20 16.5 18.1 17.4
region expected for 2HY 2017 13.5
Continued market development and support
10
activities for new material markets
Further enhancement and broadening of 0
product offering Q1 Q2 Q3 Q4 Q1 Q2 Q3 Q4
2015 2016
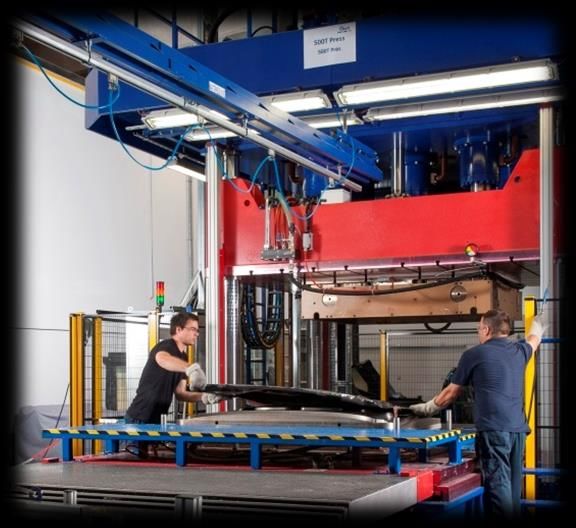
Slide 16 CorporateComposite Components – Results & Outlook
Results & Achievements FY 2016
Net sales: CHF 17.4 m (FY 2015: CHF 26.4 m)
Further anticipated drop of -34.3% due to known
contract expirations over 2015
Operations:
Successful series production for major contract
New four-year automotive body panel supply
contract won at a total value of around CHF 15
million, to start production in June 2018 (as MCHF Composite Components:
announced) 10 Quarterly Net Sales
7.5 7.4
5.9 5.6
Focus 2017 5 4.7
4.4
Participate in increased bidding activities 3.3
and win further orders
0
Q1 Q2 Q3 Q4 Q1 Q2 Q3 Q4
2015 2016
Slide 17 CorporateFinancial Results FY 2016
Net Sales Analysis by Markets
Overall stable net sales year-
Net sales in MCHF over-year despite a decline of
newly installed wind capacity of
359.4 352.0
-14% globally and -24% in
Materials Components Tooling
China
Wind market shortfall in China
177.8 181.6 182.3 169.7
was partially offset by additional
sales in other regions
In other material markets the
slower marine market was
largely compensated by double
1HY 2015 2HY 2015 1HY 2016 2HY 2016 FY 2015 FY 2016
digit growth in aerospace
Net sales by markets 2016 2015 ∆ 2016 ∆ 2016 Components showed the
in MCHF vs 2015 vs 2015 anticipated drop in sales due to
FX adj. the orderly end and ramp down
Wind Energy 149.0 155.4 -4.1% -2.9% of contracts
Other Material markets 116.6 118.6 -1.6% 0.0%
Composite Materials 265.6 274.0 -3.0% -1.6% Tooling sales reached yet
Composite Components 17.3 26.4 -34.3% -28.0% another record year and
Tooling 69.0 59.0 16.9% 21.8% benefitted from the continued
Total Net Sales 352.0 359.4 -2.1% 0.3% pre-investment in longer wind
blade moulds
Slide 19 CorporateOperating Profit and RONA Development
Operating profit (% Net sales) RONA (incl. Goodwill)
• Operating profit at 10.5% of net
sales, best operating profit margin
since more than 15 years, and
15.9%
substantiating the profitability
15.4%
14.3% 16.1% target of 8-10% for the second
13.7%
12.4% consecutive year
5.8%
• Main positive drivers:
• Record setting Tooling sales
10.5%
10.5%
10.4%
9.5%
9.2%
8.9%
4.2%
• Operational improvements
• Favorable external factors
1HY 2HY 1HY 2HY FY 2014 FY 2015 FY 2016
2015 2015 2016 2016
• Significant RONA improvement
and trend based on increased
operating profit development on a
stable asset basis
Slide 20 CorporateOperating Profit Bridge FY 2015 to FY 2016
10.5%
9.2%
Slide 21 CorporateIncome Tax Expense
CHFm
11.0
28%
10.0
9.0 23% 1.7
-0.8
8.0 20% 1.8
7.0
6.0
5.0 10.0
4.0 8.3
7.2
3.0
2.0
1.0
0.0
Tax expense at Not capitalized tax Other effects, Actual tax expense Not recoverable Actual
average expected losses net before WHT WHT on IC tax expense
rates dividends
• Income tax expenses burdened by unfavorable effects from not capitalized tax losses and
not recoverable withholding taxes on intercompany dividends.
Slide 22 CorporateProfit and Loss
Consolidated P&L 2016 2015 Variance
MCHF % NS MCHF % NS MCHF %-points
Net sales 352.0 100.0% 359.4 100.0% -7.4 0.0%
Gross margin 180.9 51.4% 186.2 51.8% -5.3 -0.4%
Personnel expense -80.5 -22.9% -83.8 -23.3% 3.3 0.4%
Other operating expenses -63.6 -18.1% -69.4 -19.3% 5.8 1.2%
Operating profit 36.8 10.5% 33.0 9.2% 3.8 1.3%
Finance expenses, net -0.8 -0.2% -1.3 -0.4% 0.5 0.1%
Taxes -10.0 -2.8% -9.1 -2.5% -0.9 -0.3%
Net result 26.0 7.4% 22.6 6.3% 3.5 1.1%
Earnings per bearer share CHF 55.64 CHF 48.24
Distribution per bearer share CHF 20.00 CHF 15.00
Slide 23 CorporateBalance Sheet
CONSOLIDATED ASSETS Dec 2016 Dec 2015 Variance
MCHF % MCHF % MCHF %-points
Cash and cash equivalents 38.6 16% 29.8 12% 8.8 4%
Trade receivables 61.3 25% 65.2 26% -3.9 -1%
Inventories 46.2 19% 51.2 20% -5.0 -2%
Other current assets 20.5 8% 20.2 8% 0.3 0%
Deferred income tax assets 2.9 1% 3.1 1% -0.2 0%
Property, plant and equipment 73.0 29% 75.4 30% -2.4 -1%
Intangible assets 5.8 2% 5.9 2% -0.2 0%
Other non-current assets 0.8 0% 0.3 0% 0.5 0%
TOTAL ASSETS 249.1 100% 251.2 100% -2.1 0%
CONSOLIDATED LIABILITIES AND EQUITY Dec 2016 Dec 2015 Variance
MCHF % MCHF % MCHF %-points
Borrowings 1.4 1% 9.5 4% -8.0 -3%
Trade payables 22.7 9% 25.0 10% -2.2 -1%
Other current liabilities 29.3 12% 30.5 12% -1.1 0%
Deferred income tax liabilities 2.6 1% 3.5 1% -0.9 0%
Provisions 2.1 1% 3.4 1% -1.3 -1%
Other non-current liabilities 0.1 0% 0.0 0% 0.1 0%
Equity 190.8 77% 179.5 71% 11.3 5%
TOTAL LIABILITIES AND EQUITY 249.1 100% 251.2 100% -2.1 0%
• Trade working capital reduced to 24% of net sales from 25% in 2015
• Solid balance sheet: Net cash of CHF 37m, Equity ratio of 77% and Quick Ratio of 220%
Slide 24 CorporateCash Flow
Group Consolidated Cash Flow 2016 2015 Variance
MCHF MCHF MCHF
EBIT 36.8 33.0 3.8
Depreciation, amortisation, impairment 11.7 9.6 2.2
Change in working capital 0.8 0.4 0.4
Income tax paid -10.7 -5.8 -4.9
Other cash flow from operating activities -0.8 0.0 -0.8
Net cash flows from operating activities 37.9 37.2 0.7
Purchase of PPE and Intangibles -10.5 -16.7 6.2
Proceeds from sale of PPE 0.1 0.0 0.0
Free Cash Flow 27.5 20.6 7.0
Business Aquisition -1.8 0.0 -1.8
Change in borrowings -7.9 -14.4 6.5
Distribution to shareholders -7.0 -4.0 -3.0
Purchase of treasury shares -0.6 -0.2 -0.4
Repayments of loans receivable -0.4 0.2 -0.7
CHANGE IN CASH AND CASH EQUIVALENTS 9.8 2.2 7.6
• Strong operating cash flow of CHF 38m
• Capital expenditures relate mainly to capacity increases in Tooling and the Balsa wood production
plants in Ecuador and China as well as the automotive body panels factory in Hungary.
• Continued reduction of borrowings
Slide 25 CorporateFinancial Results FY 2016 Conclusion
Outlook 2017
Net Sales
Low single-digit level growth expected for 2017
Operating Profitability
Gurit strives to further substantiate its target range of 8-10% in 2017
Slide 27 CorporateGurit Holding AG c/o Gurit Services AG Thurgauerstrasse 54 8050 Zurich Switzerland
You can also read