UPDATE A Precarious Path to Recovery Yasuyuki Sawada Chief Economist, Asian Development Bank
←
→
Page content transcription
If your browser does not render page correctly, please read the page content below
EMBARGOED UNTIL 9:30 AM
MNL/SIN/HKG time
15 September 2020
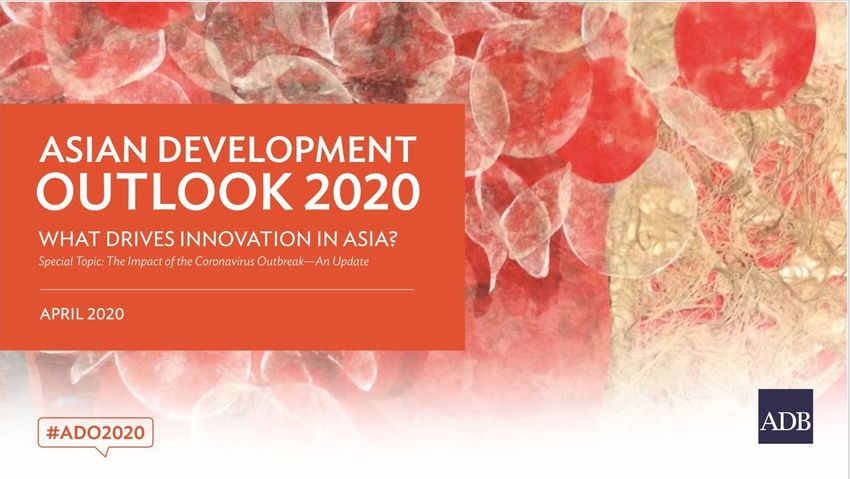
UPDATE
A Precarious Path to Recovery
Yasuyuki Sawada
Chief Economist, Asian Development Bank
1
Key messages
• Developing Asia will contract (-0.7%) this year, its first contraction in six
  decades. Growth will rebound to 6.8% in 2021
• The downturn is broad-based—three-fourths of the region's economies
  are expected to contract this year. PRC is an important exception
• Depressed demand and low oil prices offset supply disruptions, keeping
  regional inflation at 2.9% in 2020, and trimming it to 2.3% in 2021
• The main risk stems from the prospect of a prolonged COVID-19
  pandemic, which could derail the recovery
• The ADOU theme chapter discusses the role of wellness in development
  and how the wellness economy can help drive the post-COVID recovery
                                       2
The global pandemic persists, and is at varying
stages in developing Asia
The virus continues to spread globally… …with South Asia being the epicenter of the pandemic in
developing Asia.
New cases, 7-day moving average New cases, 7-day moving average
(Log scale) (Log scale)
100,000 Latin America
100,000 South Asia
Developing United States
10,000 Asia Southeast Asia
10,000
Euro Area
1,000 1,000 Central Asia
100 100
East Asia
The Pacific
10 10
1 1
0 0
Mar 2020 Apr 2020 May 2020 Jun 2020 Jul 2020 Aug 2020 Feb 2020 Mar 2020 Apr 2020 May 2020 Jun 2020 Jul 2020 Aug 2020
Note: Latin American includes Argentina, Bolivia, Brazil, Chile, Colombia, Costa Rica, Sources: European Centre for Disease Prevention and Control, Johns Hopkins University,
Cuba, Dominican Republic, El Salvador, Guatemala, Haiti, Honduras, Mexico, Telegraph UK, and Worldometer (accessed on 8 September 2020) .
Nicaragua, Panama, Paraguay, Peru, Uruguay, Venezuela.
Sources: European Centre for Disease Prevention and Control, Johns Hopkins
University, Telegraph UK, and Worldometer (accessed on 8 September 2020).
3The outbreak and containment measures
restricted mobility and domestic activity…
Stringent containment measures in Asia are now being eased… …but the mobility reductions led to steep GDP growth declines
GDP growth
decline (pp)
10
SIN Q1KOR Q1
IND Q1 TAP Q1 0
MAL Q1 VIE Q1 INO Q1
SRI Q1 GEO Q1 THA Q1 KOR Q2
HKG Q1 NEP Q1TAP Q2
PHI Q1 HKG Q2 KGZ Q1
KGZ Q2 VIE Q2 -10
INO Q2 MON Q2
SIN Q2 MON Q1
THA Q2
-20
MAL Q2
PHI Q2
IND Q2 -30
-40
-80 -60 -40 -20 0 20
Average mobility (change from baseline, %)
Note: The Government Response Stringency index is a composite measure of nine response indicators including Notes: Red dots are ADB developing member economies. Year-on-year GDP growth relative to
school closures, workplace closures, and travel bans, rescaled to a value from 0 to 100, with 100 being the strictest GDP growth in Q4 of 2019.
response. Source: University of Oxford. (accessed 8 September 2020). 4 Sources: CEIC database; Oxford University; and Google.…while trade plummeted and bottomed out—with
Asia’s trade falling by less than global trade
Real exports Real imports
% change, year on year % change, year on year
World World
G3 G3
10 Developing Asia 10 Developing Asia
0 0
-10 -10
-20 -20
-30 -30
Jan-19 May-19 Sep-19 Jan-20 May-20 Jan-19 May-19 Sep-19 Jan-20 May-20
Notes: G3 refers to the weighted average of US, Japan, and Euro area. Developing Asia refers to the weighted average of PRC; Hong Kong, China; India; Indonesia; Republic of Korea; Malaysia; Pakistan;
Philippines; Singapore; Taipei,China; Thailand; and Viet Nam.
Source: CPB Netherlands Bureau for Economic Policy Analysis. Available: https://www.cpb.nl/en/worldtrademonitor (accessed 26 August 2020).
5As a result, growth slumped in the first half of 2020
Growth and demand-side contributions to growth, 2019 and 2020H1, selected economies
Percentage points
18
PRC and India ASEAN-5 NIEs
6.1 7.0
9 4.9 5.0 6.0
4.3 2.4 2.7
1.8 2.0 0.8
0.7
0
-1.3 -1.2 -0.7
-1.6
-9 -10.1 -9.0 -6.9
-8.3 -9.0 -6.7
-18
2019 H1 2019 H1 2019 H1 2019 H1 2019 H1 2019 H1 2019 H1 2019 H1 2019 H1 2019 H1 2019 H1
2020 2020 2020 2020 2020 2020 2020 2020 2020 2020 2020
PRC IND INO MAL PHI THA VIE HKG ROK SIN TAP
Consumption Investment Net exports GDP growth
Note: Data for all economies (including India) are on calendar year basis, i.e., calendar year 2019 and calendar H1 2020 (March and June quarters of 2020). Details may not
add up to total due to statistical discrepancy.
Sources: Haver Analytics; CEIC Data Company (both accessed 31 August 2020); ADB estimates.
6Asian governments stepped in with a wide-
ranging crisis response…
Policy packages in developing Asia
% of GDP Government support to income/revenue
Credit creation
10 Liquidity support
8.9 Direct long-term lending
7.9 Equity support
8
6.2
6 5.7
4.8
4.2
3.8
4 3.4
3.2
2.7 2.7
2.4
1.8 1.8
2 1.4
1.2 1.0
0.9 0.7
0.2 0.2 0.1 0.2 0.0 0.2 0.3 0.1 0.0
0.0 0.0
0
Developing Asia East Asia Southeast Asia South Asia Central Asia The Pacific
Note: Data as of 24 August 2020.
Source: Compiled from ADB COVID-19 Policy Database, https://covid19policy.adb.org/ (accessed on 8 September 2020).
7…which helped capital flows and financial
markets recover after an initial nosedive
After substantial outflows in March, foreign portfolio …and financial market recovered, to varying degrees.
flows returned…
Portfolio flows Equity index
India People's Republic of China NIEs ASEAN-5
$ billion
Equity Debt
10 1 Jan 2020 = 100
120
0
100
-10
80
-20
Jan Apr Jul Oct Jan Apr Jul 60
2019 2020 J an Mar M ay Ju l
2020
Note: Total equity flows includes economies of the People’s Republic of China; India; Indonesia; Pakistan; Source: CEIC Data Company; Bloomberg (both accessed 31 August 2020).
Philippines; Republic of Korea; Sri Lanka; Taipei,China; Thailand; and Viet Nam. Total debt flows includes economies
of India, Indonesia, and Thailand only.
Source: Institute of International Finance Capital flow tracker database (accessed 31 August 2020) 8Regional GDP will contract this year,
for the first time in nearly 6 decades…
GDP growth in developing Asia GDP levels in developing Asia
GDP level, 2015 = 100
%
140
8 Pre-COVID trend
6.8
6 6.2
130
5.9 6.2
April 2020
5.1 ADO
4
2.2 June 2020 120
ADOS
2 September 2020
ADO Update 0.1
110
0
-0.7
-2 100
2018 2019 2020 2021 2015 2016 2017 2018 2019 2020 2021
Forecast Forecast
Source: Asian Development Outlook database.
9…and the decline is broad-based, affecting
most economies.
2020 2021 2020 2021
ADO ADOU ADO ADOU ADO ADOU ADO ADOU
East Asia 2.0 1.3 6.5 7.0 South Asia 4.1 -6.8 6.0 7.1
Hong Kong, China -3.3 -6.5 3.5 5.1 Bangladesh 7.8 5.2 8.0 6.8
PRC 2.3 1.8 7.3 7.7 India 4.0 -9.0 6.2 8.0
Republic of Korea 1.3 -1.0 2.3 3.3 Pakistan 2.6 -0.4 3.2 2.0
Taipei,China 1.8 0.8 2.5 3.5
Central Asia 2.8 -2.1 4.2 3.9
Southeast Asia 1.0 -3.8 4.7 5.5 Azerbaijan 0.5 -4.3 1.5 1.2
Indonesia 2.5 -1.0 5.0 5.3 Kazakhstan 1.8 -3.2 3.6 2.8
Malaysia 0.5 -5.0 5.5 6.5
Philippines 2.0 -7.3 6.5 6.5 The Pacific -0.3 -6.1 2.7 1.3
Singapore 0.2 -6.2 2.0 4.5 Fiji -4.9 -19.8 3.0 1.0
Thailand -4.8 -8.0 2.5 4.5 Papua New Guinea 0.8 -2.9 2.8 2.5
Viet Nam 4.8 1.8 6.8 6.3
Developing Asia 2.2 -0.7 6.2 6.8 Excluding NIEs 2.4 -0.5 6.7 7.2
= upgraded forecast, = downgraded forecast, no sign = unchanged.
Source: Asian Development Outlook database. 10The region’s two giants are on divergent paths.
While COVID-19 has been contained in the PRC, India …so while growth is rebounding in the PRC, recovery
is now the epicenter of the pandemic in the region… in India will take longer
COVID-19 daily cases Growth in India and PRC
New cases, 7-day moving average
(Log scale) % change year on year
100,000
8
10,000 India 3.2
0
1,000 PRC
100 -8
10
PRC -16
1
India
-24
0 -23.9
Feb Mar Apr May Jun Jul Aug -32
2020 2020 2020 2020 2020 2020 2020 2019 Q1 Q2 Q3 Q4 2020 Q1 Q2
Source: Johns Hopkins University. Sources: CEIC Data Company (accessed 10 August 2020); ADB estimates.
11Depressed demand and lower oil prices will
keep regional inflation muted
Weak demand and low oil prices will dampen inflationary pressures… …while current accounts will largely stabilize across the
region
Inflation (%) Current account balance (% of GDP)
3.2
2.9 2.9
2.5 2.3
Central Asia 2.3
South Asia
Southeast
Asia
East Asia
2018 2019 ADO ADOU ADO ADOU
2020 2021
Forecast
Source: Asian Development Outlook database. Source: Asian Development Outlook database.
12Risks remain tilted to the downside in an
uncertain new normal
• The main risk centers on the evolution of COVID-19—a prolonged
pandemic (extended first wave, or recurrent waves) could stifle the
recovery, with further supply and demand disruptions; protracted
weakness could trigger crises in some economies
• Worsening geopolitical tensions are another risk, most notably potential
for intensified US–PRC frictions over trade and technology
13ADOU 2020 theme: Wellness in Worrying Times
• Wellness is the active pursuit of
activities, choices, and lifestyles that
lead to a state of holistic health
• It is part of the UN SDGs (SDG 3:
Ensuring healthy lives and promoting the
well-being for all, at all ages)
• Physical and mental health has taken a
battering during COVID-19
• Wellness economy is a large and growing
part of the regional economy
• Policymakers can promote wellness to
Source: Global Wellness Institute
support post-pandemic recovery
14Key messages
• Developing Asia will contract (-0.7%) this year, its first contraction in six
decades. Growth will rebound to 6.8% in 2021
• The downturn is broad-based—three-fourths of the region's economies
are expected to contract this year. PRC is an important exception
• Depressed demand and low oil prices offset supply disruptions, keeping
regional inflation at 2.9% in 2020, and trimming it to 2.3% in 2021
• The main risk stems from the prospect of a prolonged COVID-19
pandemic, which could derail the recovery
• The ADOU theme chapter discusses the role of wellness in development
and how the wellness economy can help drive the post-COVID recovery
15Appendix
16Downside risk scenario:
impact of prolonged global pandemic
• Renewed (but “smarter”) containment
Effect on GDP (relative to ADOU baseline)
measures in the US, euro area, Asia
(ex. PRC), and elsewhere where the
number of cases are still rising quickly
affect both supply and demand.
• Main impact is domestic, with some
global spillovers through trade and
financial channels
• Growth in 2020 would be lower by
1.3pp in the PRC, 3.4pp in India, and
PRC = People’s Republic of China, IND = India, FY = fiscal year, EA =
emerging Asia. EA includes Hong Kong, China, Malaysia, Philippines,
4.0pp in “other emerging Asia” bloc;
Republic of Korea, Singapore, Taipei,China, Thailand and Vietnam.
Note: Data for India are in fiscal years ending 31 March of the next year. with additional losses in 2021. 17
Source: ADB estimates using the Global Projection Model (GPM).You can also read