Leicester Children and Young People: Joint Strategic Needs Assessment - Summary document update 2021
←
→
Page content transcription
If your browser does not render page correctly, please read the page content below
Leicester Children and Young People:
Joint Strategic Needs Assessment

  Summary document update 2021

Leicester City Council
Children and young people
Joint Strategic Needs Assessment
Version 3.0

www.Leicester.gov.uk/JSNA
Contents

                                                   Page
1. Children’s JSNA Summary document and
                                                    3
highlights
2. Leicester’s 0 to 19 population: Age, gender,
                                                    5
ethnicity, language, SEN.

3. Child deprivation and poverty                    7

4. Life expectancy and deprivation                  9

5. Infant mortality and maternity indicators        10

6. Early years health and wellbeing indicators      11

7. Childhood obesity, diet and physical activity    13

8. Child mental health and wellbeing                15

9. Looked after children
                                                    16

10. Further information                             16

                                                          2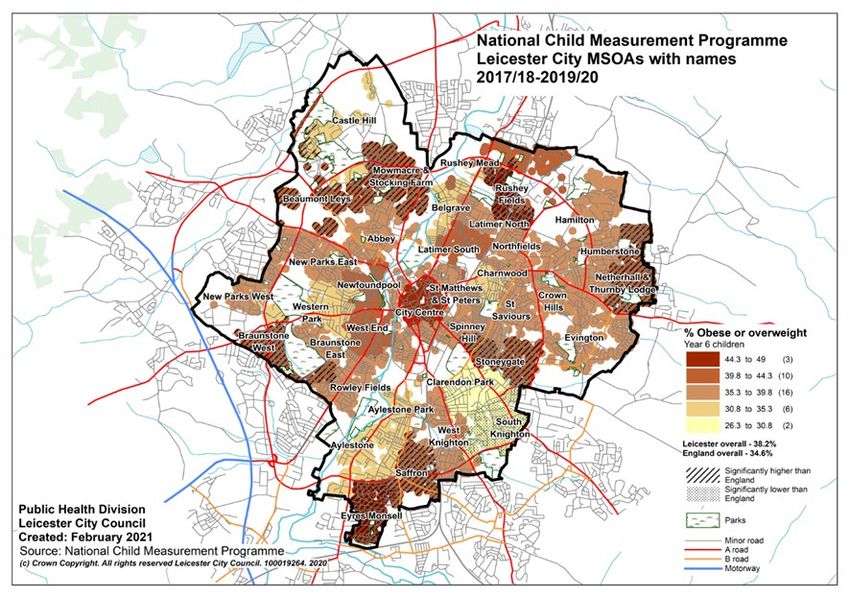
1. Children’s JSNA Summary document – 2021 Update
This short report provides an update to the Children’s Joint Strategic
Needs Assessment and offers a snapshot of some of the key issues
affecting children and young people in Leicester.

Identified below are the main issues affecting each age group and where
data is available. Some issues may cross age bands.

       Pre-birth          0–4               5–9          10 – 14     15 – 19
                         Breast-
        Maternity                                 Hospital attendances
                         feeding
      Perinatal and infant mortality        Weight and obesity      Pregna ncy

        Smoking             School readiness                 Atta inment

                                       Mental Health

                                        Oral Health                      NEETS

                      Immunisations

               Conditions                    Lifestyle             Achievement

 Further information can be found at www.Leicester.gov.uk/jsna

                                                                                 3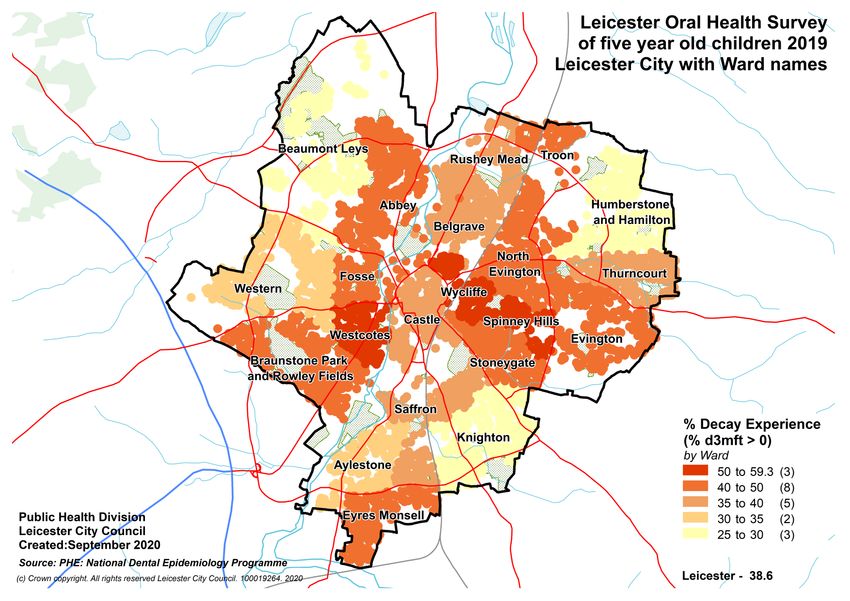
Highlights of the JSNA
                The city’s young age profile contributes to its vibrancy, but it
Population      requires the city to respond rapidly to meet demands for
                maternity services, health visiting and expanding school places.

                Deprivation has an important impact on children’s lives and
Child poverty
                health. Continuing to tackle child poverty, improve educational
and             attainment, boost jobs and the local economy will be crucial to
deprivation     improving the health of this generation’s children.
                There were 4,622 births in Leicester in 2019, and the city’s birth
                rate is similar to the national rate. The birth rate in under 18s is
Birth rate      significantly higher than England. The forecasted growth of our
                young population will need to be considered in local plans.

                Leicester faces significant challenges in protecting children who
Protecting      experience neglect, family breakdown or crisis. Child sexual
children        exploitation and female genital mutilation are also key priorities.

                High rates of childhood obesity and poor oral health
Physical        demonstrate the need for focused work to improve children’s
health          diet and levels of physical activity across the city.

                As a city with high rates of deprivation, inequality and variable
Mental          attainment in school, the risk factors for poor mental health in
wellbeing       Leicester’s children are high.

                Children and young people at risk of offending or within the
Youth           youth justice system often have more unmet health and social
offending       care needs than other children. It is therefore important that
                their needs are included in mainstream planning and
                commissioning.

                Gypsies and Travellers are a vulnerable group with the lowest life
Gypsies and     expectancy of any group in the UK. Leicester has a small
Travellers      population of Gypsies and Travellers, but their access to and
                uptake of important health services is poor.

                Services for children in the city are undergoing a period of
Children's      change. The JSNA provides important evidence about key health
services        outcomes for children and is a resource for future planning.
                                                                                 4
2. Leicester’s 0 to 19 population: Age,
      gender, ethnicity, language, SEN.
      Over a quarter (96,117) of Leicester city residents are aged 0-19. Leicester
      has larger proportions of younger people compared to England.

             Leicester (and England) population by age and gender

 5.8%                                              20-24                                              5.4%

                     3.4%                          15-19                                  3.4%

                       3.3%                        10-14                                3.1%

                    3.5%                           05-09                                  3.5%

                    3.6%                           00-04                                 3.3%

 6.0%               4.0%            2.0%                  0.0%              2.0%            4.0%      6.0%
                      Leicester Males 2019                                Leicester Females 2019
                      England Males 2019                                  England Females 2019

                        Since 2002 Leicester’s overall population has increased by 22%
                        this is a faster rate than most other major English cities.

                                 0 to 19 % Population Projection
12%
                                                                                        The 0 to 19
10%                                                                                     population is also
8%                                                                                      forecast to grow at a
6%                                                                                      faster rate than
4%                                                                                      England and some of
2%                                                                                      our comparator
0%                                                                                      authorities.
          2017         2020        2025         2030         2035         2040

                    Leicester                    Child Comparators                      England
                                                                                                       5
Source: ONS Mid year estimates 2018, ONS Population projections (2016 based)
About 57,500 children attend Leicester schools, most of these are
    resident in the city. The school population is diverse, many are from
    deprived backgrounds and some have complex special educational needs.

                                Ethnicity of children attending Leicester schools
      32%
              24%

                      6% 6% 4% 4%
                                  3% 3% 3% 2% 2% 2% 2% 1% 1%

          55% of                                                            There are a
     Leicester pupils                                                       total of 184
     speak English as                                                   different languages
      an additional                                                       spoken at pupil
         language                                                              homes

 Free School Meals                                            22.2%   22.2% of Leicester pupils
                                                                      claim free school meals and
                                                                      more may be eligible.

                                                                      11.4% of Leicester pupils
         SEN Support                                  11.4%
                                                                      have some SEN support.

                                                                      3% of Leicester pupils have
                                                                      an Education, Health & Care
              EHC Plan                  3.0%                          Plan.
                                                                                           6
Source: Leicester City Council School Census (October 2020)
3. Child deprivation and poverty
Child Poverty measure Leicester England
1. Child poverty after housing costs 41% 30% (UK)
2. Income deprivation affecting
22.8% 20%
children index (IDACI), 2019
3. Children in absolute low income
22.3% 15.3%
families (under 16)
4. % Eligible and claiming free school
19.4% 17.3%
meals
Significantly better than England Significantly worse than England
7
Source: 1. End Child Poverty (2019), 2. Department of Communities and Local Government (2020), 3. Child Health Profiles PHE,
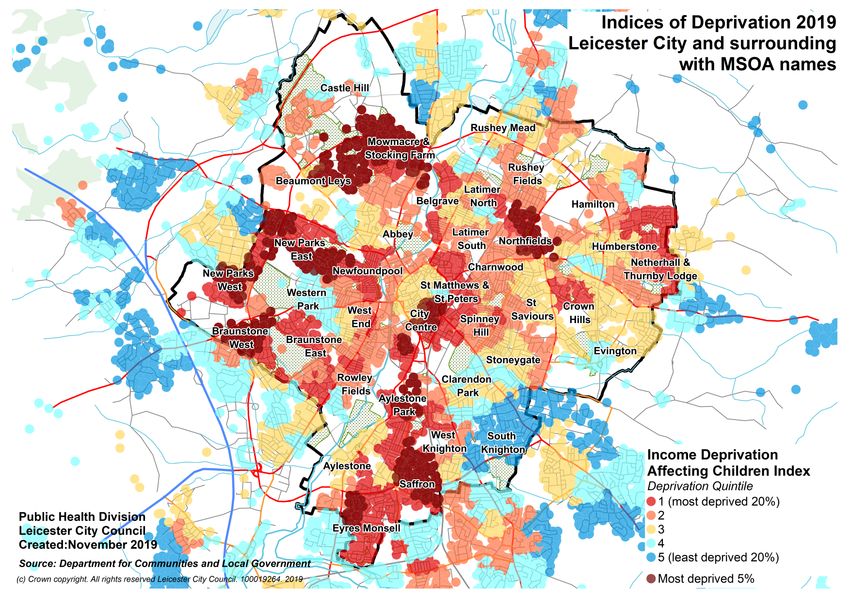
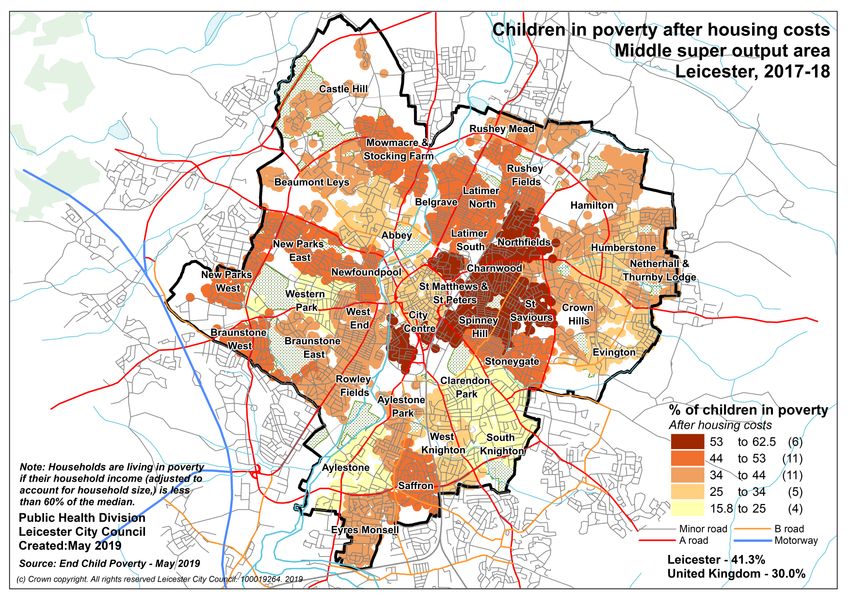
4. School Census (January 2020)Child poverty datasets highlight different areas of the city being most in
need.
The Child Poverty map (previous page) reveals that in areas east of the city
centre an estimated 50% or more are living in poverty.
Whereas the IDACI map (above) highlights areas known for higher
concentrations of social housing such as New Parks, Mowmacre and
Stocking Farm, and Eyres Monsell.
Local surveys Those living with children are significantly more
have revealed: likely to run out of money before the end of the
month
24% of Leicester children are worried about having
enough money
19% are worried about having enough to eat
Source: DCLG (2019), Leicester City Health and Wellbeing survey (adults) (2018), Children and Young People Health and 8
Wellbeing Survey (2016)4. Life expectancy and deprivation
Life expectancy at birth in Leicester has been improving but more recently
has started to plateau.
Life expectancy at birth: Leicester and England
83
82 82
80 80
78 78
76
2007 - 2008 - 2009 - 2010 - 2011 - 2012 - 2013 - 2014 - 2015 - 2016 - 2017 -
09 10 11 12 13 14 15 16 17 18 19
England females Leicester females England males Leicester males
Those born in our more deprived areas have significantly shorter life
expectancies compared to those born in our least deprived areas.
7 year life 6 year life
expectancy expectancy
gap F gap 85
81
E years
M 74 years 79
years M years
A
L A
E L
S E
S
Most Least Most Least
deprived deprived deprived deprived
Source: ONS Life expectancy data (2019),
95. Infant Mortality and Maternity
Infant mortality rate (per 1,000 live births)
8
deaths under 1 year per 1,000 live births
7
6
5
4
3
2
1
0
2006 - 2007 - 2008 - 2009 - 2010 - 2011 - 2012 - 2013 - 2014 - 2015 - 2016 - 2017 -
08 09 10 11 12 13 14 15 16 17 18 19
England Leicester Significantly worse than England
Infant mortality rates in Leicester continue to be significantly higher than
England, but similar to our comparator authorities. There are higher rates of
under 18 conceptions and low birth weights in the city compared to England.
Maternity Indicators Leicester England
1. Under 18 conceptions (per 1,000
20.8 16.7
15-17 year old women), 2018
2. Smoking at time of delivery, 2019/20 10.4 10.4
3. Low birth weight of term babies (%),
4.5 2.9
2018
4. Breastfeeding prevalence at 6-8
60.3 48.0
weeks after birth, 2019/20
Significantly better than England Significantly worse than England
10
Source: ONS Mortality (2019) 1. ONS Births (2019), 2. NHS digital – SATOD (2018/19), 3. PHE Child Health
Profiles, 4. National Child Maternal Health Intelligence Network (2018/19)6. Early years health and wellbeing
Our early years population experiences a number of health and
wellbeing challenges around immunisations, childhood development, oral
health and obesity.
Vaccine and immunisation coverage in Leicester tends
to be similar or significantly better than the
national average.Vaccination coverage for MMR at
5 years old is significantly worse than the local average.
The percentage of Leicester 5 year olds achieving a
good level of development has increased over recent
years, however we continue to be significantly
behind the national average for good level
of development.
39% of Leicester 5 year olds have dental
decay experience, compared to 23% in England.
This has reduced significantly over recent years.
When starting school, around one in five
Leicester 5 year olds are either overweight
or obese. This is similar to national rates. Areas in
the North West and West of the city report higher
rates of excess weight.
11
Source: NHS Digital, DfE – EYFS, PHE Oral health Survey 2019, NCMP (2019)Early years indicators Leicester England
1. 0-4 year old A&E attendances (rate per 1,000)
643.9 655.3
(2018/19)
2. Children with one or more decayed, missing or filled
38.6 23.3
teeth (% 5 year olds) (2019)
3. Population vaccination coverage – Dtap/IPV/Hib (% of
93.9 93.8
2 years old) (2019/20)
4. Population vaccination coverage – MMR for two doses
86.7 86.8
(% of 5 years old) (2019/20)
5. School readiness: % of children achieving a good level
67.7 71.8
of development at the end of reception (2018/19)
6. Reception: % Excess weight (overweight/obese)
19.4 23.0
(2019/20)
7. Reception: % Underweight prevalence (2019/20) 3.0 0.9
Significantly better than England Significantly worse than England
12
Source: 1. HES (2017/18), 2. PHE Oral Health Survey (2019), 3. NHS Digital (2018/19), 4. NHS Digital
(2018/19), 5. DFE – EYFS (2017/18), 6. NCMP (2018/19), 7. NCMP (2019/20)7. Childhood obesity, diet and physical
activity
Childhood obesity in Leicester continues to be a significant challenge.
Excess weight rates double from reception to year 6.
Year 6
Local surveys have Around one quarter of children eat 5 or more fruit
revealed: and vegetable portions a day.
Most children eat home cooked food but around
one in ten have a take-away meal on most days.
Half of children did no vigorous exercise that lasted
more than an hour in the last seven days. This
shows half of children are not completing the
physical activity recommendation.
Around one third of children arrived to school by
car. 13
Source: NCMP, Leicester Child Health and Wellbeing Survey (2016/17)Childhood obesity, diet and physical
Leicester England
activity indicators
1. Year 6: % Excess weight (Overweight/obese) 38.4 35.2
2.Year 6: % Obese 23.8 21.0
3.Year 6: % Severe obese 6.0 4.7
4. % of children eating five or more portions of
23% n/a
fruit and vegetables
5. % of children having no fruit or vegetables a
11% n/a
day
6. % of children eating a takeaway on most days
8% n/a
of the week
7. % of children drinking an energy drink on
9% n/a
most days
8. Fast food outlets (rate per 100,000
137.6 96.5
population)
9. % of children completed no days of vigorous
35% n/a
exercise
10. % of children who have completed more
20% n/a
than 3 days of vigorous exercise.
11. % of children who actively travel for part of
70% n/a
their journey to school
Significantly better than England Significantly worse than England
14
Source: 1-3 NCMP (2019/20), 4-7/9-11 CYP Health and Wellbeing Survey (2016), 8. PHE (2019/20)8. Child mental health and wellbeing
One in ten children aged 5-16 years has a mental health problem and, of
adults with long-term mental health problems, half will have experienced
their first symptoms before the age of 14.
Failure to treat mental health disorders in children can have a devastating
impact on their future, resulting in reduced job and life expectations.
1 in 4 children have a parent at 1 in 4 adults in mental health
risk of mental health problems. care is likely to be a parent.
Local surveys have revealed some important information about children and
young peoples emotional health and wellbeing:
A quarter A third
show poor never talk
resilience about
feelings
Older
children are
One in ten more at risk 4% say they
have no adult self harm
confidant to deal with
stress
15
Source: NHS digital, Leicester Child Health and Wellbeing Survey (2016/17)9. Looked after children
In Leicester there are currently 611 Looked After Children.
The rate for Leicester is significantly worse (higher) in comparison to the
national rate of 65 (per 10,000 pop aged under 18).
Looked After Children are more at risk of poor health and wellbeing
outcomes. A needs assessment has been completed to review the health and
wellbeing needs of this vulnerable group.
More likely
A quarter
to drink
receive SEN
alcohol and
support
take illicit
substances
One in ten
12-18 year olds
A third of regularly
At risk of
12-18 year olds smoke
delayed skills
admitted and slow
smoking development
10. Further information
More detailed analysis can be found in the Children’s Joint Strategic Needs
Assessment.
Further information can be found at www.Leicester.gov.uk/jsna
The latest child health profiles data for Leicester can be found at
https://fingertips.phe.org.uk/profile/child-health-profiles
16
Source: Leicester City Council LAC Needs Assessment (2019)You can also read