FY Ending March 2020 2Q Results Presentation
←
→
Page content transcription
If your browser does not render page correctly, please read the page content below

FY Ending March 2020
                                                                                              2Q Results Presentation
                                                                                                                        Oct 31, 2019

[Disclaimer]
The contents of this material and comments made during the questions and answers etc. of this
briefing session are the judgements and projections of the Company’s managements based on
currently available information.
These contents involve the risk and uncertainty and the actual results may differ materially from them.   © SEGA SAMMY HOLDINGS INC. All Rights Reserved.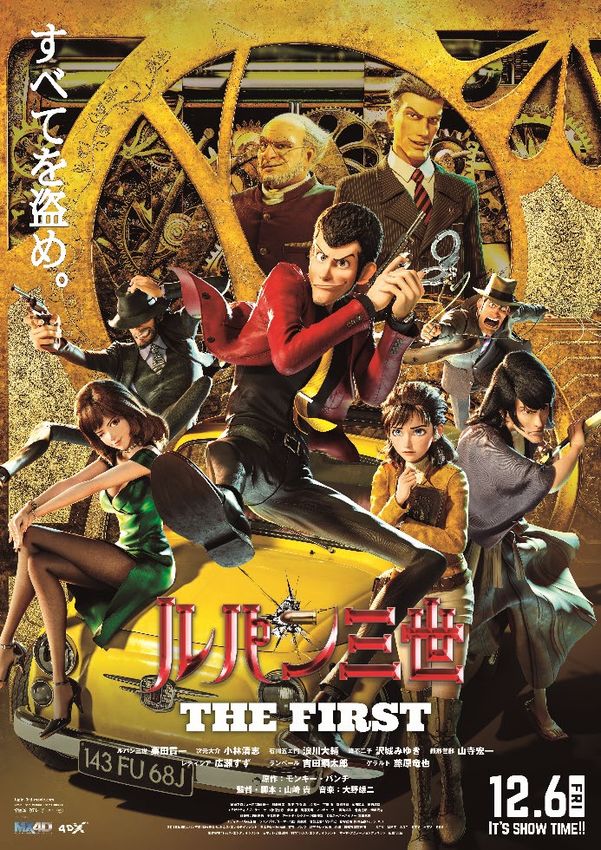
1. Fiscal Year Ending Mar 2020, 2Q Results / Full Year Forecasts
Results Highlights
(JPY Billion)
2019/3 2020/3
Results Full Year Results Full Year
Through 2Q Results Through 2Q Forecast 2020/3 2Q Results
Sales 171.0 331.6 165.5 390.0
Profits increased while sales decreased YoY.
Operating Income 10.2 13.0 14.6 27.0
Sales decreased mainly due to the decreased sales
Operating Income Margin 6.0% 3.9% 8.8% 6.9% unit in Pachislot and Pachinko machines
Non-operating income 1.3 2.1 1.3 1.5 Profits increased because of the strong
performance in Entertainment Contents Business
Non-operating expenses 2.3 7.7 3.3 5.5
centered on Digital Games area
Ordinary Income 9.1 7.4 12.6 23.0
Extraordinary income 1.7 8.2 0.0 - 2020/3 Forecast
Extraordinary losses 0.2 8.7 0.1 - As several major titles will be launched in each segment in
stages, need to carefully observe the sales status.
Income before income taxes 10.6 6.9 12.5 23.0
Profit (loss) attributable to
6.7 2.6 9.8 15.0
owners of parent
ROA※ - 0.6% - -
* ROA = Profit attributable to owners of parent / Total assets
*For more details, please see “ FY Ending March 2020 2Q Result / Appendix”
-3-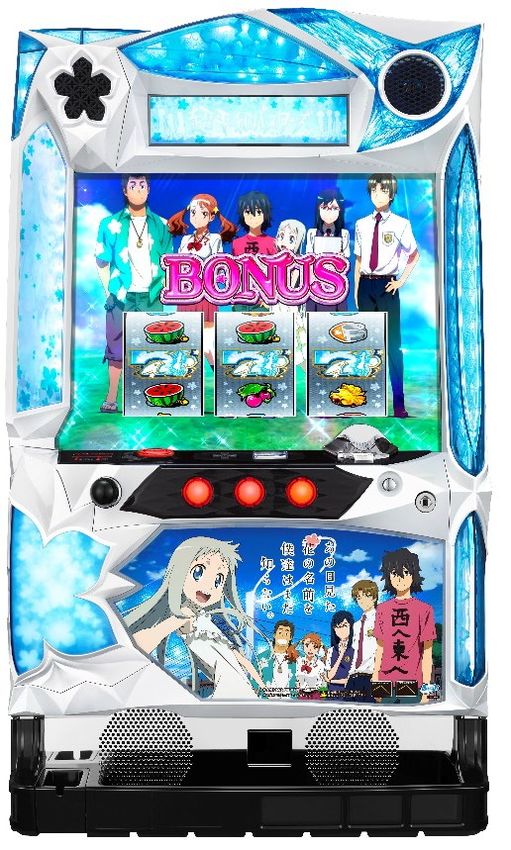
Breakdown of Income
                                                   (2020/3 2Q Results )
(JPY Billion)

                Break down of non-operating income / losses
                                                                (JPY Billion)

                Non-operating income                                  1.3
                  Interest income                                     0.1
                  Dividends income                                    0.2
                  Gain on investments in partnership                  0.4
                  Other                                               0.6

                Non-operating expenses                                3.3
                  Interest expenses                                   0.2
                  Equity in losses of affiliates                      2.1
                  Other                                               1.0

                                                                                -4-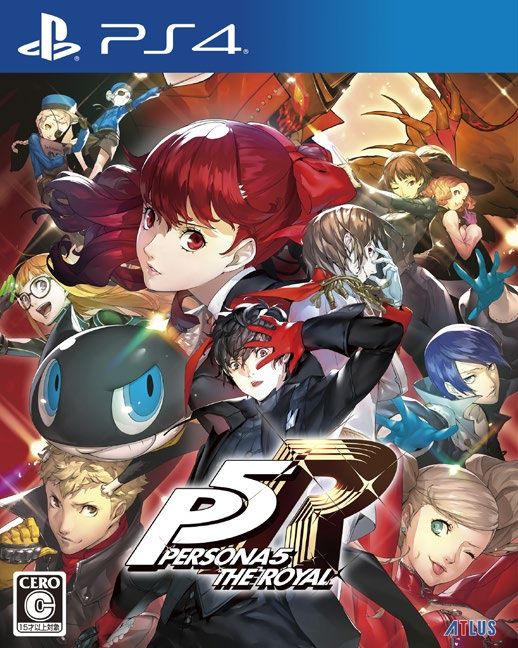
Consolidated Costs and Expenses
                                                                      (JPY Billion)

                               2019/3                      2020/3
                       Results       Full Year     Results       Full Year                2020/3 2Q results / main factors
                     Through 2Q       Results    Through 2Q      Forecast

R&D Expense /                                                                         Increased in association with the
Content Production          30.8          66.6          33.5          72.5            launch of new titles in Packaged
Expense                                                                               Games area

                                                                                      Decreased in association with the
Cap-ex                      17.8          34.4          10.5          24.8            completion of relocation of headquarter

Depreciation                 7.4          14.5           7.3          13.6            -

Advertising                  8.4          16.0           8.5          21.0            -

                                                                                                                                -5-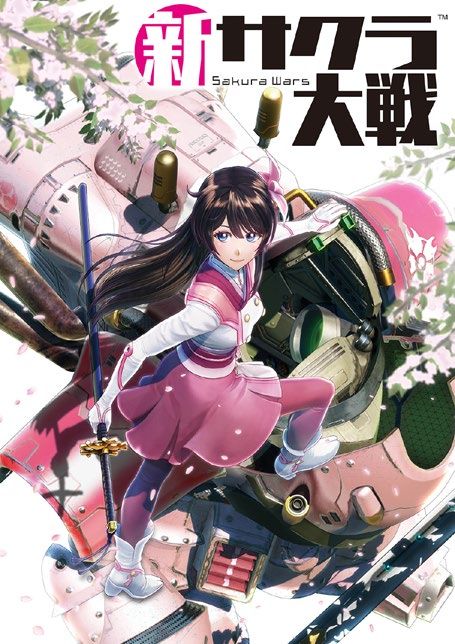
Consolidated Balance Sheet                                                   (JPY Billion)
                                                                                                 Consolidated Balance Sheet
                                    As of end of
                                    March 2019
                                                        As of end of
                                                      September 2019
                                                                           Change                                 Summary
 Total Current Assets                        260.4             238.6             -21.8
            Cash and Deposits                137.4               82.4            -55.0                Main factors                                                  Changes
            Securities                         14.5              33.2           +18.7
                                                                                                      Current Assets                                                      -21.8
 Total Noncurrent Assets                     204.1             201.1                -3.0              Cash and deposits decreased due to
 Total liabilities and net assets            464.6             439.7             -24.9                acquisition of securities and
 Total Current Liabilities                     87.5              77.9               -9.6              repayment of interest-bearing debt, etc.
            Corporate Bonds                    12.5              10.0               -2.5
 Total Noncurrent Liabilities                  71.7              59.2            -12.5                Non-current Assets                                                   -3.0
            Corporate Bonds                    10.0                    -         -10.0                Investment securities decreased due to
                                                                                                      market valuation but tangible fixed assets
 Total Liabilities                           159.3             137.2             -22.1
                                                                                                      increased in association with change of
 Total Net Assets                            305.3             302.5                -2.8              accounting regulation in some overseas
 Total Liabilities and
 Net Assets
                                             464.6             439.7             -24.9                subsidiaries

                                    As of end of        As of end of
                                                                           Change
                                    March 2019        September 2019
                                                                                                      Liabilities                                                         -22.1
 Cash and cash equivalents                    148.0             110.1               -37.9
                                                                                                      Decreased due to redemption of
 Interest bearing debt                         76.1              54.5               -21.6
                                                                                                      corporate bond and repayment of loans
 Net cash                                      71.8              55.6               -16.2             payable
 Equity Ratio                                65.1%             68.1%            +3.0pt

                                                                                             *For more details, please see “ FY Ending March 2020 2Q Result / Appendix”
                                                                                                                                                                                  -6-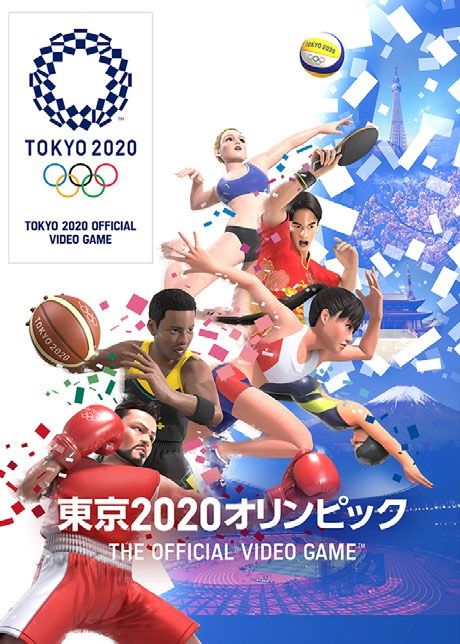
2. 2Q Results / Full Year Forecast per Segments
Pachislot and Pachinko
Sales
Operating Income
Operating Income margin
(JPY Billion)
2020/3 2Q Results
Machines Business
Sales unit decreased YoY while profitability improved.
Pachislot: Launched “Pachislot AnoHana: The Flower We Saw That Day”
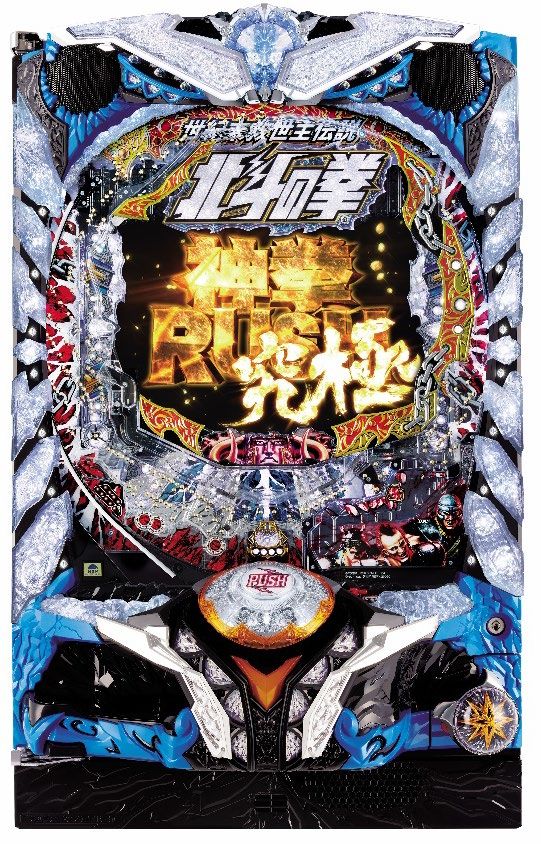
Pachinko: Launched a major title “P Hokuto No Ken 8 Haou”
2020/3 Forecast
Release major titles in line with the increase in demand for replacement of
Pachislot in 3Q but need to closely observe the sales status.
Pachislot: Launch major titles such as “Pachislot Hokuto No Ken Tenshou,”
“Pachislot Psalms of Planets Eureka Seven 3 HI-EVOLUTION
ZERO” and etc.
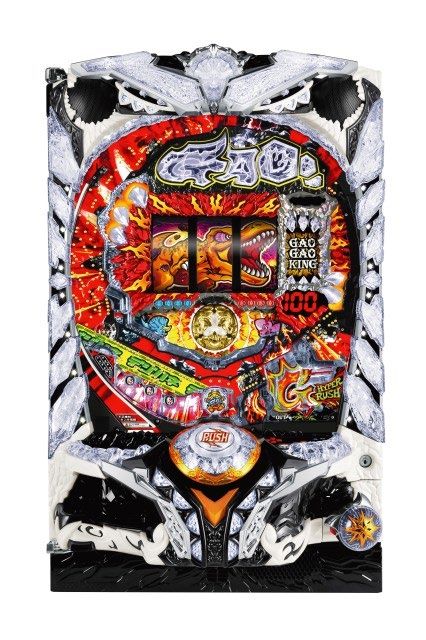
Pachinko: Release multiple titles including “P GAOGAOKING 3”
(Sales units transition)
2019/3 2019/3 2020/3 2020/3
2Q Full Year 2Q Full Year
Results Results Results Forecasts
Pachislot 12,853 67,140 28,360 120,000
Pachinko 117,891 159,848 66,140 164,000
Board + Frame 77,518 91,858 15,850 78,600
Board 40,373 67,990 50,290 85,400
-8-
Pachislot and Pachinko
                                                                                      Machines Business
         Major titles in 2Q                                                        Titles in and after 3Q
 Pachislot Machine            Pachinko Machine                     Pachislot Machine                     Pachinko Machine

    “Pachislot AnoHana:        “P Hokuto No Ken 8                  “Pachislot Hokuto No Ken                  “P GAOGAOKING 3”
The Flower We Saw That Day”          Haou”                                 Tenshou”
 ©ANOHANA PROJECT ©Sammy       ©Buronson & Tetsuo Hara/NSP 1983,     ©Buronson & Tetsuo Hara/NSP 1983,     ©Sammy
                               ©NSP 2007 Approved No.YSE-020         ©NSP 2007 Approved No.YAF-420
                               ©Sammy                                ©Sammy

                                                                                                                                -9-
Entertainment Contents Business
Sales
(JPY Billion)
Operating Income
Operating Income margin
2020/3 2Q Results
Strong performance overall in business segment centered on Digital
Games area.
Recorded revenues from offering titles in Digital Games area
Expenses of Digital Games area decreased due to impairment
loss recorded in previous fiscal year
Sold “Mega Drive Mini,” etc. and sales of new tiles and repeat
titles performed solidly in Packaged Games area
2020/3 Forecast
Need to observe the sales trend as multiple new major titles are
scheduled to be launched in 3Q mainly in Packaged Games area.
- 10 -Digital Games
Sales
(JPY Billion)
Operating Income
Operating Income margin
2020/3 2Q Results
Profit significantly improved YoY.
Recorded revenues from transfer of titles in Digital Games
area in 1Q
Recorded revenues from offering titles to Apple Arcade in 2Q
Expenses decreased due to impairment recorded in previous
fiscal year
Steady performance of existing titles.
Launched multiple new titles.
“Fist of the North Star LEGENDS ReVIVE”
“Kemono Friends 3,” etc.
2020/3 Forecast
Strengthen operation of existing titles.
Continue to optimize the scale of operation.
- 11 -Digital Games
Major topics in 2Q
Launched service of multiple titles
“Fist of the North Star LEGENDS ReVIVE”
“Kemono Friends 3” “LEAGUE OF WONDERLAND”
©Buronson & Tetsuo Hara/NSP 1983, Approved No. GC-218
©SEGA ©Kemono Friends Project2G ©SEGA ©SEGA
- 12 -Packaged Games
Sales (JPY Billion)
Operating Income
Operating Income margin
2020/3 2Q Results
Solid performance with new titles and repeat sales.
Sold “Mega Drive Mini” globally (released in Oct 2019 in Europe)
2020/3 Forecast
Need to closely observe the sales status as we launch multiple new titles.
“PERSONA 5 THE ROYAL”: Released in Oct, 2019
“Mario & Sonic at the Olympic Games Tokyo 2020TM”: To be released
in Nov, 2019
“New Sakura Wars”: To be released in Dec, 2019
“Ryu ga Gotoku 7”: To be released in Jan, 2020
Unit sales of Packaged Games (Thousand units)
2019/3 2019/3 2020/3 2020/3
2Q Full Year 2Q Full Year
Results Results Results Forecasts
New titles 1,880 4,090 3,560 10,690
Repeat titles 9,300 19,350 7,810 14,500
Total 11,180 23,440 11,370 25,190
- 13 -Packaged Games
Major titles in 2Q Major titles in and after 3Q
“Mega Drive Mini” “Olympic Games Tokyo 2020 - The Official Video Game” “PERSONA 5 ROYAL” “New Sakura Wars”
©SEGA
©SEGA TM IOC/TOKYO2020/USOC 36USC220506. ©ATLUS ©SEGA All rights reserved.
©2015 CAVE Interactive CO.,LTD.
©2019 IOC. All Rights Reserved.
©SEGA.
“Mario & Sonic at the Olympic Games Tokyo 2020TM”
TM IOC/TOKYO2020/USOC 36USC220506.
©2019 IOC. All Rights Reserved.
©NINTENDO. ©SEGA.
- 14 -Amusement Machine Sales
Sales (JPY Billion)
Operating Income
Operating Income margin
2020/3 2Q Results
Sales of prize machine remained steady while utilization of video games
went below expectation.
Common fixed expenses increased accompanied by relocation of
headquarter.
Started the installation of casino machines in state of Nevada.
2020/3 Forecast
Launch new series of major title “StarHorse”.
“StarHorse4”: To be in service in end Nov, 2019
- 15 -Amusement Center Operations
Sales
(JPY Billion)
Operating Income
Operating Income margin
2020/3 2Q Results
Solid performance centering on prize machines.
Sales at existing stores exceeded 100% YoY for the fifth consecutive fiscal
year.
Store openings: 3 Closings: 1
2020/3 Forecast
Open new stores (scheduled store openings: 4 closings: 1 in 3Q).
Estimate the impact of consumption tax hike from October.
Domestic amusement centers: No. of stores / YoY sales ratio comparison
2019/3 2019/3 2020/3 2020/3
2Q Full Year 2Q Full Year
Results Results Results Forecasts
No. of stores 189 190 192 195
YoY Sales Ratio
comparison (%) 104.5 104.0 103.6 104.4
- 16 -Animation / Toys
Sales
(JPY Billion)
Operating Income
Operating Income margin
2020/3 2Q Results
Both sales and profits increased YoY.
Animation: Recorded allocated revenue of movies.
Box office revenue of “Detective Conan The Fist of Blue
Sapphire” breaks the record of past series
Toys: Sold new products and regular products.
2020/3 Forecast
Animation: Record allocated revenue of movies and revenue from
video distribution, etc.
Schedule to release theatrical version of “Lupin The Third THE
FIRST” on Dec 6, 2019
Toys: Promote sales towards the holiday shopping season
To release new products including “WHO are YOU?” series
and “YUME-PETS coming babies”
- 17 -Animation / Toys
Topics in and after 3Q
Theatrical version of Toys: “WHO are YOU?Real Rescue”
“Lupin The Third THE FIRST”
Designed&Ⓒ2019Worlds Apart Ltd. All Rights Reserved.
©Monkey Punch/2019 Movie ⒸSEGATOYS
“Lupin The Third” Production Committee
- 18 -Resort Business
Sales
(JPY Billion)
Operating Income
2020/3 2Q Results
Profitability of PHOENIX RESORT improved while expenses for
domestic Integrated Resort (IR) increased, resulting increase of
losses.
2020/3 Forecast
Continue efforts to improve profitability of existing facilities.
Expect increase of expenses as the measures towards participating into
domestic IR will be activated.
- 19 -PHOENIX RESORT
Sales
(JPY Billion)
Operating Income
Operating Income margin
2020/3 2Q Results
Number of users increased due to various measures, etc.
despite the impact of repeated natural disasters.
Various measures during summer vacation
Promotion measures targeting the Kyushu area
Measures to strengthen repeat sales targeting members
2020/3 Forecast
Continuously implement various promotion activities and strengthen
customer base to improve profitability.
Seagaia 25th anniversary project
Measures towards New Year’s holiday
Implement measures to boost golf and MICE use.
- 20 -PHOENIX RESORT
25th Anniversary of SEAGAIA
- 21 -PARADISE SEGASAMMY
Transition of Drop* amount at Paradise SegaSammy
(Equity method affiliate)
(KRW Billion)
(KRW Million)
FY2019 2Q FY2020 2Q
Results Results
Sales 129.5 196.4
Casino 109.1 161.1
Hotel 20.4 28.3
Other - 7.0
Cost of sales 116.8 182.1
Casino 72.8 93.1
Hotel 43.9 57.4
Other - 31.5
Gross profit 12.7 14.3
SG&A 14.1 26.4
Operating profit -1.4 -12.0
EBITDA 16.0 19.4
Net profit -10.3 -27.6
Source: Paradise IR
SEGASAMMY
Equity method acquisition -0.7 -1.5
amount (Billion yen)
* PARADISE SEGASAMMY Co., Ltd. is an equity method affiliate of SEGA SAMMY HOLDINGS INC.
*Drop : The amount of cash exchanged for chips by customers at the table
* Figures for PARADISE SEGASAMMY Co., Ltd. are recorded with three months delay
- 22 -https://www.segasammy.co.jp/english/
Cautionary Statement for Investors and Shareholders with Respect to Nevada Gaming Statutes and Please visit below websites for products and service information.
Regulations https://www.segasammy.co.jp/english/pr/corp/group/list.html
SEGA SAMMY HOLDINGS INC. (“the Company”) is registered with the Nevada Commission as a publicly
(SegaSammy Group Website list)
traded corporation and has been found suitable to directly or indirectly own the stock of SEGA SAMMY
CREATION INC., and Sega Sammy Creation USA, Inc., both of which are subsidiaries that have been
licensed as manufacturers and distributors of gaming devices in Nevada. Pursuant to Nevada law, the * Company / product names in this document are trademarks or
Company’s shareholders are subject to the rules and regulations of the Nevada Gaming Authorities. A registered trademarks of the respective companies.
detailed explanation of Nevada gaming statutes and regulations can be found on the Company’s corporate
website:
https://www.segasammy.co.jp/english/ir/stock/regulation/You can also read