DATA FOR JULY 2019 - Published August 16, 2019 - Published August 16, 2019 Sales are down ...
←
→
Page content transcription
If your browser does not render page correctly, please read the page content below
Permission is granted only to ARMLS® Subscribers for reproduction with attribution on to “ARMLS® COPYRIGHT 2019”. For questions regarding this publication contact Brand@ARMLS.com.

                   DATA FOR JULY 2019 - Published August 16, 2019

                                                                                                                                                         Sales are down -1.3%
                                                                                                                                                         month-over-month.
                                                                                                                                                         The year-over-year
                                                                                                                                                         comparison is up +9.7%.

  Closed MLS sales with a close of escrow date from 7/1/2019 to 7/31/2019, 0 day DOM sales removed

                                                                                                                                         ARMLS STAT                  JULY 2019
1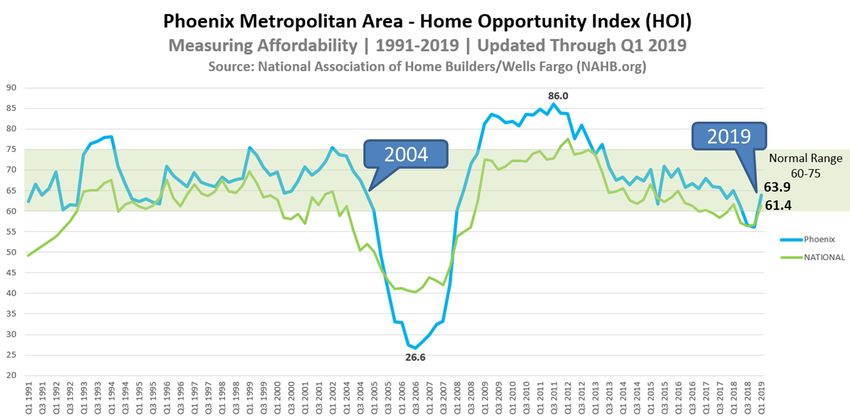
New inventory is down
                                                                                                                         -5.3% month-over-month
                                                                                                                         while the year-over-year
                                                                                                                         comparison decreased
                                                                                                                         by -2.8%.

    New MLS listings that were active for at least one day from 7/1/2019 to 7/31/2019, 0 day DOM sales removed

                                                                                                                         Total inventory has a
                                                                                                                         month-over-month
                                                                                                                         decrease of -9.0% while
                                                                                                                         year-over-year reflects
                                                                                                                         a decrease of -8.8%.

    Snapshot of statuses on 7/31/2019

2                                                                                                                ARMLS STAT    JULY 2019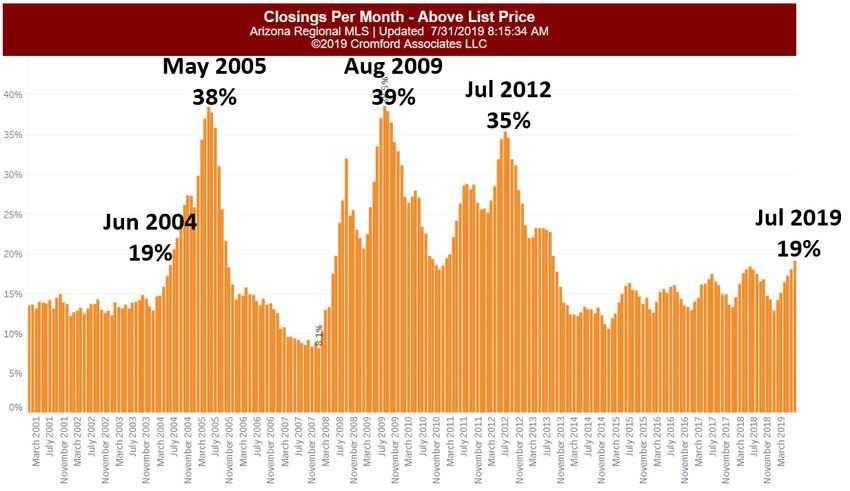
July UCB listings
                                                                                                                             percent of total inven-
                                                                                                                             tory was 20.3% with July
                                                                                                                             CCBS listings at 3.4% of
                                                                                                                             total inventory.+6.7%..

    Snapshot of statuses on 7/31/2019

                                                                                                                             Months supply of in-
                                                                                                                             ventory for June was
                                                                                                                             2.12 with July at 1.96.

    Current inventory of Active/UCB/CCBS divided by the monthly sales volume of JULY 2019, 0 day DOM sales removed

3                                                                                                                    ARMLS STAT     JULY 2019
Average new list prices
                                                                                                                                   are up +4.5% year-over-
                                                                                                                                   year. The year-over-year
                                                                                                                                   median is up +4.7%.

    List prices of new listings with list dates from 7/1/2019 to 7/31/2019, 0 day DOM sales removed

                                                                                                                                   The average sales price
                                                                                                                                   is up +6.6% year-over-
                                                                                                                                   year while the year-over-
                                                                                                                                   year median sales price
                                                                                                                                   is also up +5.7%.

    MLS sales prices for closed listings with a close of escrow date from 7/1/2019 to 7/31/2019, 0 day DOM sales removed

4                                                                                                                          ARMLS STAT     JULY 2019
A decrease is forecasted
in August for average
sale prices while August
median sale prices will
stay the same.
ARMLS proprietary predictive model forecast, 0 day DOM sales removed
Foreclosures pend-
ing month-over-month
showed a decrease of
-0.4% while the year-
over-year figure was
down -10.2%.
Snapshot of public records data on 7/31/2019 active residential notices and residential REO properties.
5 ARMLS STAT JULY 2019Distressed sales ac-
counted for 0.9% of total
sales, the same as the
previous month. Short
sales dropped -38.2%
year-over-year.
Lender owned sales
dropped -21.3% year-
over-year.7%..
New MLS listings that were active for at least one day from 7/1/2019 to 7/31/2019, 0 day DOM sales removed
Days on market were up
+3 days year-over-year
while month-over-month
went down by -2.
MLS sales prices for closed listings with a close of escrow date from 7/1/2019 to 7/31/2019, 0 day DOM sales removed
6 ARMLS STAT JULY 2019GUEST COMMENTARY by Tina Tamboer, Senior Residential Housing Analyst
It’s “Back to the Future” for the Greater Phoenix residential housing market as multiple measures begin to
resemble 2004, the precursor to the 2005 “Bubble”. (Insert dramatic music here) Just mentioning those two years
may trigger PTSD in those of us who lived through that period, unaware of the cliff that awaited us just 2 years later
when housing prices crashed 55% from 2007 through early 2009. Will that happen this time? Will we make the
same mistakes? Before we get into it, let’s talk about what’s similar to 2004 and then we’ll discuss what is not.
What is similar to 2004:
1) The relationship between Supply and Demand. In a short 5-month period, our Seller Market has gone from its
weakest measure in 3 years to its strongest measure since 2005. However, since 2005 was on the decline our
scenario today resembles 2004 more closely because the seller market was strengthening at nearly the same pace.
2004 2019
Seller’s Market
(Prices Rise)
Buyer’s Market
(Prices Fall)
7 ARMLS STAT JULY 2019GUEST COMMENTARY by Tina Tamboer, Senior Residential Housing Analyst
What is similar to 2004:
2) Drop in Supply. It may not look as dramatic to the casual observer, but supply hasn’t been this low since 2005.
However again, supply was rising in 2005 while it was declining in 2004 so the market today is more in line with
2004. Active supply is more complicated to count these days due to statuses like UCB or CCBS that keep MLS listings
in Active status accepting backup offers while they’re under contract. This practice was not prolific in 2004 and 2005
while today they make up 24% of the overall count. From this we can tell you that “true” active supply, counting only
listings that are not under contract, is significantly lower and declining at a similar rate to 2004.
2004 2019
8 ARMLS STAT JULY 2019GUEST COMMENTARY by Tina Tamboer, Senior Residential Housing Analyst
What is similar to 2004:
3) ARMLS Sales Volume. This past July outperformed 2004 in sales volume. In fact, 5 out of the last 7 months have
outperformed 2004, and May 2019 was a record month that outperformed both 2004 and 2005.
2004 2019
9 ARMLS STAT JULY 2019GUEST COMMENTARY by Tina Tamboer, Senior Residential Housing Analyst
What is similar to 2004:
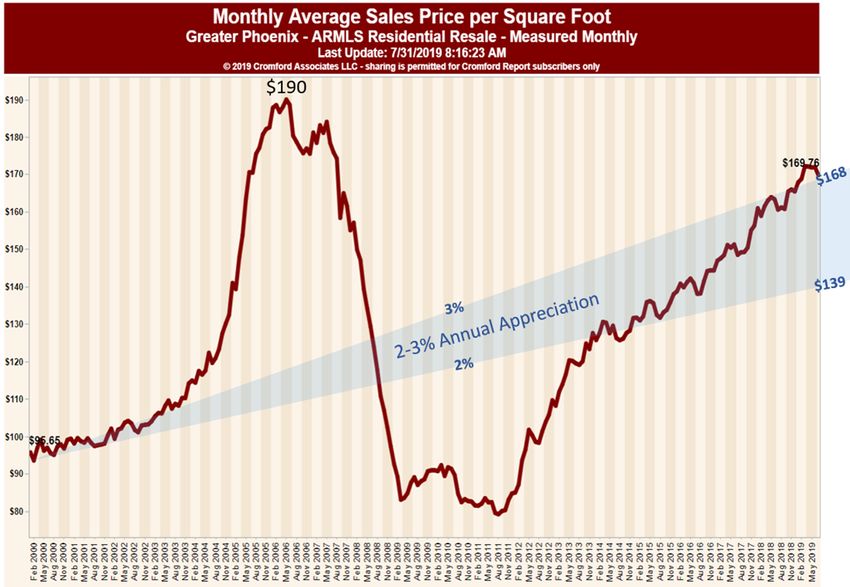
4) Price in Relation to Historical Inflation. The long-term average rate of inflation for the Greater Phoenix Area is
2.1%. Generally speaking, annual appreciation between 2-3% is accepted as a comfortable and sustainable rate to
keep up with wage growth and maintain a normal range of affordability. Greater Phoenix has not experienced an
appreciation rate that weak since 2014, but prices had dropped so low that the market could manage high
appreciation rates without affecting affordability. Today prices have risen higher than where they would’ve been had
the market followed a 3% annual return for nearly 20 years; also similar to 2004 when average prices pulled away
from the range of inflation. At 5.8%, the current appreciation rate is conservative compared to the last 8 years, but
because it’s surpassed the historical comfort zone sustainability and affordability are back into the debate.
2019
2004
10 ARMLS STAT JULY 2019GUEST COMMENTARY by Tina Tamboer, Senior Residential Housing Analyst What is similar to 2004: 5) Homes Sold Over Asking Price. July saw 19% of sales with sale prices over asking price, the highest since 2013. It’s not the highest percentage we’ve ever seen historically. The years between 2008-2013 were dramatically higher in sales over asking price, but back then homes were selling for less than the cost of a used car and it was a no- brainer to pay a little more and hold long-term. Over the past 4 years this measure has become more seasonal and July typically has the highest percentage of the year. Even though it will probably decline in August as contract activity cools, this measure is currently similar to 2004 and adding to our deja vu. 11 ARMLS STAT JULY 2019
GUEST COMMENTARY by Tina Tamboer, Senior Residential Housing Analyst
What is similar to 2004:
6) Affordability. It may surprise some people to see that affordability was still normal in 2004. It wasn’t until 2005
that things went wonky. The Home Opportunity Index measures the percentage of homes sold in the prior quarter
that were affordable to a family making the local median income under current lending practices. Greater Phoenix
has historically been higher in affordability than the national index and maintains that today; although the gap has
narrowed and was shaky in the last quarter of last year. The good news is that affordability is still within the normal
range with rising private sector earnings and amazingly low mortgage rates. However it’s still on the low end of the
normal range and could easily drop if earnings don’t keep up, mortgage rates increase, or prices rise too sharply.

 12                                                                                  ARMLS STAT          JULY 2019
GUEST COMMENTARY by Tina Tamboer, Senior Residential Housing Analyst
So what does this mean? Are we DOOMED to repeat the past

5 things NOT similar to 2004:
1) Demand. Demand is 6% above normal today. It was 26% above normal in 2004 and fueled by an extraordinary
     volume of flip investors. Today’s demand is fueled primarily by people who need a place to live and less by
     people who have no intention of living in the home and no intention of renting it to someone. The proliferation
     of 2004-2005 flip investors and speculators selling amongst themselves was dubbed “false demand” during the
     bubble. Financing for their activity began to dry up in 2006 leaving a ghost town of empty homes with no one to
     buy them. Last June, flip sales acquired and sold within a 6-month period only accounted for 7.6% of all sales.
     While significant, they’re not dominating the market.

2)    New Construction. Builders are not overbuilding and have filed only 12,028 single family permits through June
      this year. In 2004 they filed a whopping 27,561 within the same time frame. Multi-family permits are on the
      rise with 5,652 permits issued through June this year versus only 3,716 in the same time frame in 2004. Sales of
      newly constructed single family homes, townhouses and condos only made up 12% of total sales last June.

3)    Appreciation Rates. Annual appreciation rates per square foot are more modest today at 5.9% versus 11.3% in
      2004. Reasons for this may include more conservative appraisal practices implemented after the crash and a
      higher percentage of buyers who are unwilling or unable to bridge the gap between the appraised value and
      contract price.

 13                                                                                 ARMLS STAT         JULY 2019
GUEST COMMENTARY by Tina Tamboer, Senior Residential Housing Analyst
4) Short Term Rentals. When it comes to “false demand”, the newest activity to qualify is the short-term rental
investment. True housing demand is comprised of people who need to live in the home, whether as
homeowners or renters. When a buyer purchases real estate for the sole purpose of renting it weekly or as an
event venue, that is not housing demand. It’s tourism, which is often the first wave to go during a stormy
economic cycle. New regulations requiring the issuance of an Arizona Tax ID number for these investments may
give us better insight as to the degree they have infiltrated the market and what risk they pose to its stability.
5) Skepticism. This is one thing we did NOT have a lot of in 2004 and 2005. In fact, people were mostly euphoric
about the market back then and felt it would accelerate forever and ever. Today, the very presence of
skepticism and fear of another bubble mitigates the risk that we’ll see another one.
So no, we are not doomed to repeat the bubble. The reality is that we’re not afraid to repeat 2004, it’s the
rapid 45% appreciation rate of 2005 that sparks fear and hesitance. Many laws and industry changes have been put
into place since that time to avoid repeating history; changes that affected nearly every industry involved in
residential real estate. That’s what makes this time interesting to watch going forward. We have been here before,
but this time the industry is wiser. (I only wish I could have my age back too) Appreciation rates in Greater Phoenix
are forecasted to be positive for the rest of the year and into 2020. Enjoy the ride!
14 ARMLS STAT JULY 2019The Pending Price Index
Last month the STAT mathematical model projected a median sales price for July of $280,000. The July re-
ported median was $280,000. Looking ahead to August, the ARMLS Pending Price Index anticipates the medi-
an sales price will remain unchanged, projecting a median sales price of $280,000.
We begin August with 6,585 pending contracts; 3,661 UCB listings and 609 CCBS giving us a total of
10,855 residential listings practically under contract. This compares to 9,135 of the same type of listings one
year ago. At the beginning of August, the “pending” contracts are 18.83% higher than last year. There were 23
business days in August of 2018 and 22 this year. ARMLS reported 8,036 sales in August of 2018. We expect
sales volume will be higher this year, our guess is 8,450 sales.
15 ARMLS STAT JULY 2019You can also read


