How should we measure residential property prices to inform policy makers?
←
→
Page content transcription
If your browser does not render page correctly, please read the page content below
How should we measure residential property prices
         to inform policy makers?
         Dr Jens Mehrhoff*, Head of Section Business Cycle, Price and Property Market Statistics

*Jens
  ThisMehrhoff,  Deutsche
       presentation        Bundesbank,
                     represents          Statistics
                                the author’s        Department
                                             personal opinions and does not necessarily reflect the views of the Deutsche Bundesbank or its staff.
 14th Meeting of the Ottawa Group
 Tokyo, 20-22 May 2015
 Page 1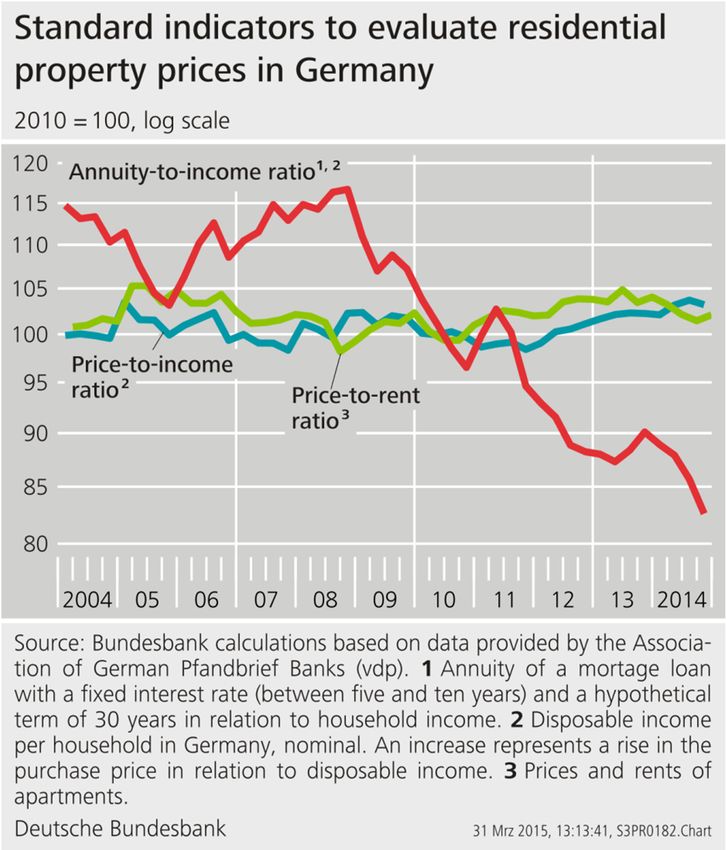
Structure of the presentation

1. Motivation and introduction

2. Composite indicators

3. The Bundesbank’s dashboard

4. Spatial dependencies

“Real estate prices (residential and commercial)” (Recommendation 19 of the G20
Data Gaps Initiative)

Jens Mehrhoff, Deutsche Bundesbank, Statistics Department
14th Meeting of the Ottawa Group
Tokyo, 20-22 May 2015
Page 2
1. Motivation and introduction

− Four stylised facts about the German residential property market:

   • About every third euro spent in Germany for private consumption purposes
     is spent on housing, including imputed rentals for homeowners.

   • Owner-occupied properties constitute the most significant asset of German
     households; the rate of home ownership in Germany equates to just
     44 %.

   • Hence, more than half of the German households are renters. Among the
     homeowners, two out of five have a mortgage.

   • The value of the property stock is an important part of the wealth of the
     German economy: gross fixed assets in housing stand at 265 % of GDP.

Jens Mehrhoff, Deutsche Bundesbank, Statistics Department
14th Meeting of the Ottawa Group
Tokyo, 20-22 May 2015
Page 3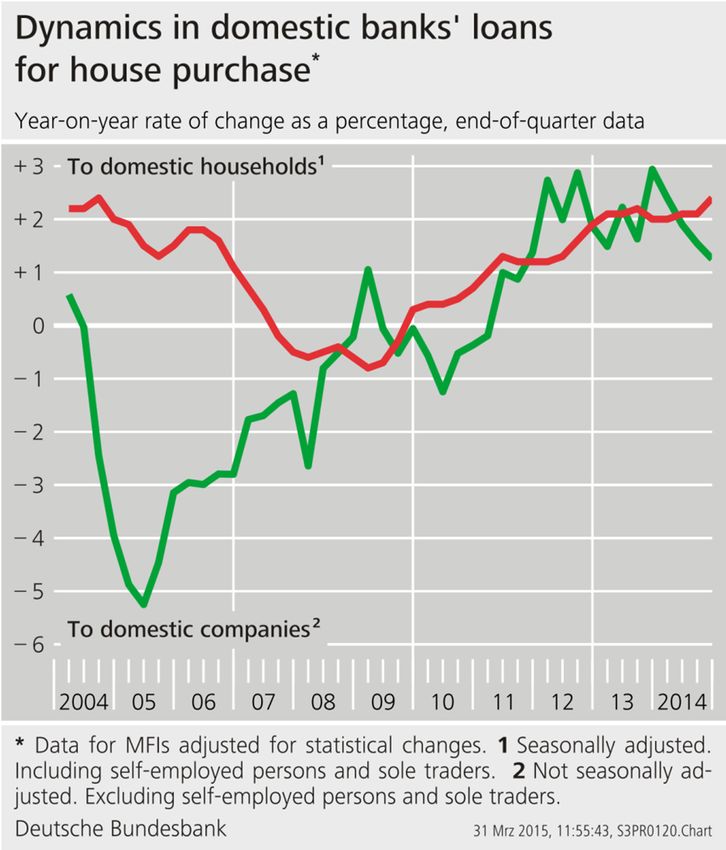
1. Motivation and introduction

− The various motivations for the analysis of house prices call for
  alternative measures to be applied.

   • Macroeconomic: identification of price signals, evaluation of monetary policy
     channels, volume measurement in National Accounts.

   • Macroprudential: assessment of asset price bubbles, build-up of risks in
     banks‘ credit exposures, financial soundness of private households.

   • However, these indicators can give different results, which could
     undermine their credibility for many users.

   • Yet, there should be no unique indicator. In order to determine whether
     threats to the economy or financial stability emanate from the housing
     market, the analyses should be based on a broad set of indicators.
Jens Mehrhoff, Deutsche Bundesbank, Statistics Department
14th Meeting of the Ottawa Group
Tokyo, 20-22 May 2015
Page 4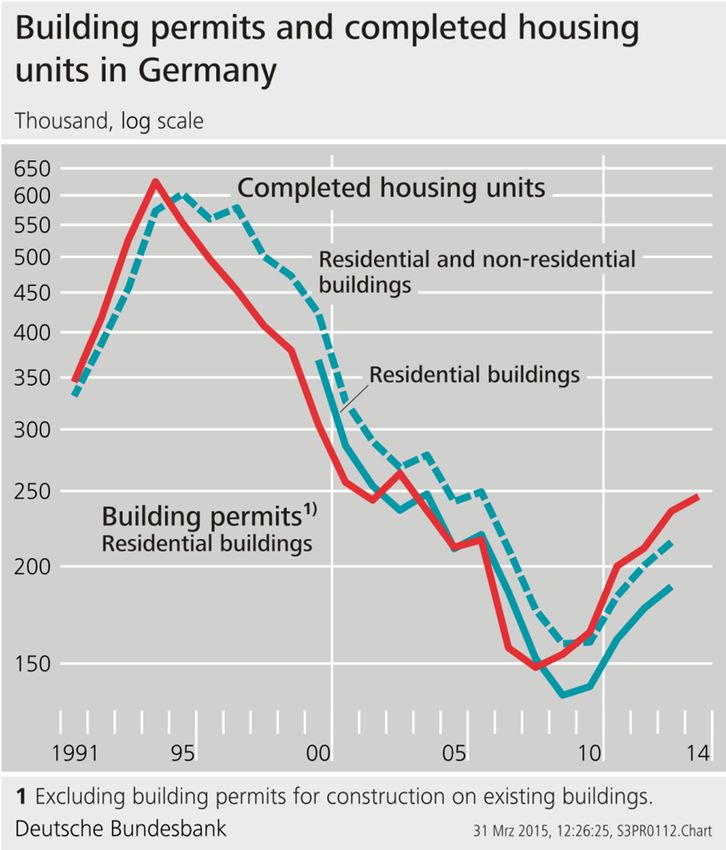
1. Motivation and introduction

− The diverse uses and associated methods of residential property price
  indices, the statistical framework for the compilation of such indices, as
  well as a dashboard comprising the three dimensions price, financial and
  real sector variables will be discussed.

   1. Price and valuation indicators: E.g. price-to-rent, price-to-income and
      annuity-to-income ratios.
   2. Loans to and debt of households: E.g. banks’ loans and interest
      payments.
   3. Construction and activity indicators: E.g. completed housing units and
      transactions.

   • Empirical results for the German residential property market will exemplify the
     usefulness of a multi-indicator approach in times of strong upward
     movements of price indicators.
Jens Mehrhoff, Deutsche Bundesbank, Statistics Department
14th Meeting of the Ottawa Group
Tokyo, 20-22 May 2015
Page 5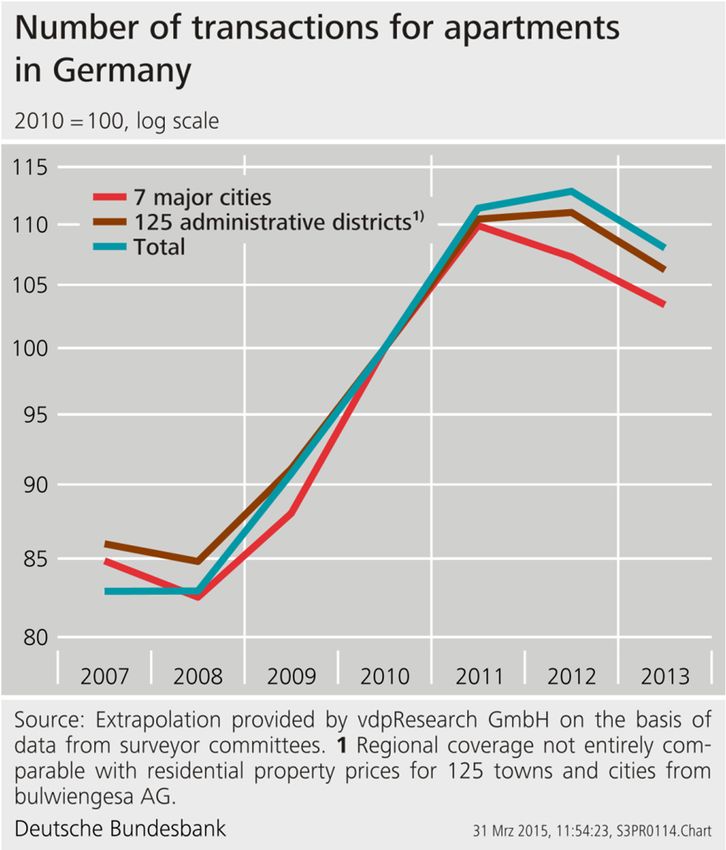
2. Composite indicators

− Composite indicators, on the other hand, aim to combine numerous,
  diverse indicators in a single number.

− They claim to reduce complex relationships to a supposedly simple
  measure.

− For aggregating base variables to a composite indicators one has to select
  suitable data first and, then, to derive the respective weights.

− It is not straightforward at all how the selection and weighting of the base
  variables should be performed:
  • Factor analysis maximises the explained variance of all base variables, the
     thus derived weights do not, however, represent relative importance.
  • Regression analysis minimises squared error to a given target indicator,
     whose existence makes the whole exercise somewhat obsolete.
Jens Mehrhoff, Deutsche Bundesbank, Statistics Department
14th Meeting of the Ottawa Group
Tokyo, 20-22 May 2015
Page 6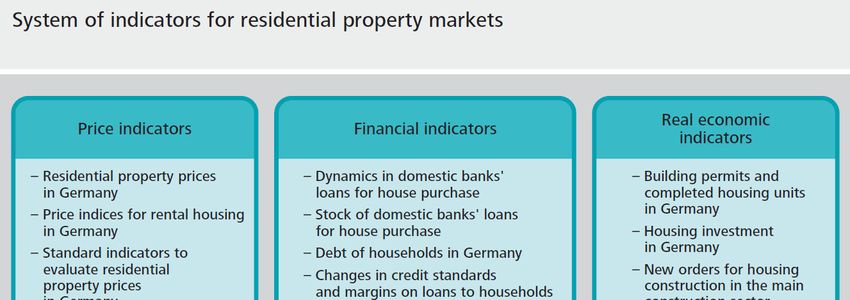
2. Composite indicators

− Hence, generally accepted and obvious selection procedures as well as
  weighting schemes cannot possibly exist.

− One composite indicator could use different base variables than another one;
  a third one could use the same base variables but apply a different weighting
  scheme.

− What is more, a composite indicator suggests substitutability between
  different base variables such that one would be indifferent between certain
  combinations.

− When the composite indicator is not constructed adequately or is not used
  so, the conclusions derived on that basis might be misleading and costly.

− Particularly with many base variables, their interpretation will be in conflict.
Jens Mehrhoff, Deutsche Bundesbank, Statistics Department
14th Meeting of the Ottawa Group
Tokyo, 20-22 May 2015
Page 7

2. Composite indicators

− The high dimensionality of a complex and diffuse phenomenon such as „the
  residential property market“ cannot adequately be reproduced by a
  composite indicator.

− Quite the contrary, the joint distribution of price, financial and real
  economic indicators seems to be at the centre of the current discussion.

− There is no simple answer to a complicated question; it might, thus, be
  better to look at a dashboard of indicators rather than to dissolve existing
  conflicts between base variables.

− Last but not least, statistics has a consulting function for policy makers –
  this makes it even more important to produce unbiased, easily
  interpretable and manageable measures.

Jens Mehrhoff, Deutsche Bundesbank, Statistics Department
14th Meeting of the Ottawa Group
Tokyo, 20-22 May 2015
Page 8

3. The Bundesbank’s dashboard

− The year 2010 saw a trend reversal in the German housing market, which
  was reflected in a sharp rise in prices.

− This situation needs to be addressed in light of the ongoing low-interest-rate
  environment.

− In order to determine whether threats to the economy or financial stability
  emanate from the housing market, the Bundesbank based its analyses on a
  broad set of indicators.

− This clearly shows that no statistical one-size-fits-all approach exists but
  that each subject matter has to be considered separately.

Jens Mehrhoff, Deutsche Bundesbank, Statistics Department
14th Meeting of the Ottawa Group
Tokyo, 20-22 May 2015
Page 9
3. The Bundesbank’s dashboard

Jens Mehrhoff, Deutsche Bundesbank, Statistics Department
14th Meeting of the Ottawa Group
Tokyo, 20-22 May 2015
Page 10
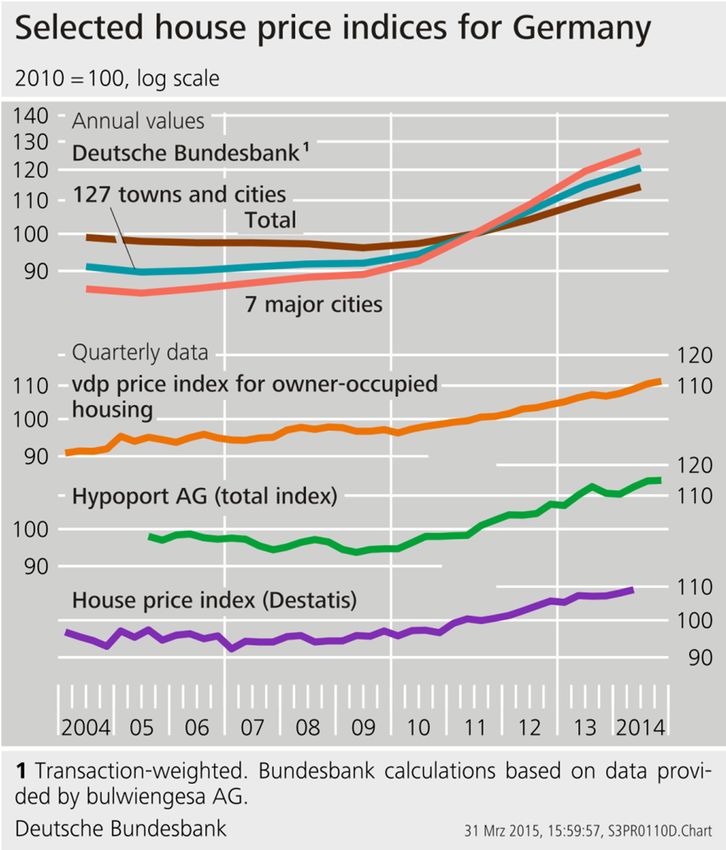
3. The Bundesbank’s dashboard
Prices have been rising since 2010, albeit with no acceleration recently.

Jens Mehrhoff, Deutsche Bundesbank, Statistics Department
14th Meeting of the Ottawa Group
Tokyo, 20-22 May 2015
Page 11
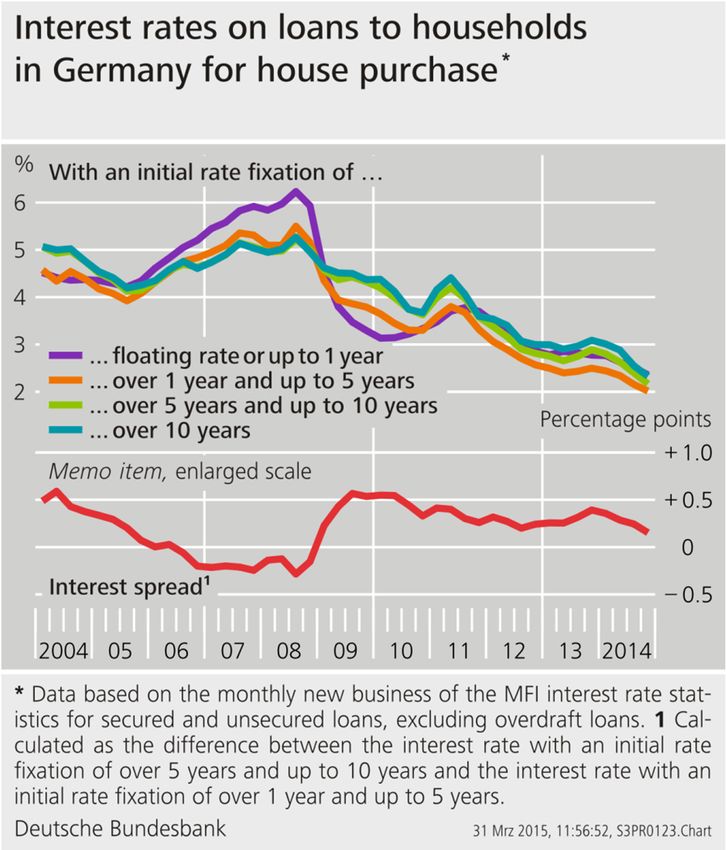
3. The Bundesbank’s dashboard

− The observed price movements do not, on their own, make it possible to derive
  any potential overvaluation or undervaluation. A benchmark would be
  required, but it cannot be specified unambiguously from a conceptual point
  of view, nor can it be observed directly.

− Price data going far back into the past contain statistical breaks. Averages of
  the standard indicators do not take account of medium and long-term trends.

− If prices as well as rents rise substantially, the price-to-rent ratio may remain
  largely unchanged. Conversely, the price-to-income ratio would shoot
  upwards.

− If the interest rate conditions for new mortgage loans are taken into account,
  a substantial improvement of affordability can be observed since the
  outbreak of the financial crisis.
Jens Mehrhoff, Deutsche Bundesbank, Statistics Department
14th Meeting of the Ottawa Group
Tokyo, 20-22 May 2015
Page 12
3. The Bundesbank’s dashboard
Price movements reflect the lagged expansion of the housing supply.

Jens Mehrhoff, Deutsche Bundesbank, Statistics Department
14th Meeting of the Ottawa Group
Tokyo, 20-22 May 2015
Page 13
3. The Bundesbank’s dashboard

− Since 2010, only the price indicators for Germany demonstrated strong
  upward movements.

− The Bundesbank could not, on the basis of model-based analyses of the
  valuation situation in the housing market, detect any notable deviations from
  fundamentally justified housing prices throughout Germany.

− Hence, at present, no substantial macroeconomic risks are arising from the
  price structure on the housing market.

− In the 127 cities studied, current estimates put upward price deviations at
  between 10% and 20%, measured in terms of the longer-term demographic
  and economic variables; with freehold apartments in major cities showing
  the strongest overvaluations.

Jens Mehrhoff, Deutsche Bundesbank, Statistics Department
14th Meeting of the Ottawa Group
Tokyo, 20-22 May 2015
Page 14
3. The Bundesbank’s dashboard
Despite the low interest rates, growth in mortgage loans is still sluggish.

Jens Mehrhoff, Deutsche Bundesbank, Statistics Department
14th Meeting of the Ottawa Group
Tokyo, 20-22 May 2015
Page 15
3. The Bundesbank’s dashboard

− The other indicators mentioned above did not reach critical levels.

− However, studies of averages throughout Germany have limited value, as
  moderate rates of increase in housing loans for the whole of Germany could
  obscure a heterogeneous regional distribution of lending growth.

− The Bundesbank’s analyses show very few signs of procyclical behaviour
  by banks or of a destabilising nexus between mortgage lending and
  property prices. However, it is striking that, in the towns and cities under
  consideration with sharply rising housing prices, a large share of
  mortgages have a German sustainable loan-to-value ratio
  (Beleihungsauslauf) of over 100%.

− This points to structural vulnerabilities in the German banking system to
  urban real estate market risks.
Jens Mehrhoff, Deutsche Bundesbank, Statistics Department
14th Meeting of the Ottawa Group
Tokyo, 20-22 May 2015
Page 16
4. Spatial dependencies
Price changes from 2013 to 2014, in %                            Price-to-rent ratio in 2014

                                                                                               50
                                                            12

                                                            10                                 45

                                                            8
                                                                                               40

                                                            6

                                                                                               35

                                                            4

                                                                                               30

                                                            2

                                                                                               25
                                                            0

                                                            -2                                 20

                                                            -4
                                                                                               15

Jens Mehrhoff, Deutsche Bundesbank, Statistics Department
14th Meeting of the Ottawa Group
Tokyo, 20-22 May 2015
Page 17
4. Spatial dependencies − Although the differences in price rises between the regions diminished again in 2014, waning price dynamics did not reduce existing gaps between Southern and Northern Germany as well as Western and Eastern Germany. − Special effects in prices are attributable to tourism, particularly at the North Sea and Baltic coasts. − The steep rise in prices has so far been largely confined to regions with an urban character. − With regard to the future stability of the residential property market as a whole, it is therefore of key importance to investigate the spatial transmission channels of price impulses in greater depth. Jens Mehrhoff, Deutsche Bundesbank, Statistics Department 14th Meeting of the Ottawa Group Tokyo, 20-22 May 2015 Page 18
Contact

Dr Jens Mehrhoff
Head of Section Business Cycle, Price and Property Market Statistics
Deutsche Bundesbank
Central Office
General Economic Statistics

Wilhelm-Epstein-Strasse 14
60431 Frankfurt am Main, Germany

Tel: +49 69 9566 3417
Mobile: +49 172 7950739
Fax: +49 69 9566 2941
E-mail: jens.mehrhoff@bundesbank.de
www.bundesbank.de

Jens Mehrhoff, Deutsche Bundesbank, Statistics Department
14th Meeting of the Ottawa Group
Tokyo, 20-22 May 2015
Page 19
You can also read